Categories
Forex Market Analysis

Russell 2000’s advance Boosted by Stimulus Talks

Overview

The Russell 2000 index, grouping the 2,000 U.S. small-cap companies, began this trading week, maintaining its previous week’s gains driven by the economic stimulus talks. The price action continues supporting fresh highs that could lead Russell 2000 to erase its yearly losses.

Market Sentiment Overview

The US benchmark that groups the 2000 small-cap companies continues its recovery, reaching new highs, soaring to 1,649.05 pts in the first trading session of the week. 

After President Trump’s return to the White House activities, the investor sentiment is driven by negotiations about a new economic stimulus. In this context, market participants seem to be buying the rumor of further stimulus for the economy before the presidential elections that will take place on November 03rd.

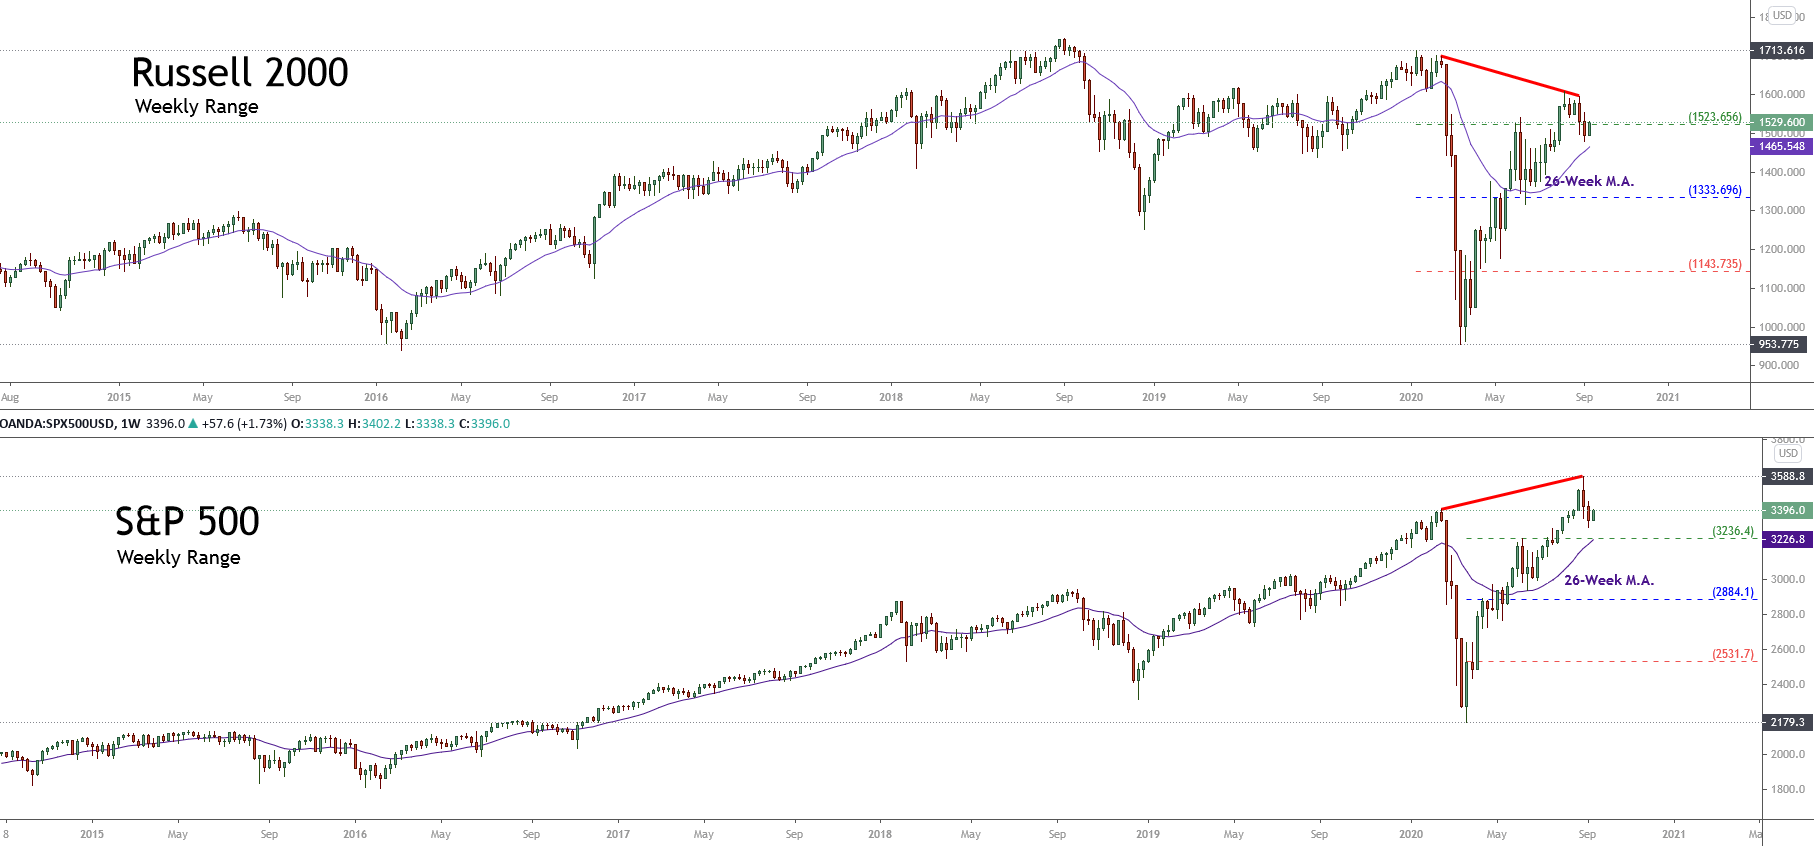
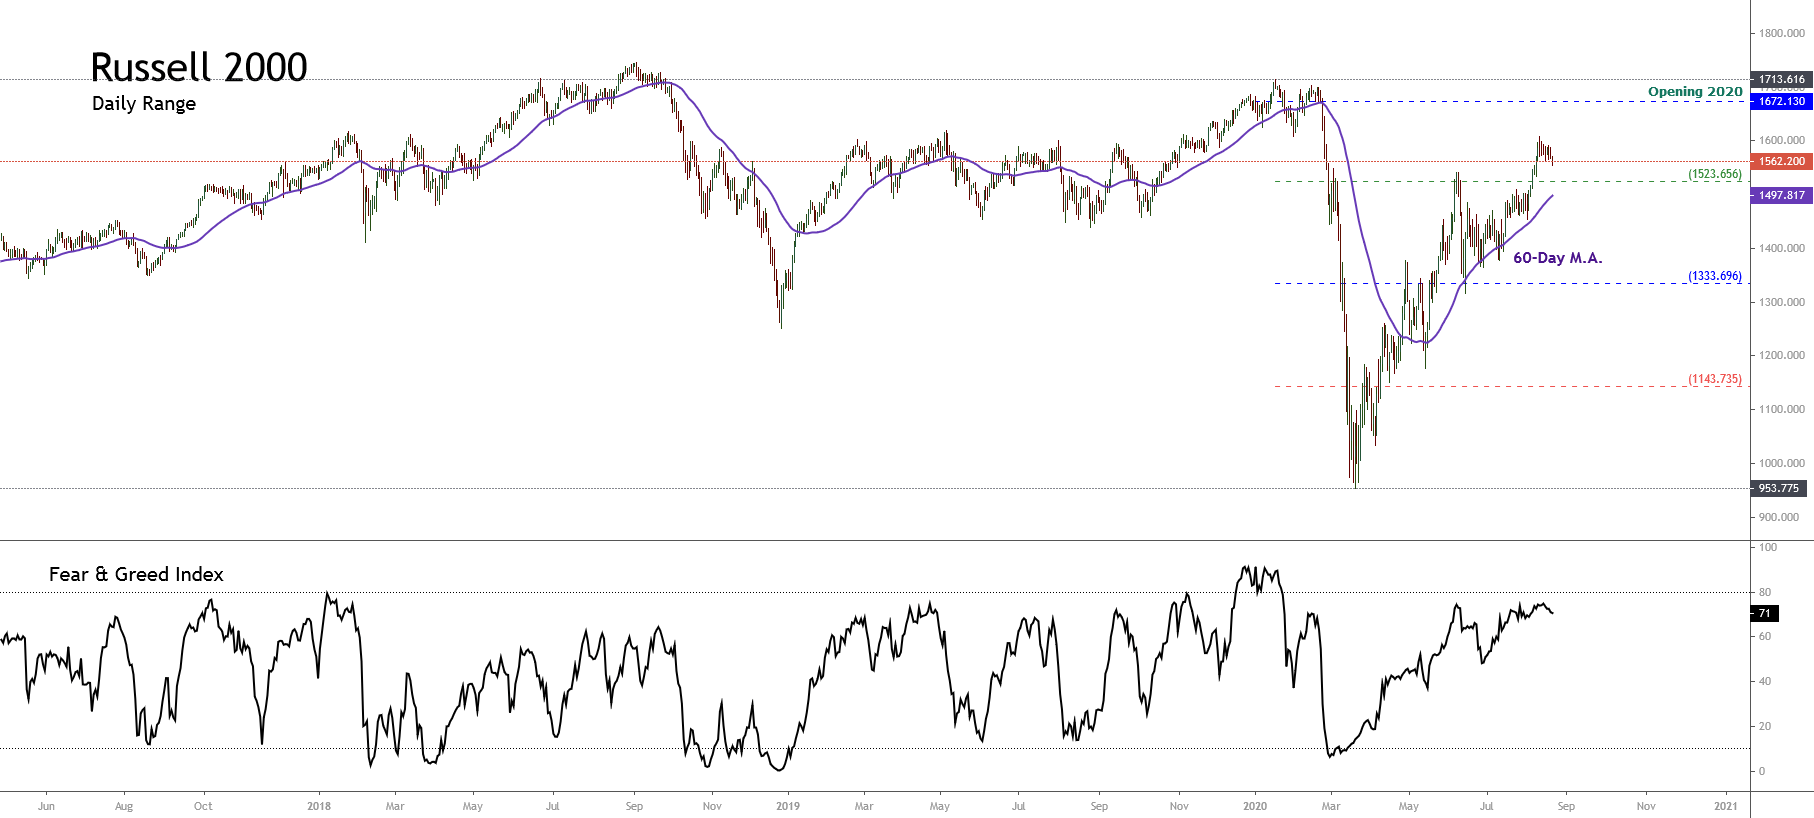
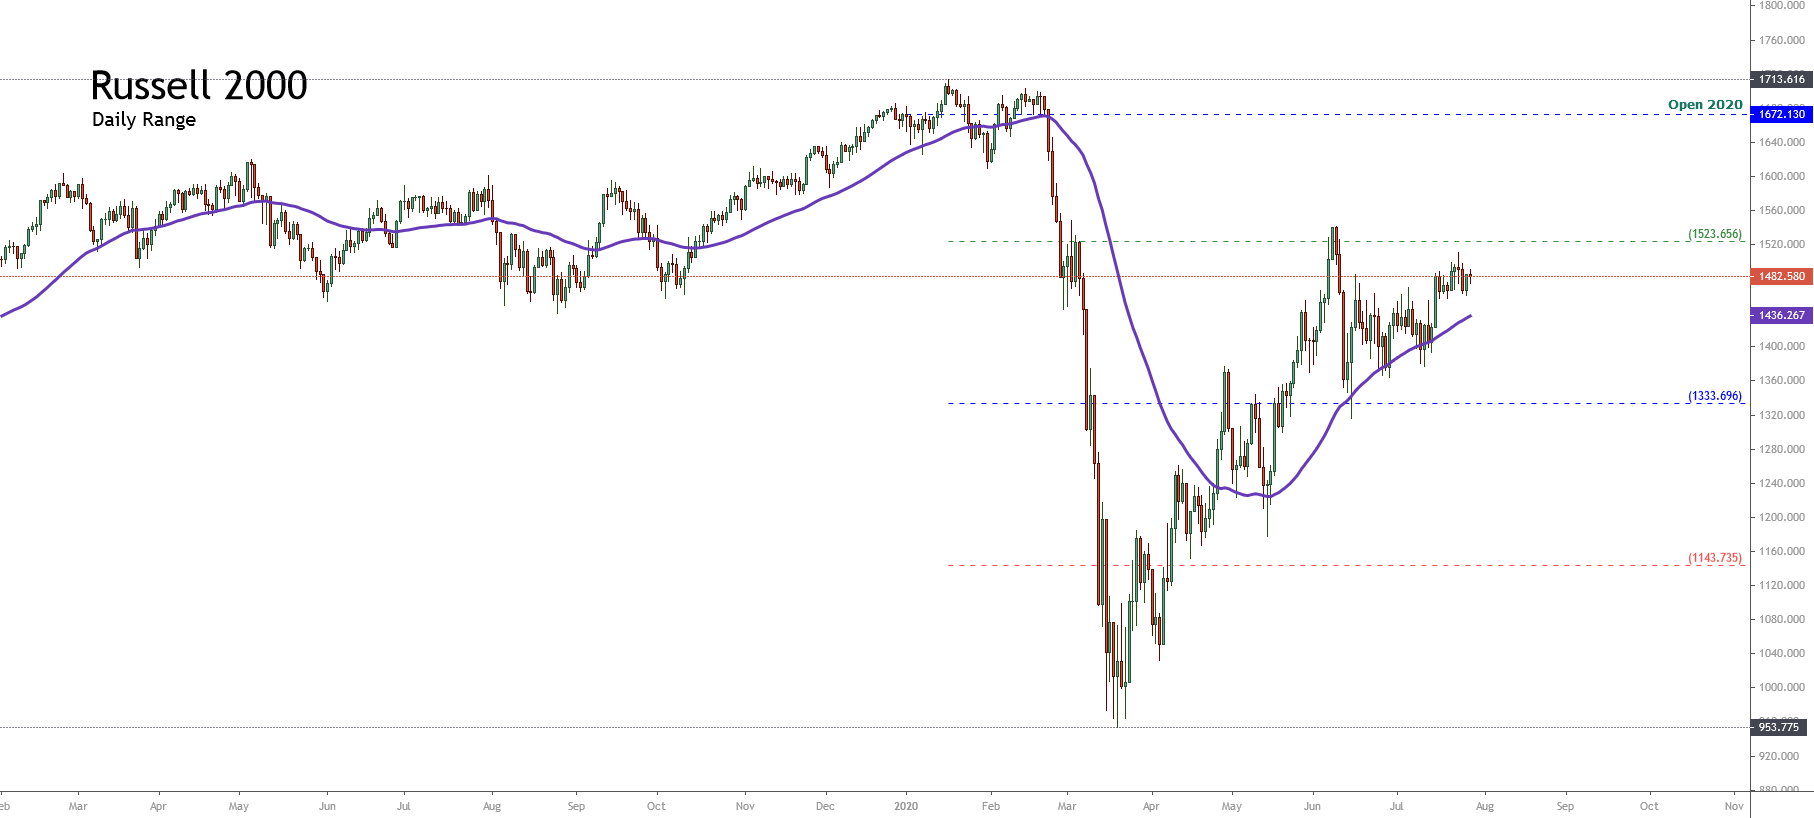
The chart below shows the 52-week high and low range of Russell 2000, in which the price action unveils the advance in the extreme bullish sentiment zone. In turn, Russell 2000 continues developing its action above the 60-day short-term moving average, following the direction and the dominant bullish sentiment in the American stock market. 

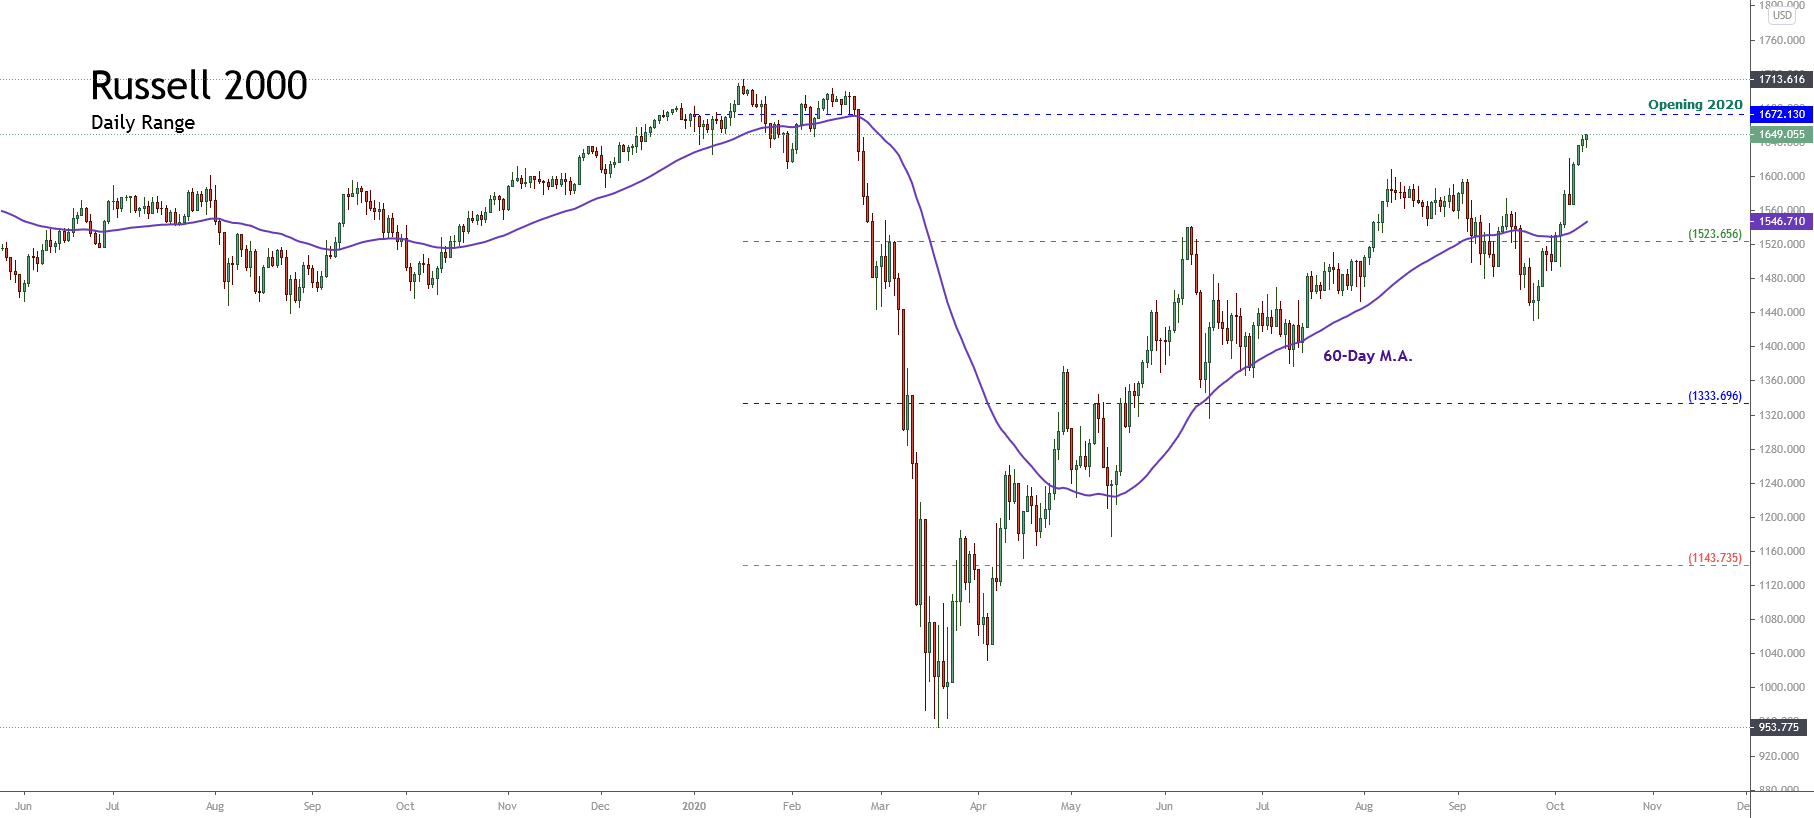
In the previous chart,  we observe that the bullish momentum maintained by Russell 2000 could exceed the annual opening value of 1,672.13 pts. In this process, the US small-cap index could erase all of the losses originated by the massive sell-off that happened in the second half of February.

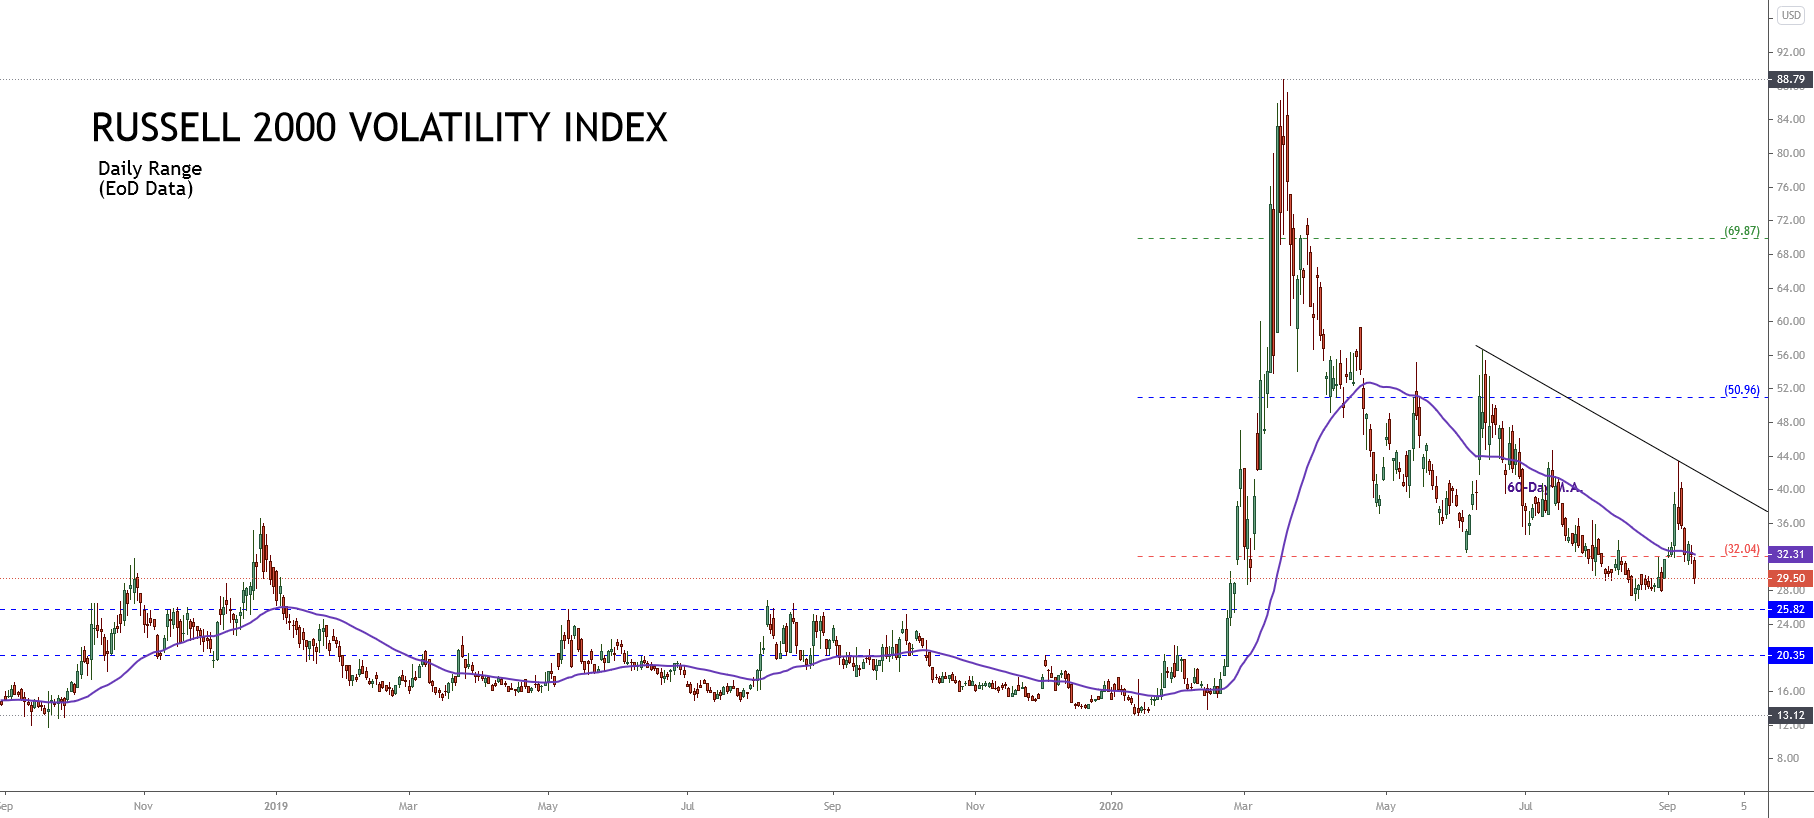
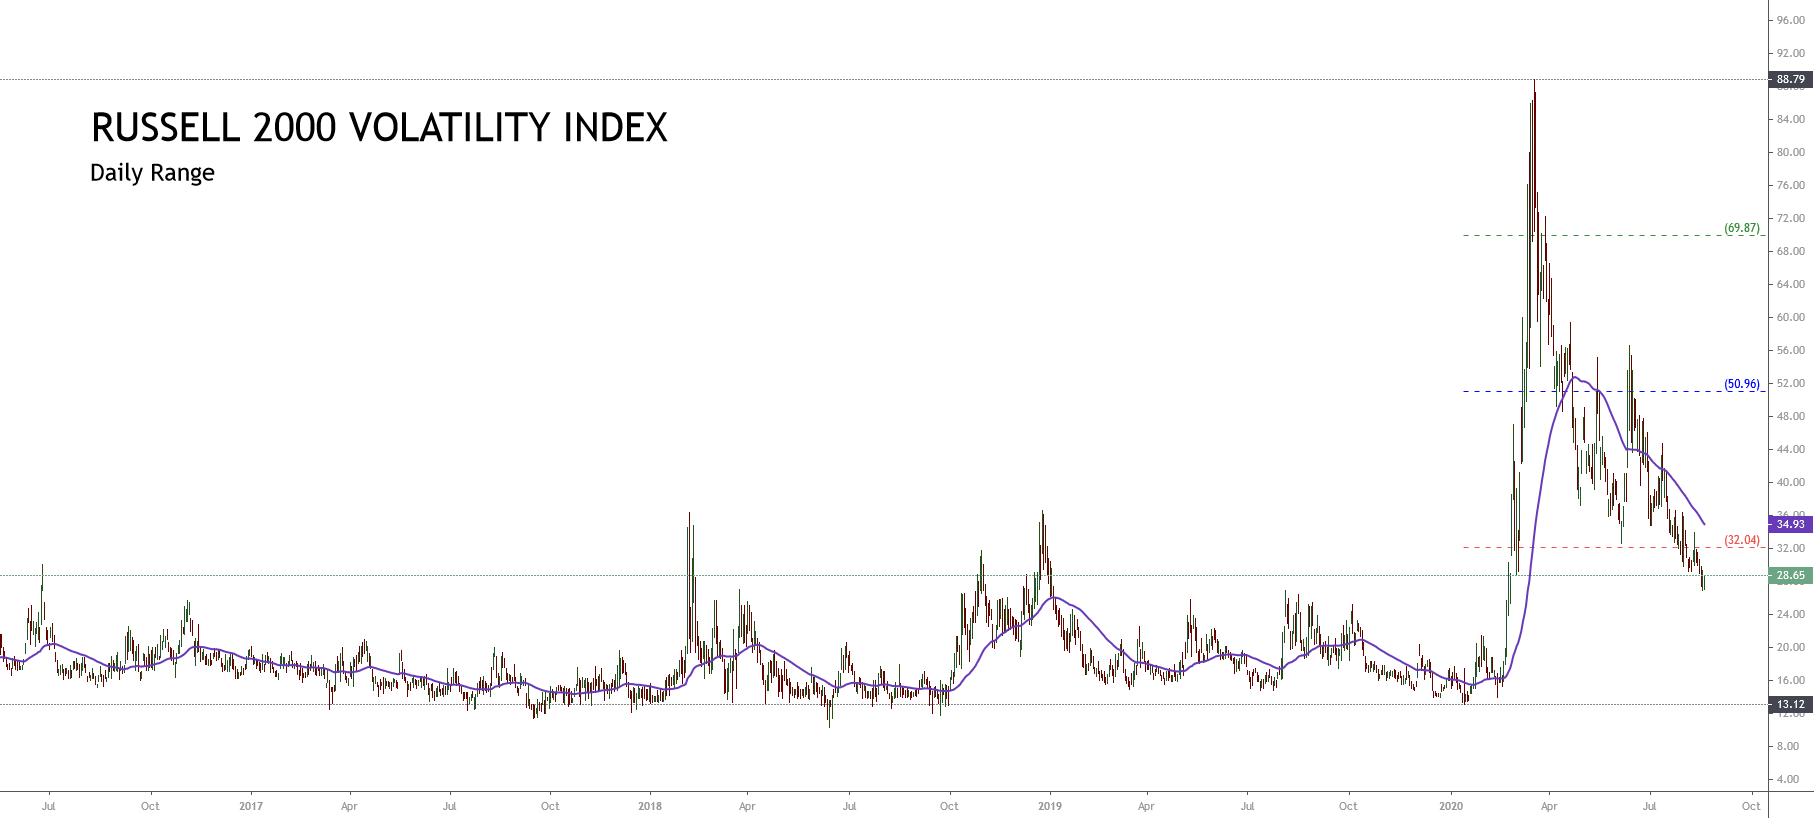
On the other hand, the next figure corresponds to the Russell 2000 Volatility Index (RVX) in its daily timeframe, highlighting the bearish breakdown from the sideways range maintained since September 21st. This breakdown led the RVX to re-enter the extreme bearish zone, supporting the extreme bullish sentiment of Russell 2000.

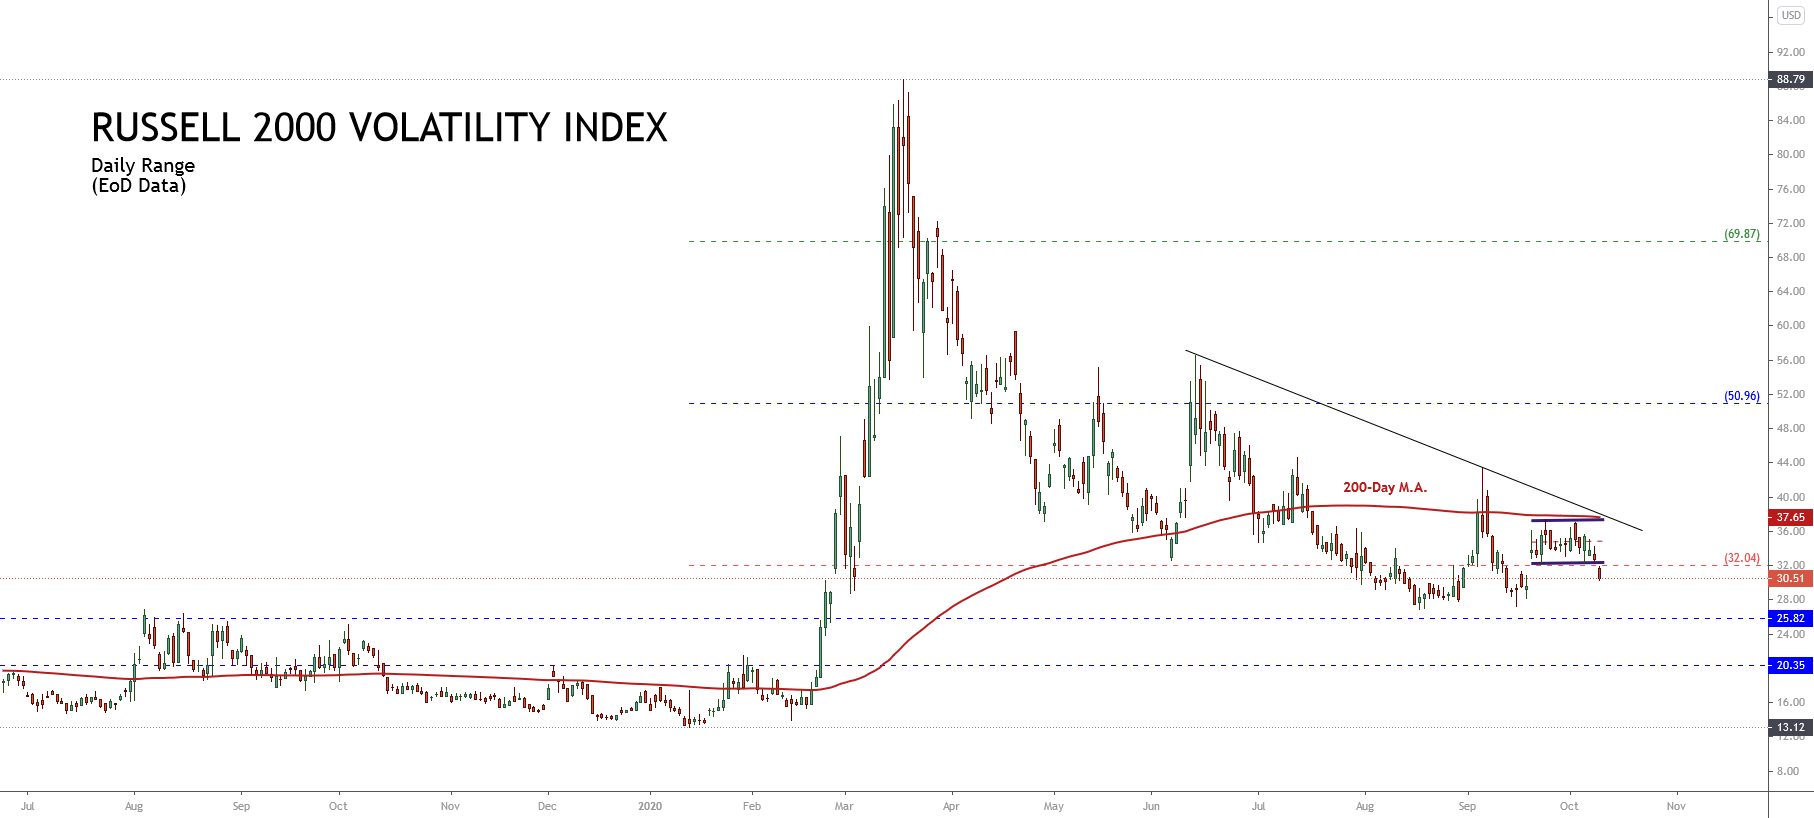
Consequently, the market sentiment context for Russell 2000 continues to favor bullish movements that could go as far as the approval of the new economic stimulus or until the US presidential elections.

Technical Analysis Outlook

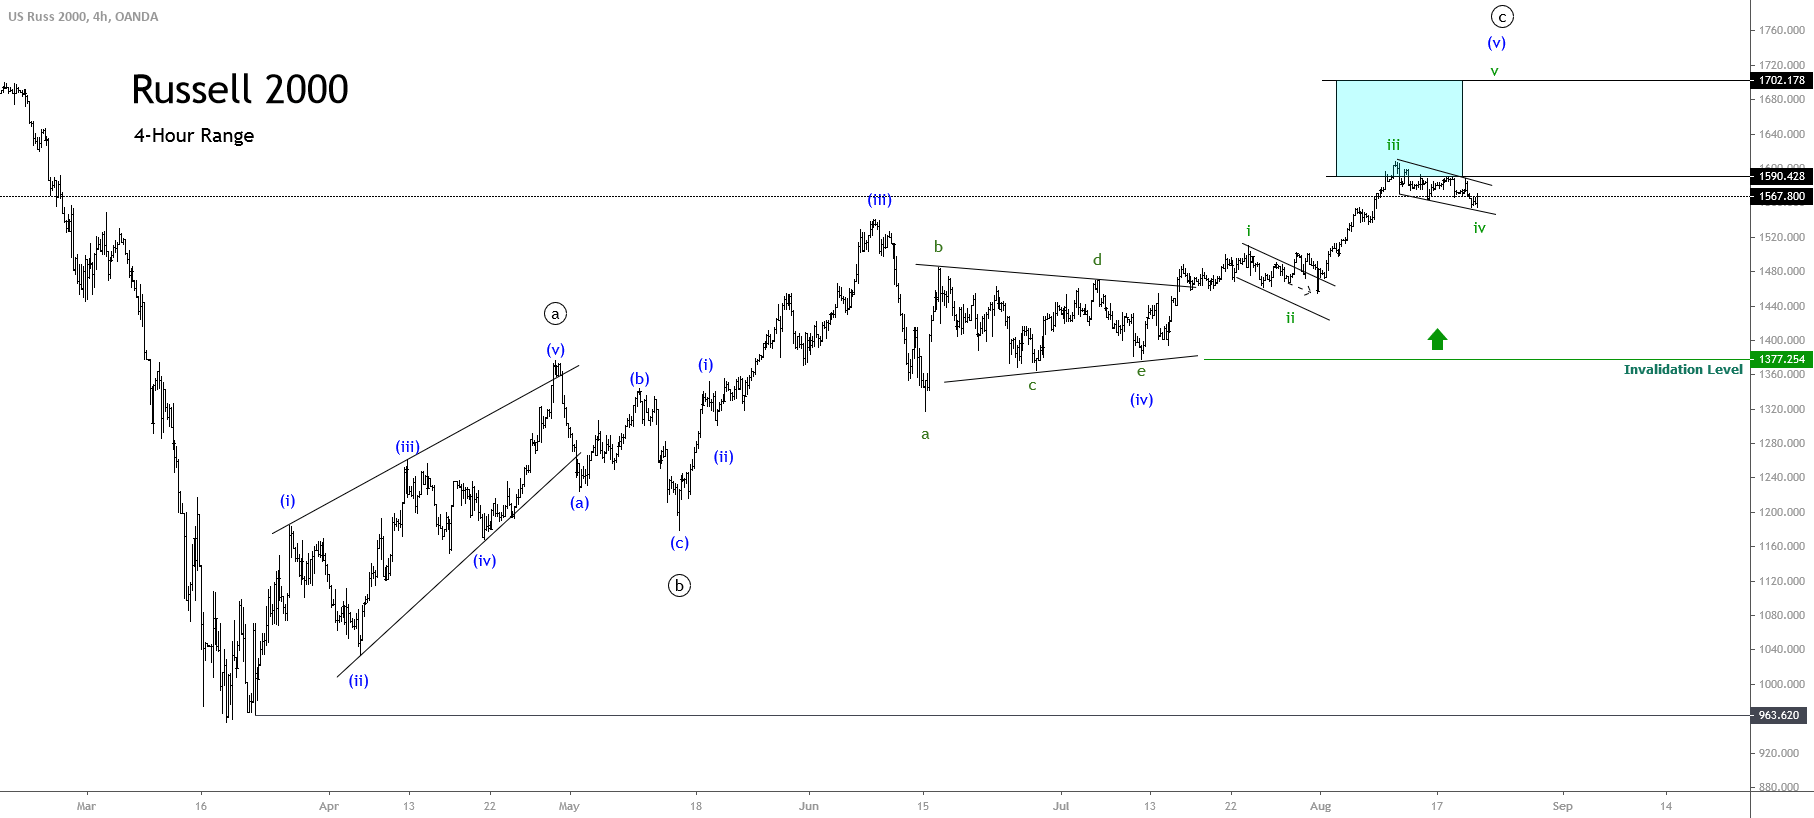
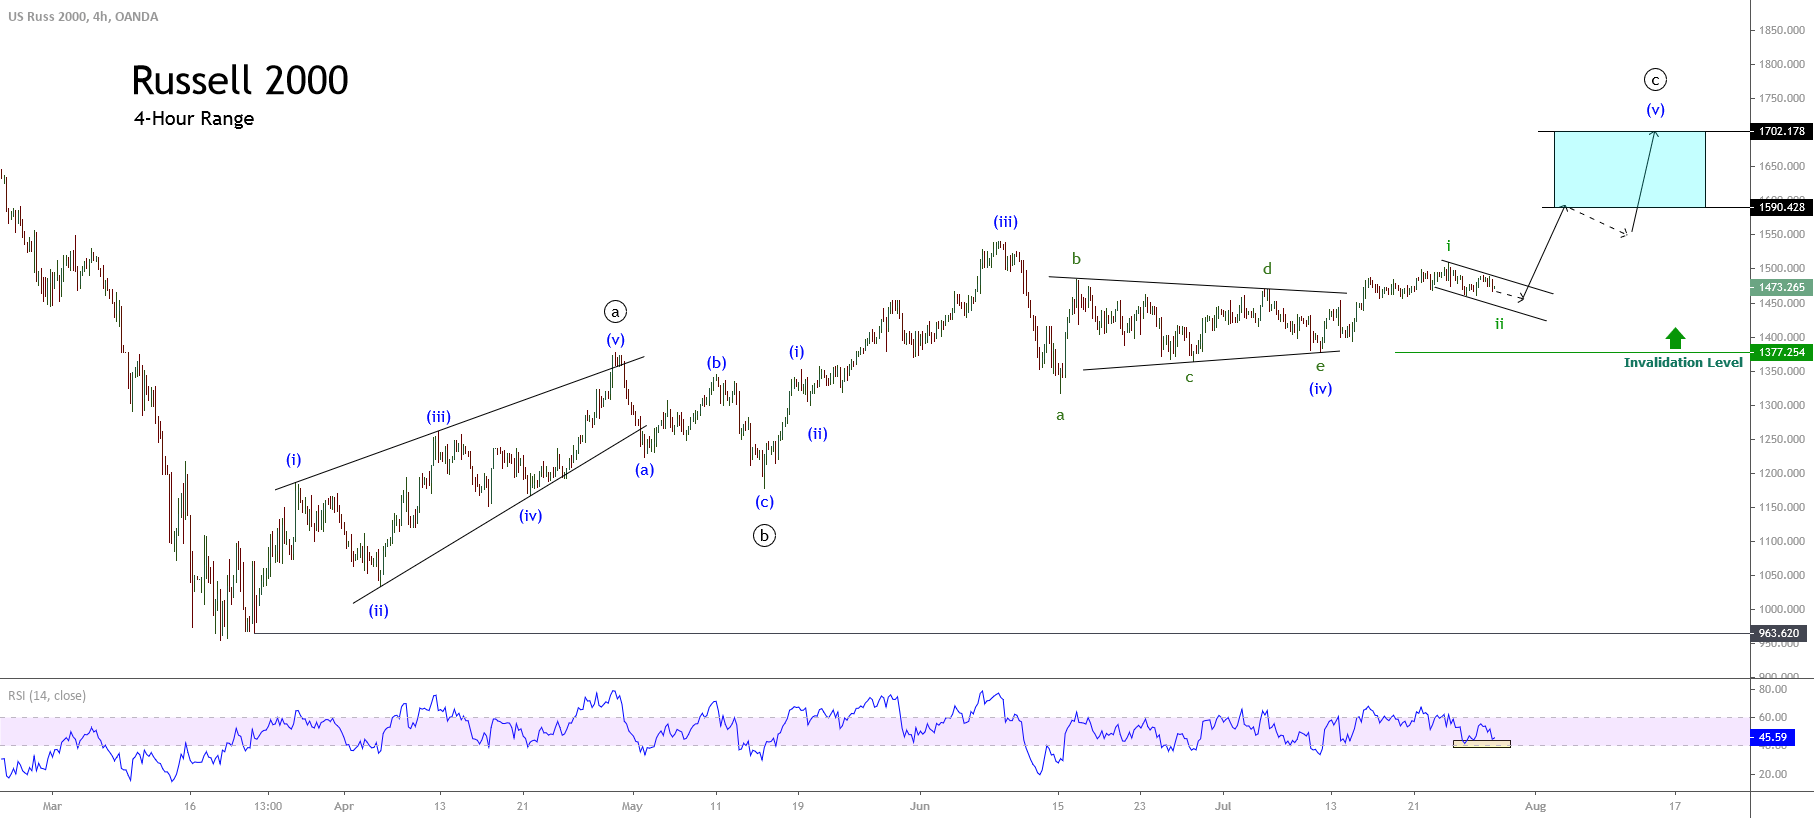
From a technical analysis perspective, The Russell 2000 in its 12-hour chart shows an upward movement that began on March 23rd when the price confirmed the floor of mass selling at 963.62 pts, which remains valid.

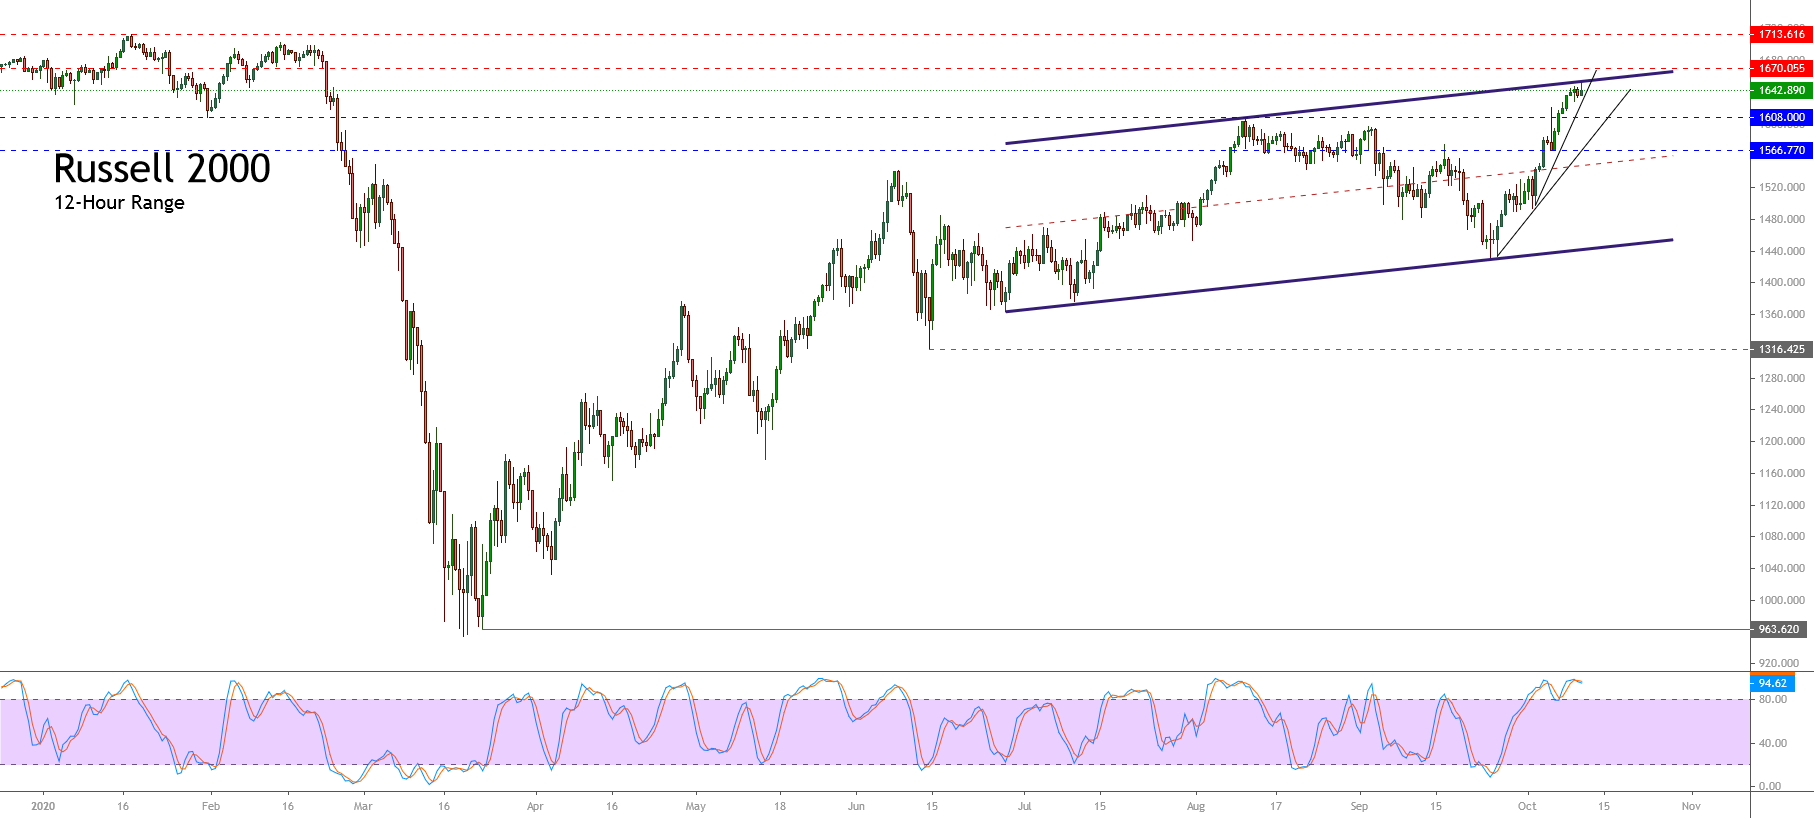
The previous chart unveils the mid-term bullish sequence, which started on June 14th at 1.316.42 pts. The upward movement developed by Russell 2000 is projecting an ascending channel in which the price is seen striking the channel’s upper line. This context points to a limited correction before continuing the short-term bullish trend.

On the other hand, the 94.62% level observed in the stochastic oscillator shows the Russel 2000 overbought; in turn, considering it as a timing indicator, it shows that it is not a suitable option for bullish entries under this circumstances.

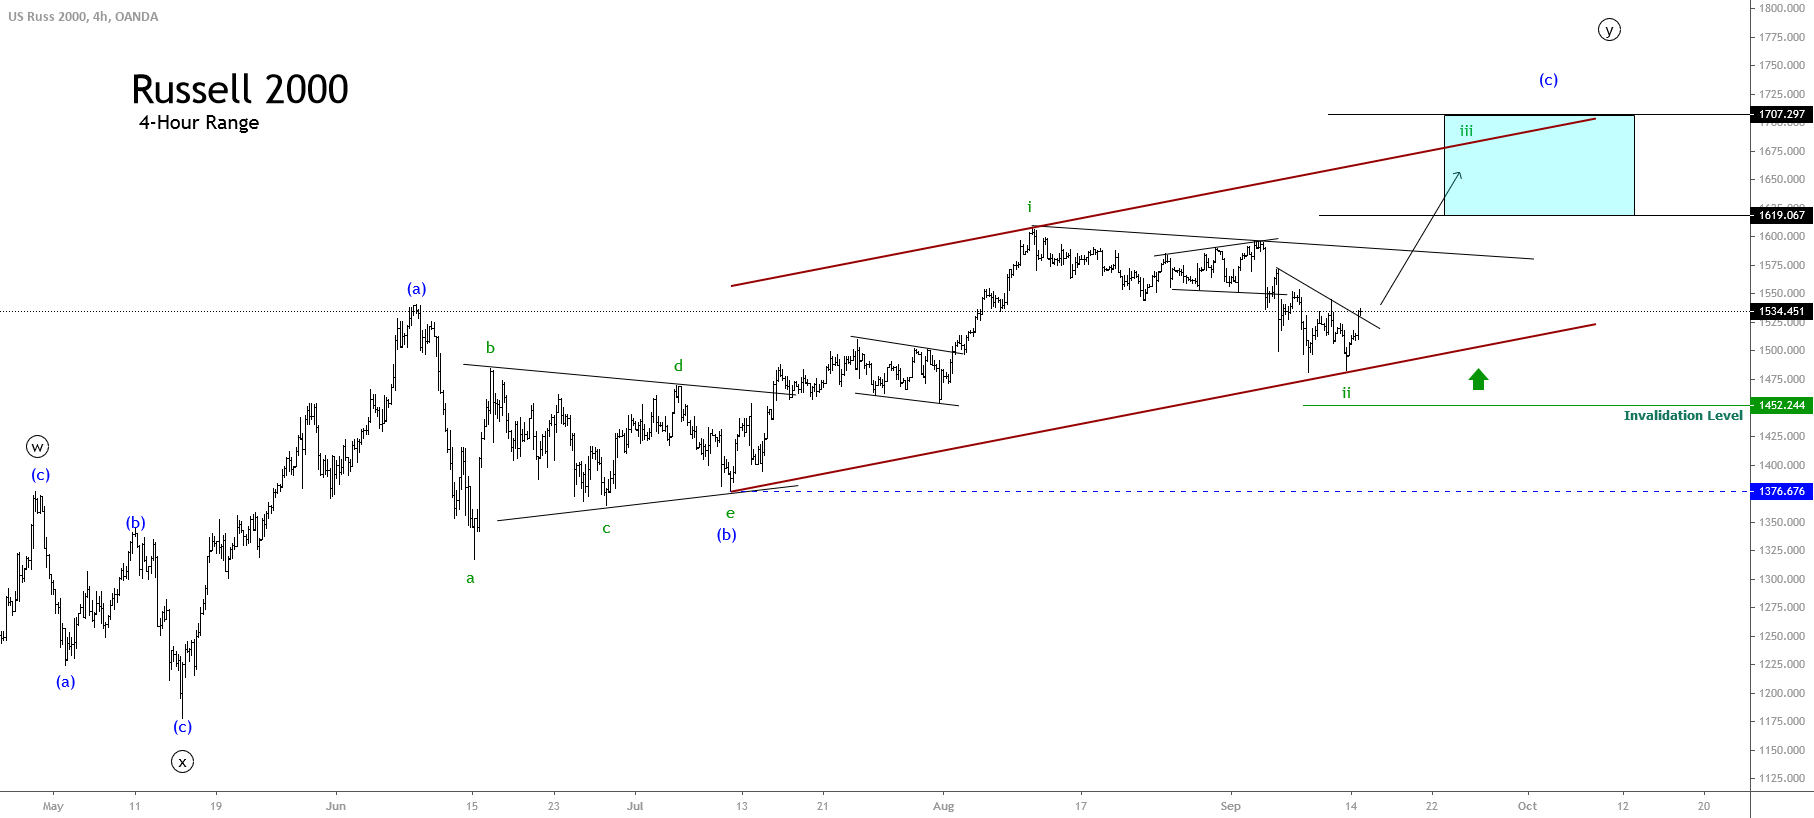
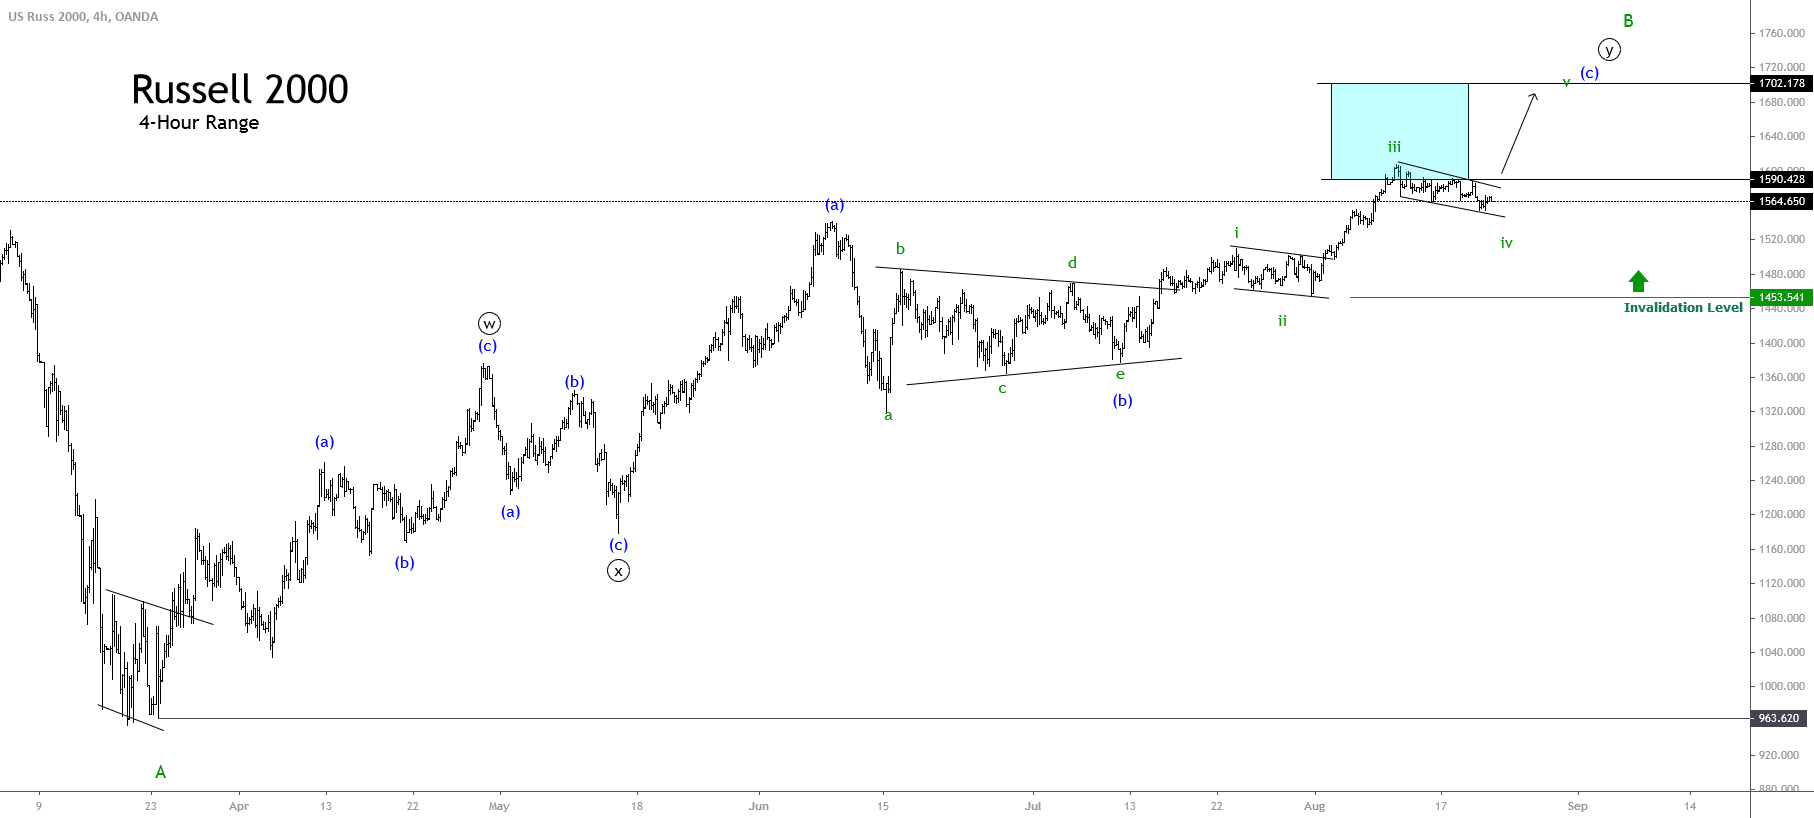
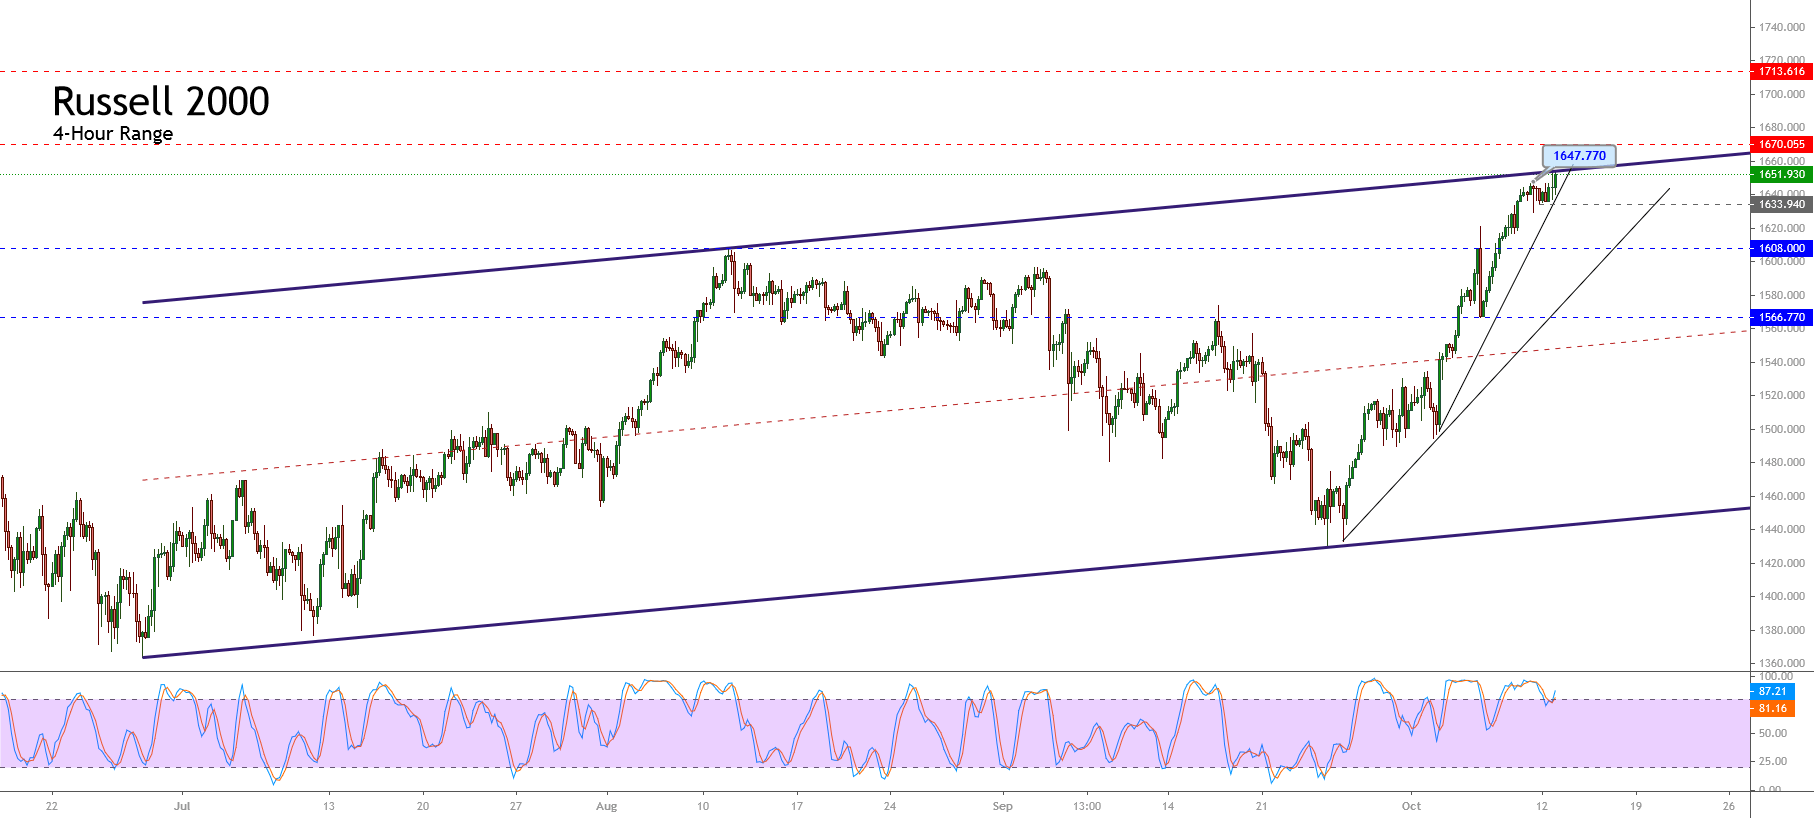
The following 4-hour of the Russell 2000 shows the short-term trading zones at which bullish bias prevails. In this context, the bullish continuity, which would be confirmed after the break of the mid-term ascending channel’s upper line, has as key resistance levels 1,670.05 and 1,713.61 pts. A drop and close below the low of the week 1,633.94 pts could lead the price towards the following areas; 1,608.00 to 1,566.77 pts.

In conclusion, Russell 2000 holds its upward pressure; the market sentiment and price action continue to show further increases. Nevertheless, the extreme bullish sentiment backed by the news media created a market participants’ consensus, which assumes that the stock market will continue rallying with the economic stimulus approval. Thus, our bias remains on the neutral side.

Categories
Forex Market Analysis

Russell 2000 Resume its Advances

Overview

Russell 2000 advances on the first trading session of the week, reporting gains over 2.6%. The market sentiment reveals to us the penetration in the extreme bullish sentiment zone, supporting the possibility of fresh upsides. In this regard, the Elliott Wave structure exposes an incomplete bullish structure supporting the likelihood of further rises.

Market Sentiment Overview

Russell 2000 advances over 2.6% in the first session of the week, easing the bearish sentiment that dominated the previous two weeks sell-off in where the U.S. index that groups to the 2,000 small capitalized companies plummeted over 5%.

The big picture of Russell 2000 exposes a divergence with the S&P 500. From the following weekly chart, we distinguish to Russell 2000 without confirming the S&P 500 record high at 3,588.8 pts reached on September 02nd. According to the Dow Theory, the fresh highs must be confirmed, and divergence must be considered an exhaustion or reversal signal of the current bull market. In this case, Russell 2000 remains without confirming the last record high reached by the S&P 500.

Although both indices move above the 26-week moving average, indicating the upward bias on the stock market, the S&P 500 remains moving in the extreme bullish sentiment zone while the Russell 2000 looks bouncing toward the extreme bullish sentiment zone. This market context carries us to expect for Russell 2000 the possibility that the price visits fresh highs, even surpassing the 1,600 pts.

The next daily chart of Russell 2000 unveils the price action bouncing from last July’s previous consolidation zone. The bullish reaction developed by the Russell leads us to foresee further upsides in the following trading sessions.

Simultaneously, the Fear & Greed index looks moving below level 50, which corresponds to the “fear zone.” This lecture added to the bearish sentiment of news media, leads us to expect a bullish reversal move.

Regarding the volatility side, the Russell 2000 Volatility Index reveals the extreme bearish sentiment zone penetration. This decline confirms the possibility of further declines to the area between 25.82 to 20.35, from where the price could find support.


In consequence, considering the penetration to the extreme bullish sentiment zone of Russell 2000 and the lowest level observed in the Russell 2000 Volatility Index, we expect fresh upsides in the U.S. stock market.

Elliott Wave Outlook

The short-term outlook under the Elliott wave perspective of Russell 2000 illustrates the advance on an incomplete five-wave sequence, which began on July 10th when the U.S. index found fresh buyers at 1,376.67 pts, starting the current bullish cycle that remains in progress.

From the 4-hour chart, we distinguish the completion of the second wave of Subminuette degree labeled in green. According to the Elliott wave theory, the canalization with its base-line from the end of wave (b) of Minuette degree identified in blue as the origin to wave ii in green and projected until the end of the first wave of the same degree should provide the target of the third wave. In this context, the potential third wave could advance to 1,617.06 and extend 1,707.29 pts.

Finally, the bullish bias confirmation will occur if the price closes above the last intraday descending trendline. At the same time, the current upward scenario will remain active while the Russell 2000 index keeps moving above 1,452.24 pts.


Categories
Forex Market Analysis

Russell 2000 in Consolidation, Expecting for More Upsides

Overview

The Russell 2000 Index raised over 64% off its lowest level of the year, advancing from the extreme bearish to the extreme bullish sentiment zone. The incomplete complex corrective structure, still in progress, calls for more upsides in the coming trading sessions.

Market Sentiment Overview

This year, the Russell 2000 index is underperforming by 6.24% (YTD); however, it continues its recovery from the first quarter massive sell-off, when the U.S. index plummeted until its lowest level of the year at 953.77 pts, currently advancing 64.38% off its lows. 

The Russell 2000’s daily chart shows it’s moving inside the 52-week high-low range, exposing the development of a consolidation formation in the extreme bullish sentiment zone. Simultaneously, the 71-point reading observed in the fear and greed index reveals a bullish bias, helping support the upward bias that now prevails on the Russell 2000 Index. 

On the other hand, Russell 2000’s volatility index shows it’s moving in the extreme bearish sentiment zone, which increases the bullish perspective for the U.S index grouping the 2,000 small-cap U.S. companies.

Consequently, both the market structure consolidating in the extreme bullish sentiment zone and the decreasing volatility observed, lead us to expect further upsides for the following trading sessions, which could make it advance till its opening level of the year, at 1,672 pts.

Elliott Wave Outlook

The short-term overview under the Elliott wave perspective is shown in its 4-hour chart, which reveals the structure of a bullish sequence that remains intact since March 23rd when Russell 2000 found fresh buyers at 963.62 pts.

In the previous chart, we distinguish Russell 2000’s upward progression, moving in a complex corrective formation identified as a double three pattern (3-3-3) of Minute degree, marked in black, which belongs to a wave B of Minor degree labeled in green. 

The complexity level in the corrective sequence could be understood under the alternation principle context. Observing the first chart and considering the aggressive sell-off, lasting about in one month (since mid-February till mid-March), the alternation principle states that after a high-momentum level movement, a reduced-momentum move comes next, and vice versa.

Currently, Russell 2000 advances in wave (c) of Minuette degree, which began on July 10th when the U.S. index ended the wave e of the triangle pattern corresponding to wave (b) in blue. Once wave (b) was completed, the market participants pushed prices higher, carrying it till the 1,608 level on August 11th after the Russell 2000 Index found stiff resistance, which ended wave iii of Subminuette degree identified in green.

Consequently, we expect a limited sideways movement during the following trading sessions before continuing its advance toward fresh highs. Russell’s next upward movement could boost it to the 1,702.17 level, to test last February’s highs.

Categories
Forex Market Analysis

Russell 2000 Technical Overview

The U.S. stock index Russell 2,000 and the S&P 500 shows a divergence in its long-term trend. While the S&P 500 reaches fresh highs recovering from its 2020’s losses, the Russell 2000 index remains negative.

As the previous chart illustrates, Russell 2000 continues moving below its 24-month moving average while the S&P 500 already moves on the bullish side. This market context could lead Russell 2000 to see more declines in the coming weeks, although, currently the short-term bias is still hinting to further advances.

Market Sentiment Overview

This year, the index that groups the 2,000 most prominent small-cap U.S. companies sheds near 11.5% (YTD), dragged by the pandemic lockdown.

The following chart exposes to Russell 2000 in its daily timeframe. On the figure, we distinguish the price moving above the 60-day moving average, which leads us to conclude that the short-term bias still remains on the bullish side.

At the same time, from the 52-week high and low range, we note the price action continues moving bellow the 1,523.65 pts, which makes us hold our bullish bias. In this context, the possibility of a strike over the 1,523.65 pts could reveal an extreme bullish sentiment on the Russell 2000 index.

On the other hand, the absence of a bearish reversal pattern discards, for now, the probability of a plummet in the U.S. stock market.

Elliott Wave Outlook

The short-term Elliott wave perspective of the Russell 2000 index exposed in its 4-hour chart reveals the recovery experienced by the U.S. stock market from last March 23rd when the price found fresh buyers at 963.62 pts.

In the previous chart, we observe a first five-wave structural sequence corresponding to a leading diagonal pattern identified as wave ((a)) of Minute degree labeled in black. The first five-wave sequence topped at 1,376.52 pts where the price started to develop a corrective move in three waves corresponding to wave ((b)) in black, which found support at 1,177.26 pts on May 14th.

Once the second wave ended, the price began a new rally, which remains in progress. After the third wave of Minuette degree labeled in blue, Russell 2000 developed a correction identified as a triangle pattern. After the breakout of the upper guideline b-d, the U.S. index resumed its short-term upward trend.

Currently, the price action remains consolidating in a wave ii of Subminuette degree identified in green. In this context, the RSI oscillator continues moving above the 40-level, which leads us to confirm the retracement and the bullish bias of Russell 2000.

Finally, the upward continuation could drive to Russell 2000 toward 1,590.42 and even extend its gains until 1,702.17 pts. On the other hand, the bullish scenario will remain valid while the price continues above 1,377.25 pts.