Overview
The Russell 2000 index, grouping the 2,000 U.S. small-cap companies, began this trading week, maintaining its previous week’s gains driven by the economic stimulus talks. The price action continues supporting fresh highs that could lead Russell 2000 to erase its yearly losses.
Market Sentiment Overview
The US benchmark that groups the 2000 small-cap companies continues its recovery, reaching new highs, soaring to 1,649.05 pts in the first trading session of the week.
After President Trump’s return to the White House activities, the investor sentiment is driven by negotiations about a new economic stimulus. In this context, market participants seem to be buying the rumor of further stimulus for the economy before the presidential elections that will take place on November 03rd.
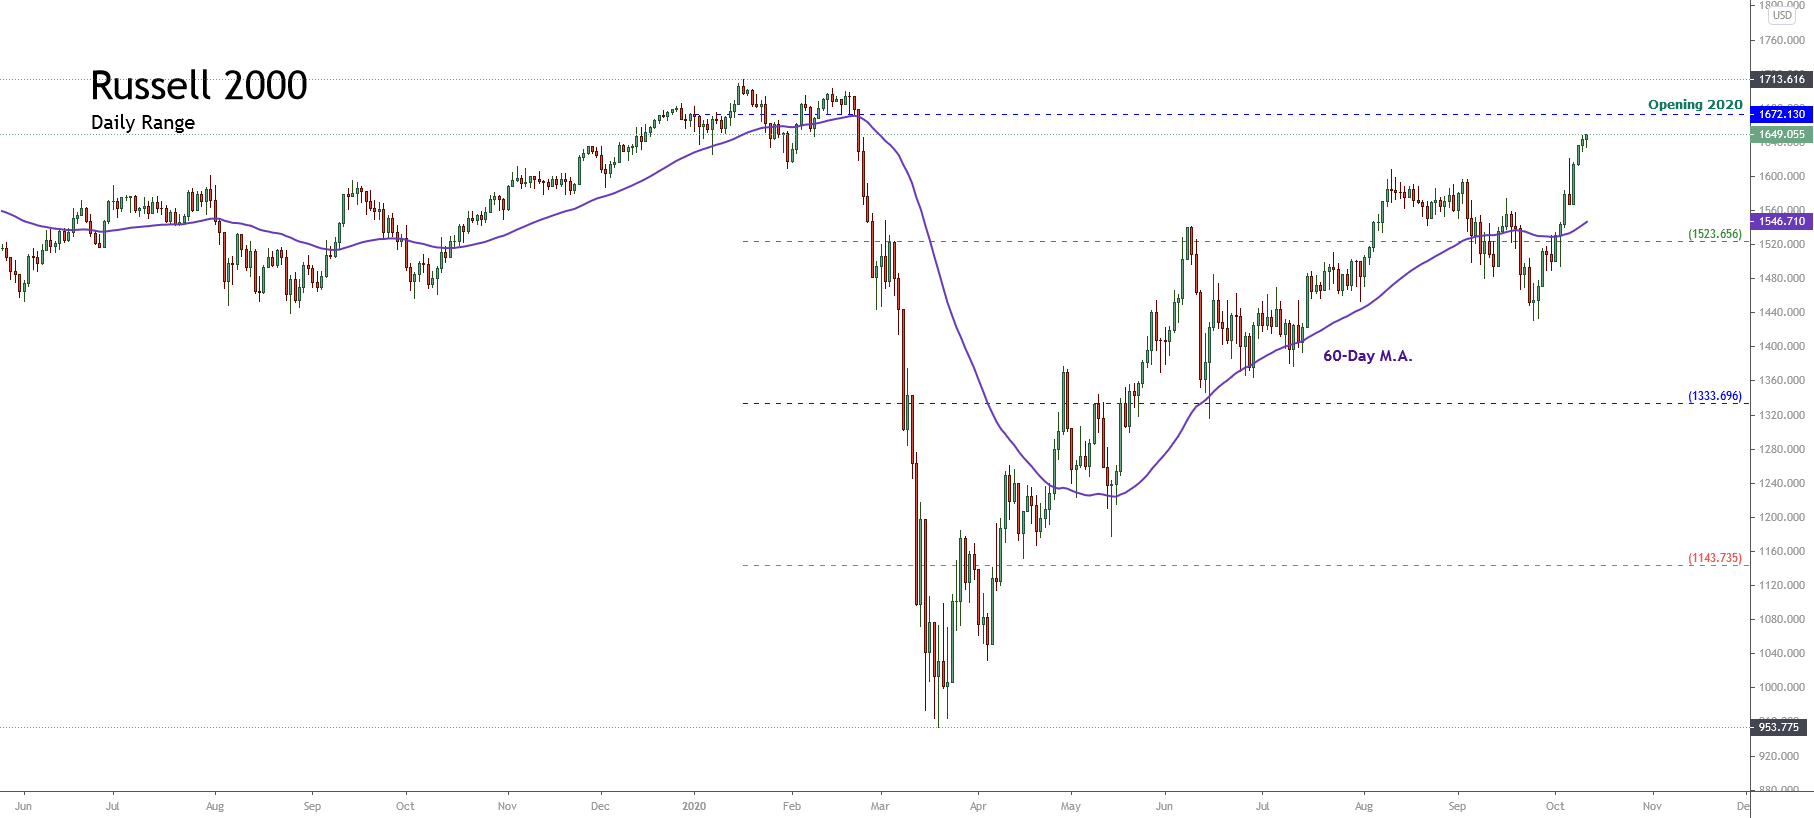
The chart below shows the 52-week high and low range of Russell 2000, in which the price action unveils the advance in the extreme bullish sentiment zone. In turn, Russell 2000 continues developing its action above the 60-day short-term moving average, following the direction and the dominant bullish sentiment in the American stock market.
In the previous chart, we observe that the bullish momentum maintained by Russell 2000 could exceed the annual opening value of 1,672.13 pts. In this process, the US small-cap index could erase all of the losses originated by the massive sell-off that happened in the second half of February.
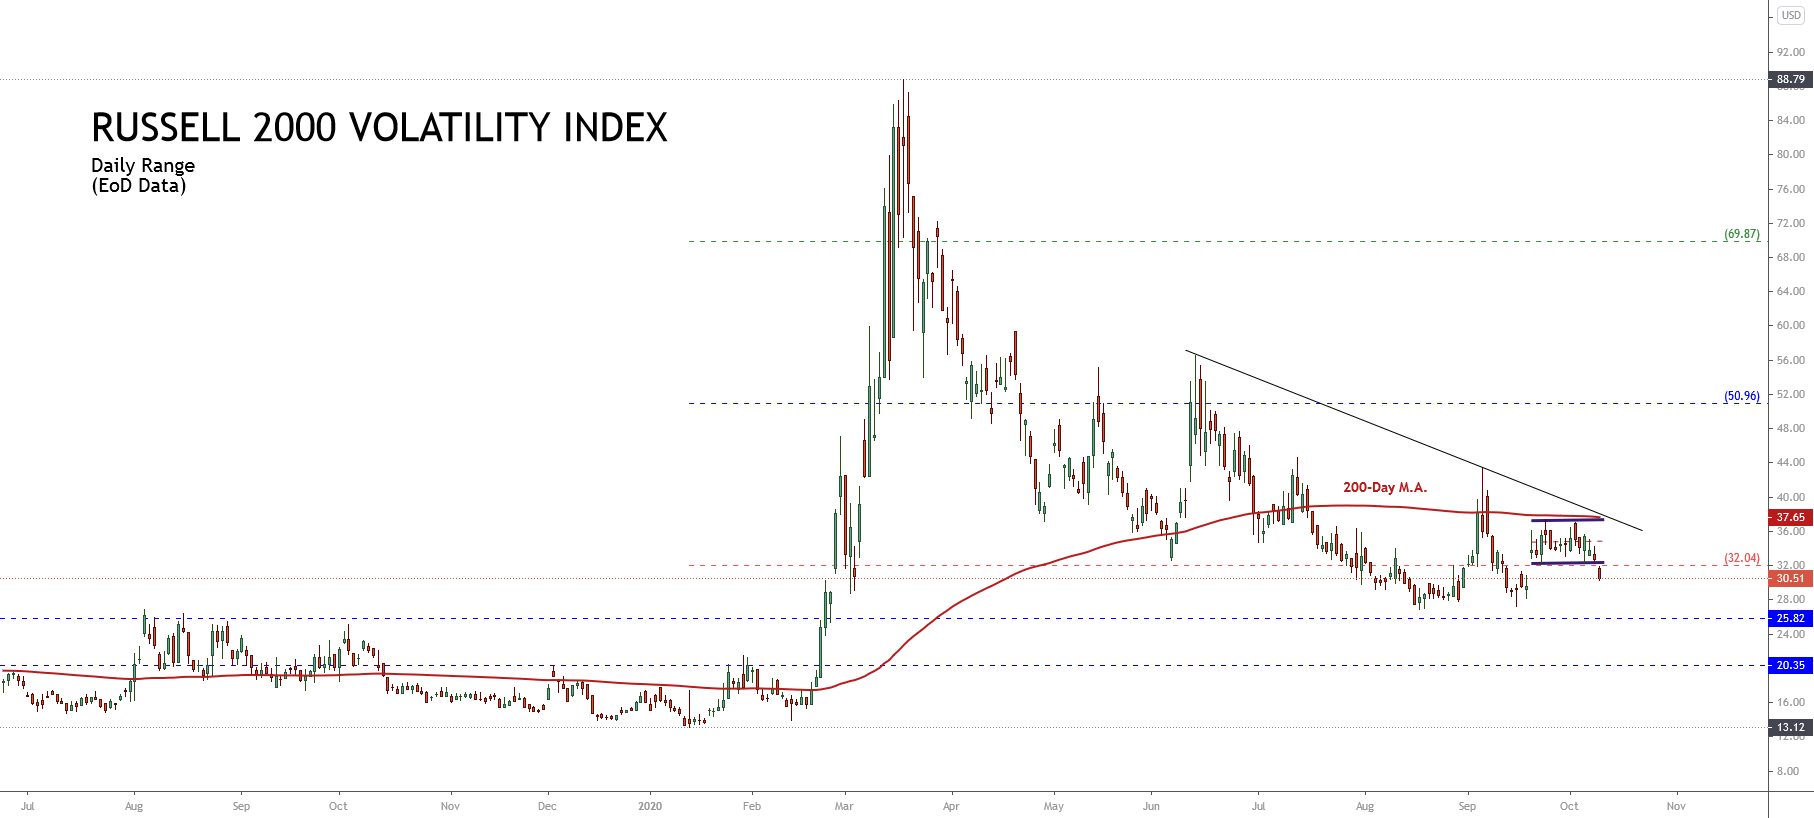
On the other hand, the next figure corresponds to the Russell 2000 Volatility Index (RVX) in its daily timeframe, highlighting the bearish breakdown from the sideways range maintained since September 21st. This breakdown led the RVX to re-enter the extreme bearish zone, supporting the extreme bullish sentiment of Russell 2000.
Consequently, the market sentiment context for Russell 2000 continues to favor bullish movements that could go as far as the approval of the new economic stimulus or until the US presidential elections.
Technical Analysis Outlook
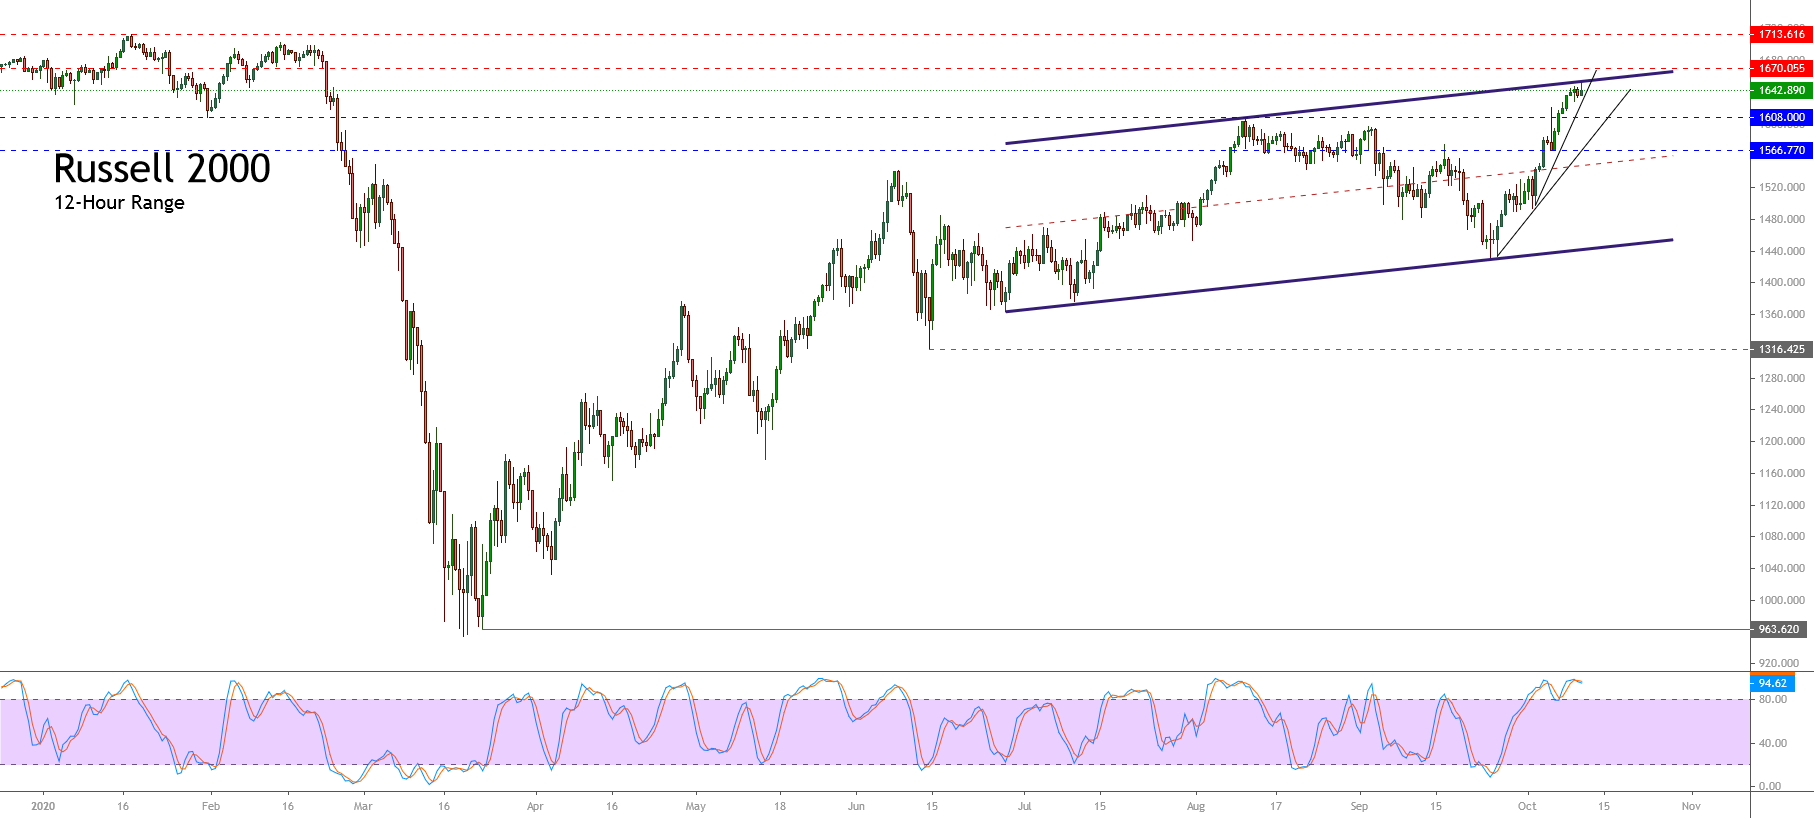
From a technical analysis perspective, The Russell 2000 in its 12-hour chart shows an upward movement that began on March 23rd when the price confirmed the floor of mass selling at 963.62 pts, which remains valid.
The previous chart unveils the mid-term bullish sequence, which started on June 14th at 1.316.42 pts. The upward movement developed by Russell 2000 is projecting an ascending channel in which the price is seen striking the channel’s upper line. This context points to a limited correction before continuing the short-term bullish trend.
On the other hand, the 94.62% level observed in the stochastic oscillator shows the Russel 2000 overbought; in turn, considering it as a timing indicator, it shows that it is not a suitable option for bullish entries under this circumstances.
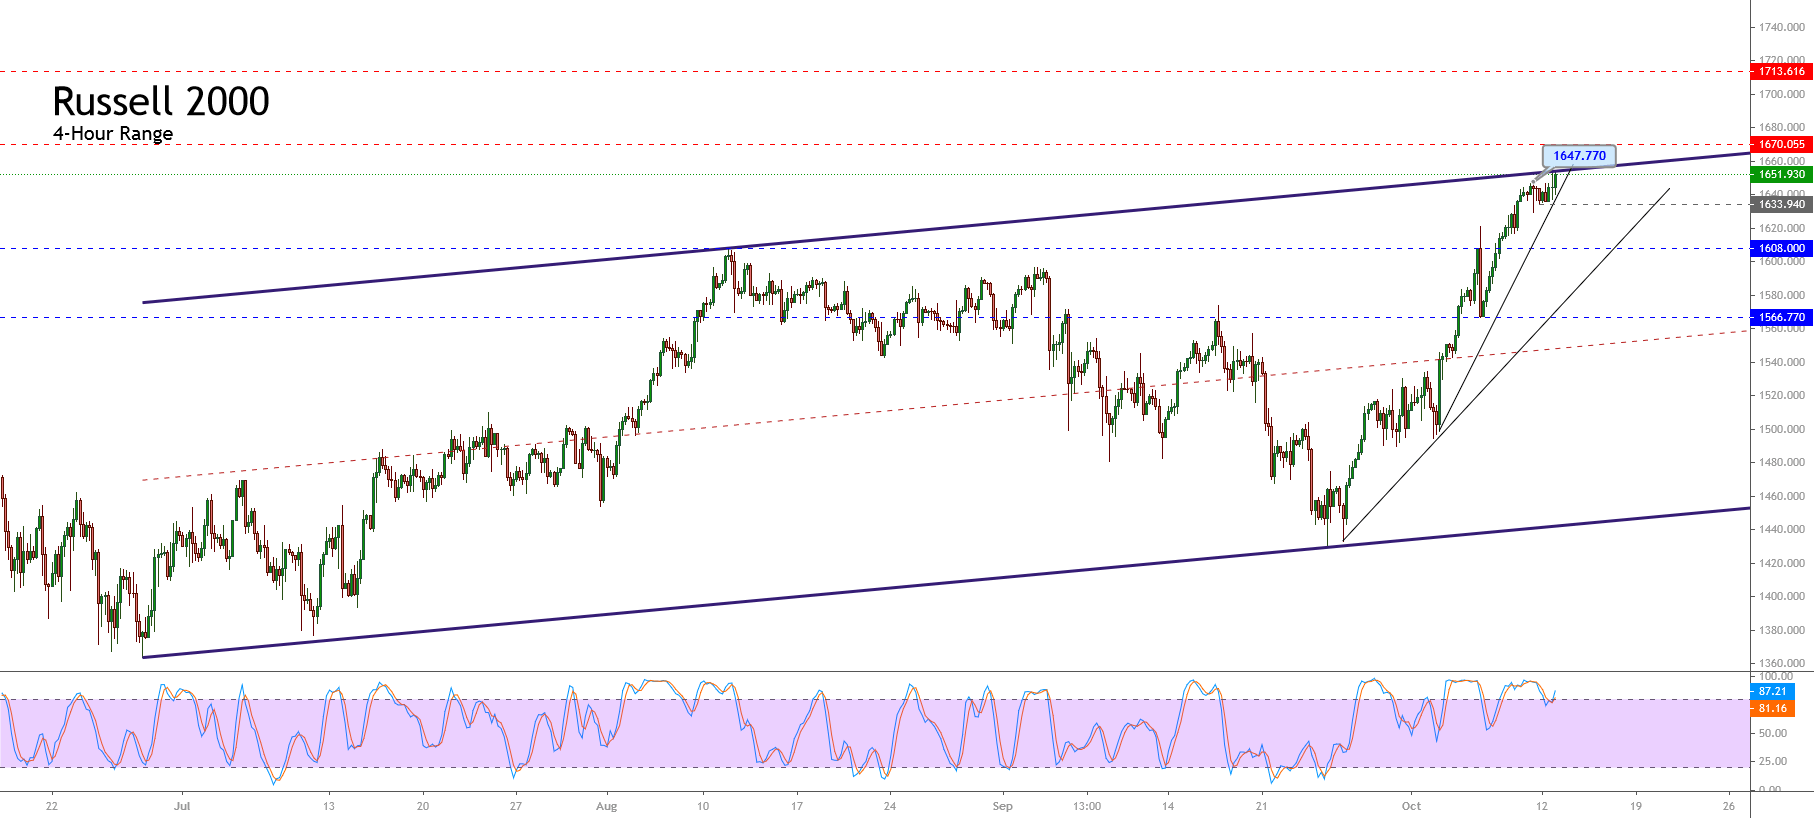
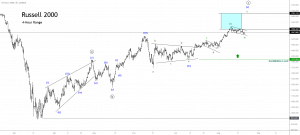
The following 4-hour of the Russell 2000 shows the short-term trading zones at which bullish bias prevails. In this context, the bullish continuity, which would be confirmed after the break of the mid-term ascending channel’s upper line, has as key resistance levels 1,670.05 and 1,713.61 pts. A drop and close below the low of the week 1,633.94 pts could lead the price towards the following areas; 1,608.00 to 1,566.77 pts.
In conclusion, Russell 2000 holds its upward pressure; the market sentiment and price action continue to show further increases. Nevertheless, the extreme bullish sentiment backed by the news media created a market participants’ consensus, which assumes that the stock market will continue rallying with the economic stimulus approval. Thus, our bias remains on the neutral side.

