Overview
The Russell 2000 Index raised over 64% off its lowest level of the year, advancing from the extreme bearish to the extreme bullish sentiment zone. The incomplete complex corrective structure, still in progress, calls for more upsides in the coming trading sessions.

Market Sentiment Overview
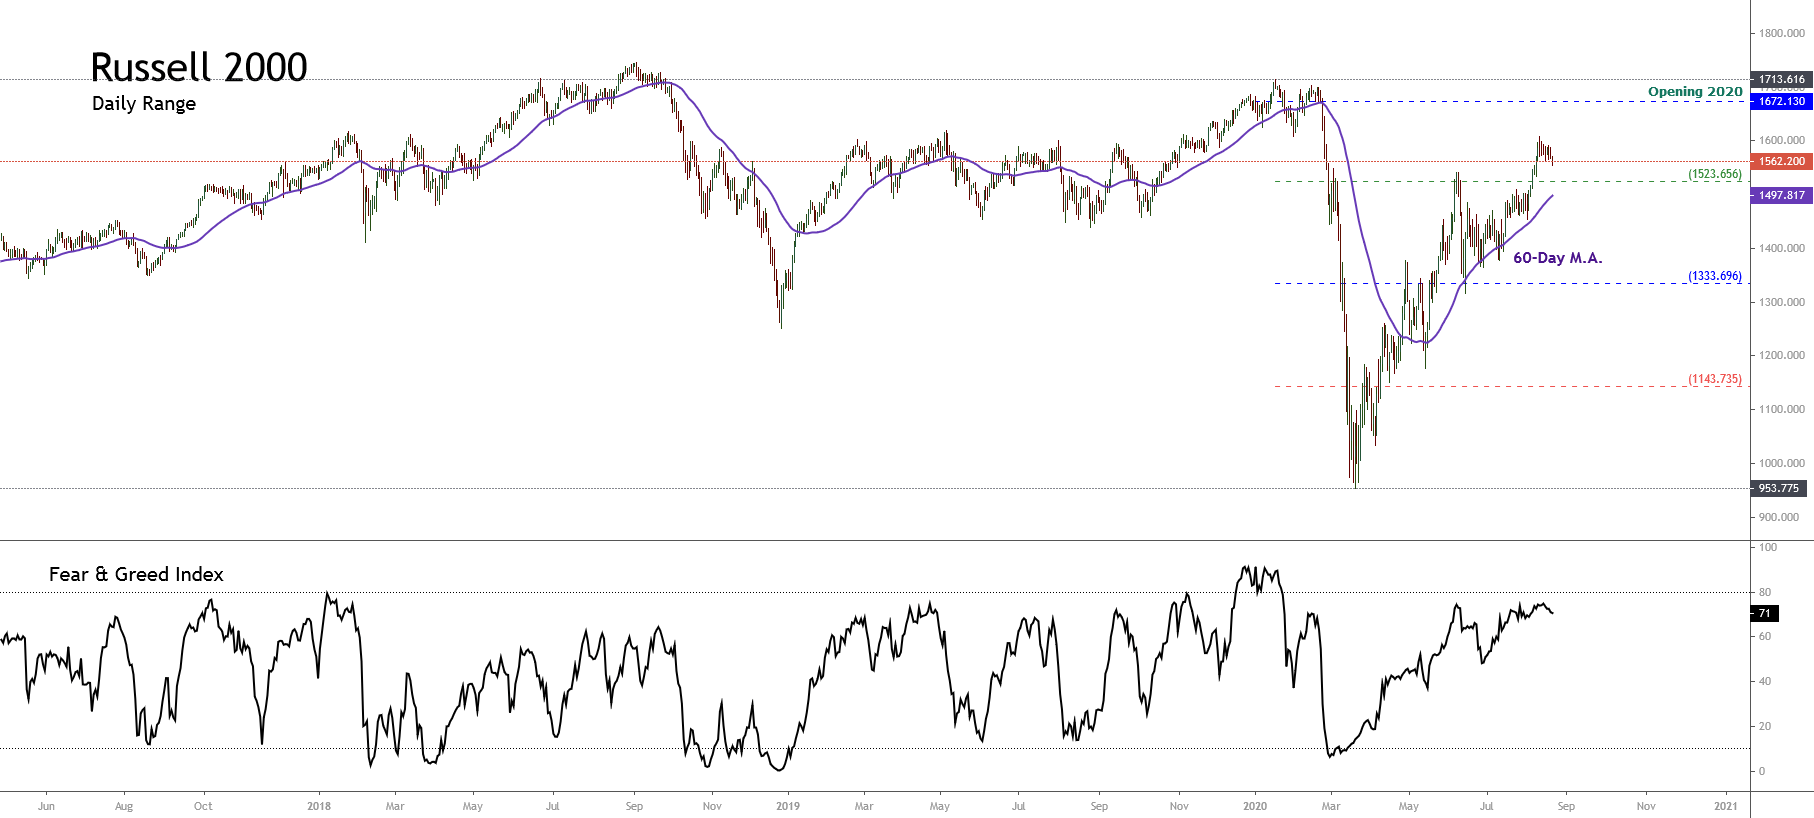
This year, the Russell 2000 index is underperforming by 6.24% (YTD); however, it continues its recovery from the first quarter massive sell-off, when the U.S. index plummeted until its lowest level of the year at 953.77 pts, currently advancing 64.38% off its lows.
The Russell 2000’s daily chart shows it’s moving inside the 52-week high-low range, exposing the development of a consolidation formation in the extreme bullish sentiment zone. Simultaneously, the 71-point reading observed in the fear and greed index reveals a bullish bias, helping support the upward bias that now prevails on the Russell 2000 Index.
On the other hand, Russell 2000’s volatility index shows it’s moving in the extreme bearish sentiment zone, which increases the bullish perspective for the U.S index grouping the 2,000 small-cap U.S. companies.
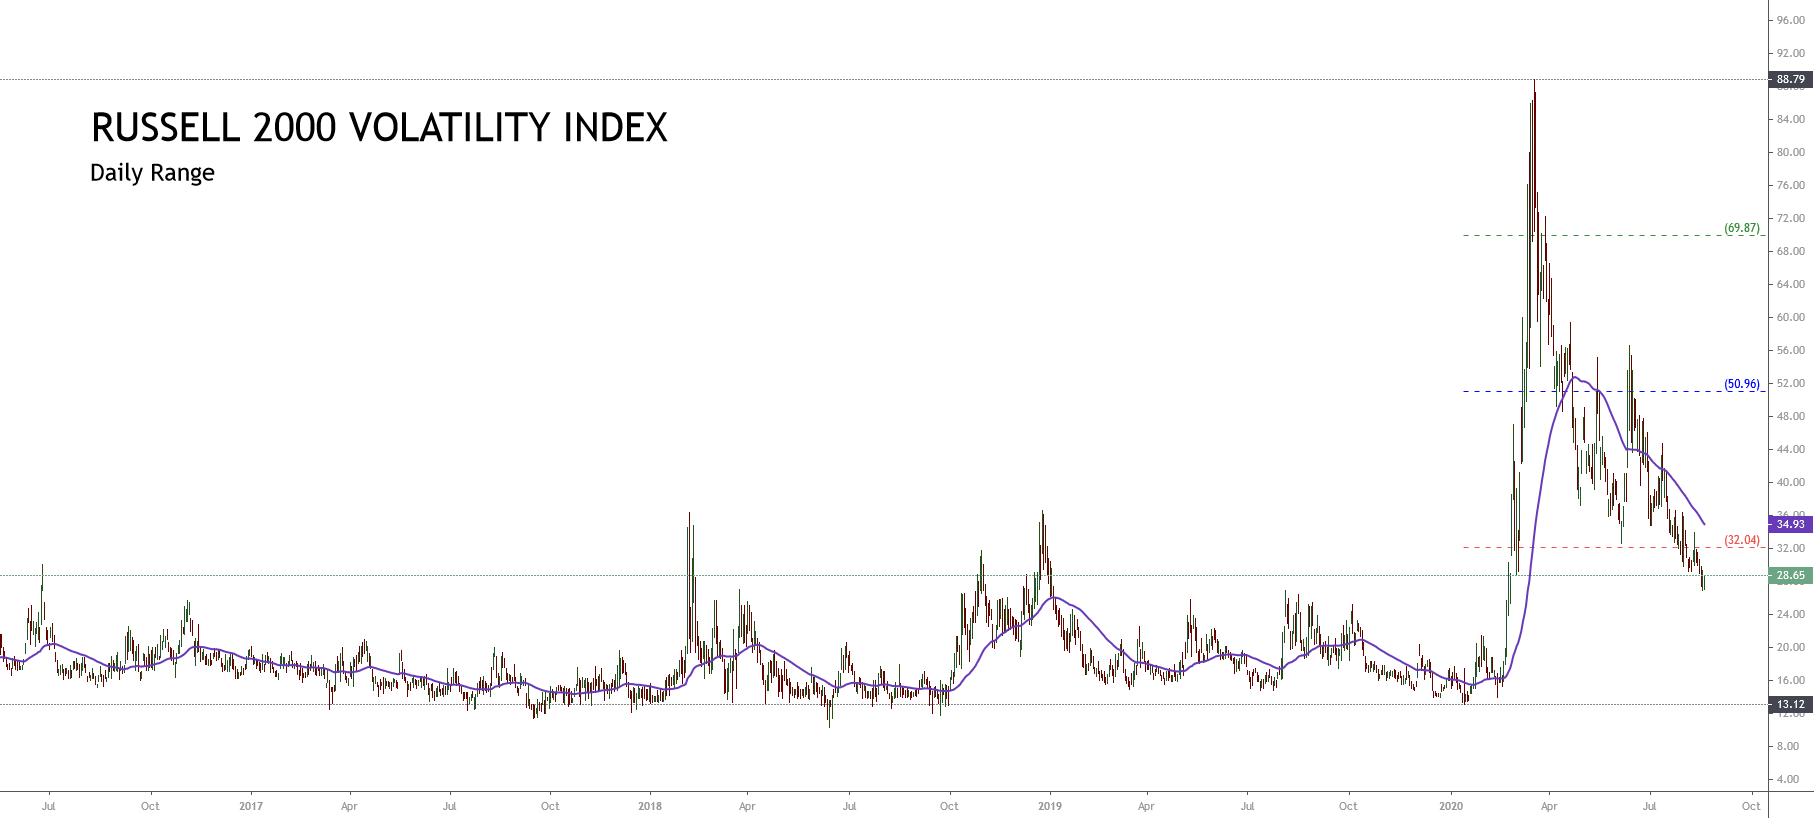
Consequently, both the market structure consolidating in the extreme bullish sentiment zone and the decreasing volatility observed, lead us to expect further upsides for the following trading sessions, which could make it advance till its opening level of the year, at 1,672 pts.
Elliott Wave Outlook
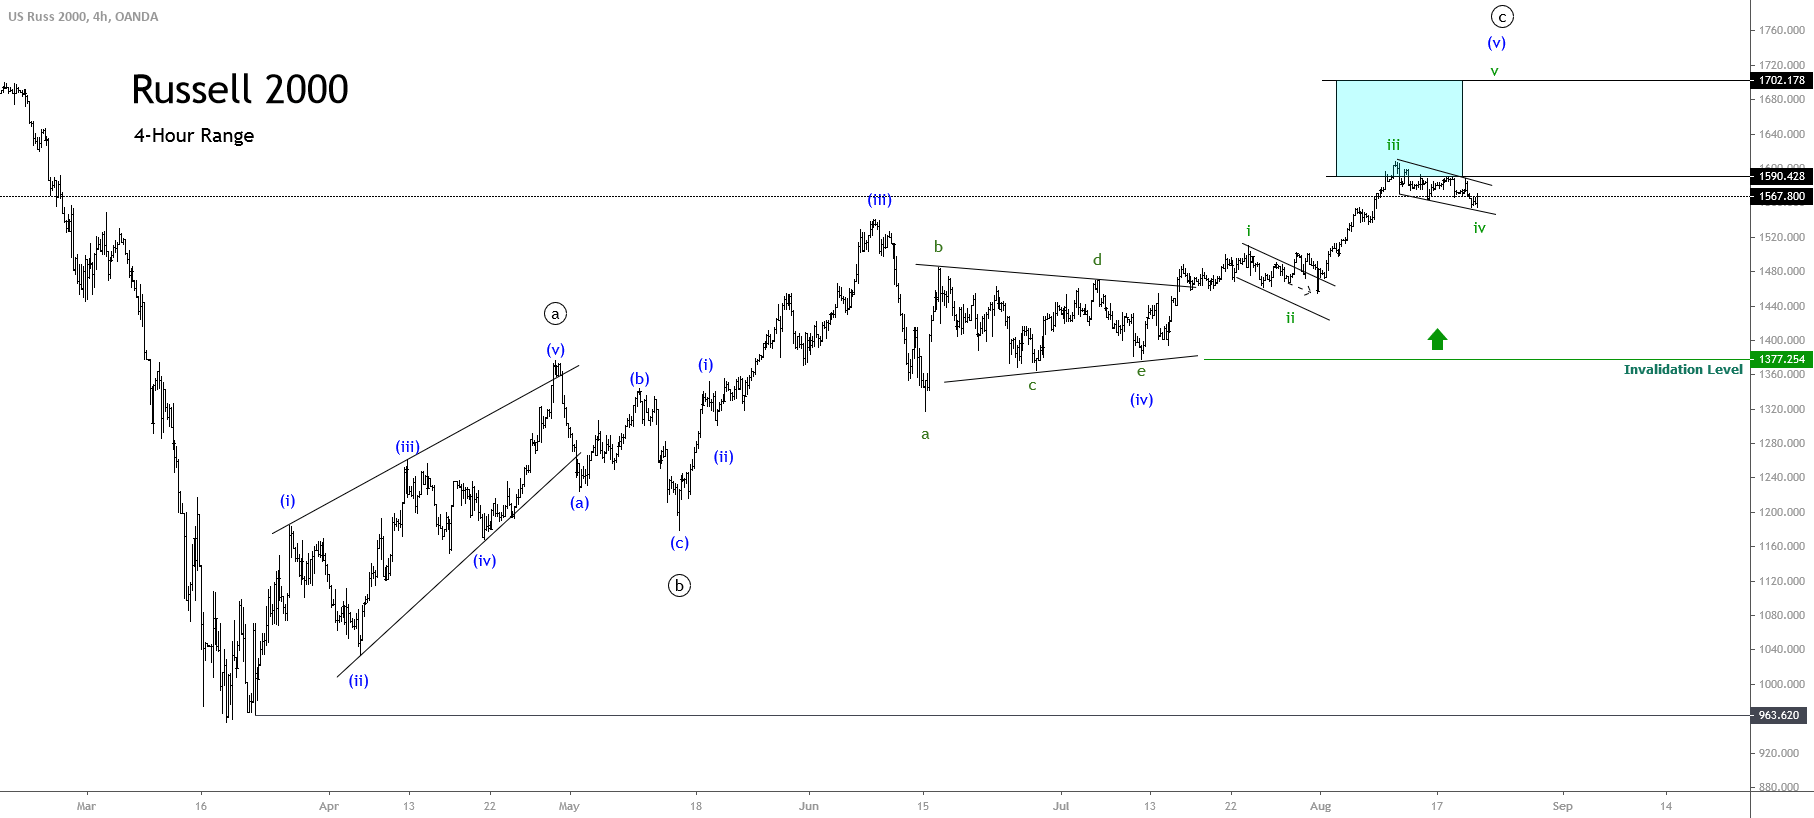
The short-term overview under the Elliott wave perspective is shown in its 4-hour chart, which reveals the structure of a bullish sequence that remains intact since March 23rd when Russell 2000 found fresh buyers at 963.62 pts.
In the previous chart, we distinguish Russell 2000’s upward progression, moving in a complex corrective formation identified as a double three pattern (3-3-3) of Minute degree, marked in black, which belongs to a wave B of Minor degree labeled in green.
The complexity level in the corrective sequence could be understood under the alternation principle context. Observing the first chart and considering the aggressive sell-off, lasting about in one month (since mid-February till mid-March), the alternation principle states that after a high-momentum level movement, a reduced-momentum move comes next, and vice versa.
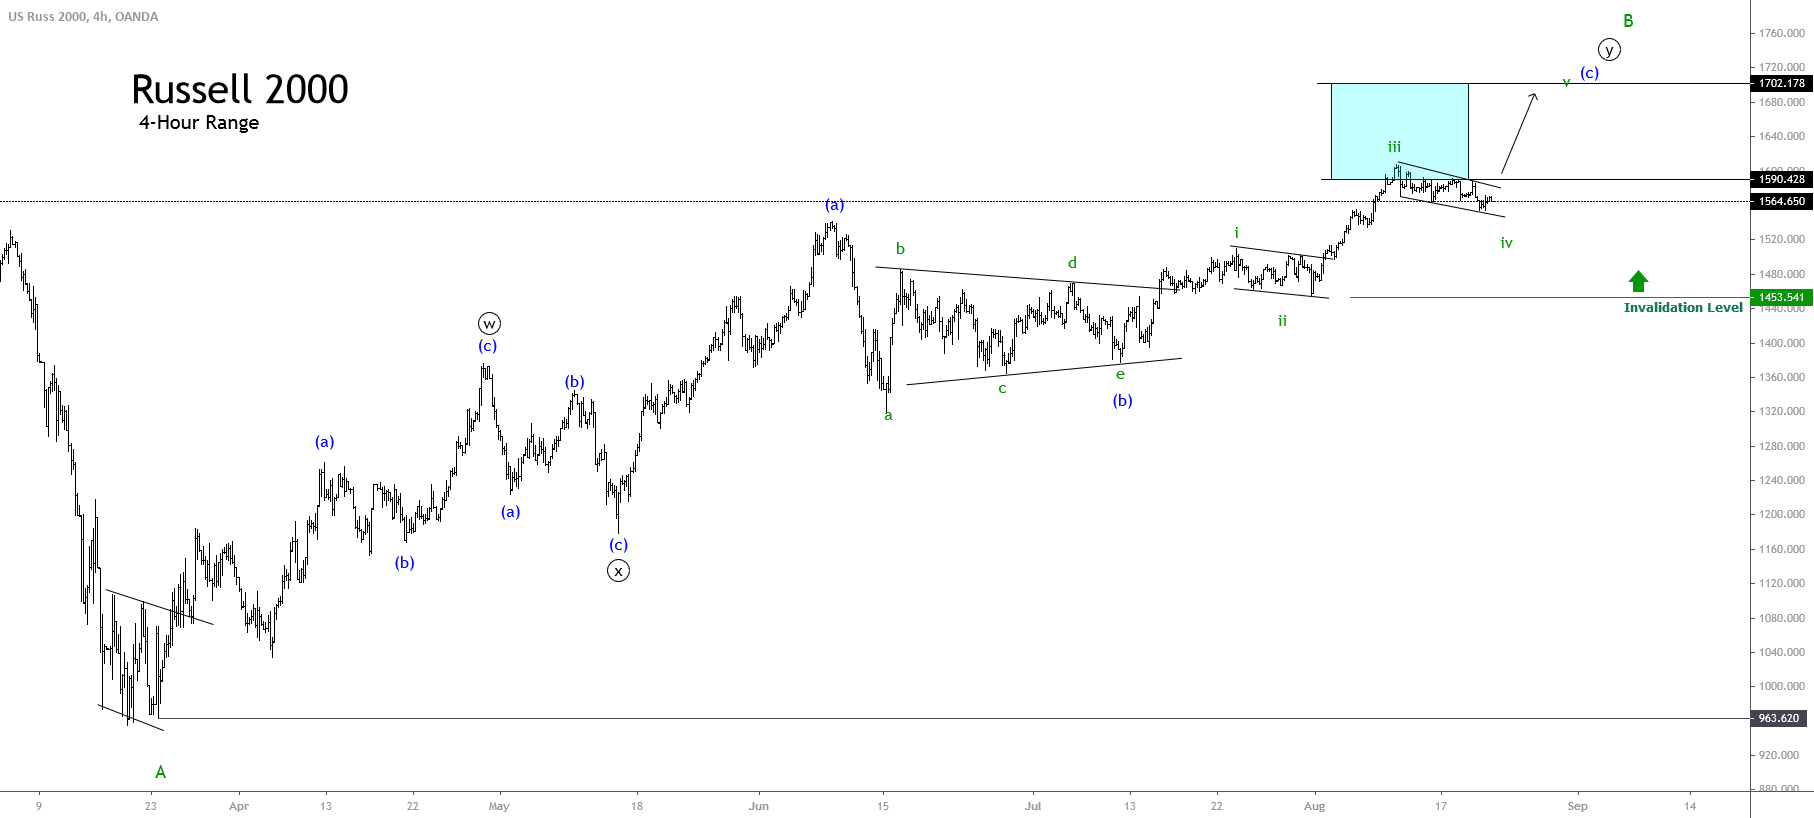
Currently, Russell 2000 advances in wave (c) of Minuette degree, which began on July 10th when the U.S. index ended the wave e of the triangle pattern corresponding to wave (b) in blue. Once wave (b) was completed, the market participants pushed prices higher, carrying it till the 1,608 level on August 11th after the Russell 2000 Index found stiff resistance, which ended wave iii of Subminuette degree identified in green.
Consequently, we expect a limited sideways movement during the following trading sessions before continuing its advance toward fresh highs. Russell’s next upward movement could boost it to the 1,702.17 level, to test last February’s highs.