
The NZDUSD pair has shown signs of recovery in recent weeks. Have we to think in the buy-side for the coming weeks? In this article, we will review the probable next movement from the oceanic pair.

Fundamental Perspective
The Reserve Bank of New Zealand (RBNZ), realized in November its last monetary policy decision, from where the policymakers kept the Official Cash Rate unchanged at 1%.
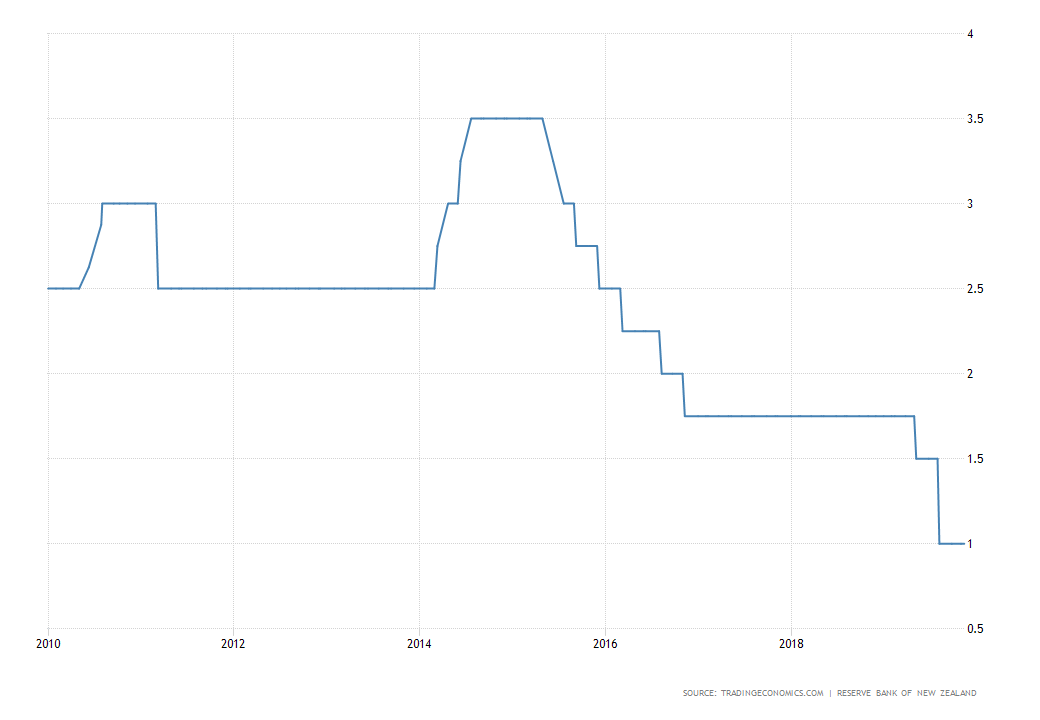
In the decision statement, Governor Adrian Orr stated that employment remains at high levels; however, inflation remains below the 2% target. Moreover, the RBNZ projections for the coming year 2020 pointed to stable interest rates at low levels so that inflation can be ensured to reach the target level.
The next meeting of the reserve will be in February 2020. As a consequence, the fundamental traders will have to closely monitor the evolution of macroeconomic data during the following two months.
Technical Perspective
From the technical point of view, the NZDUSD in its weekly chart moves sideways in a corrective process that found the first support in August 2015 at 0.61968.
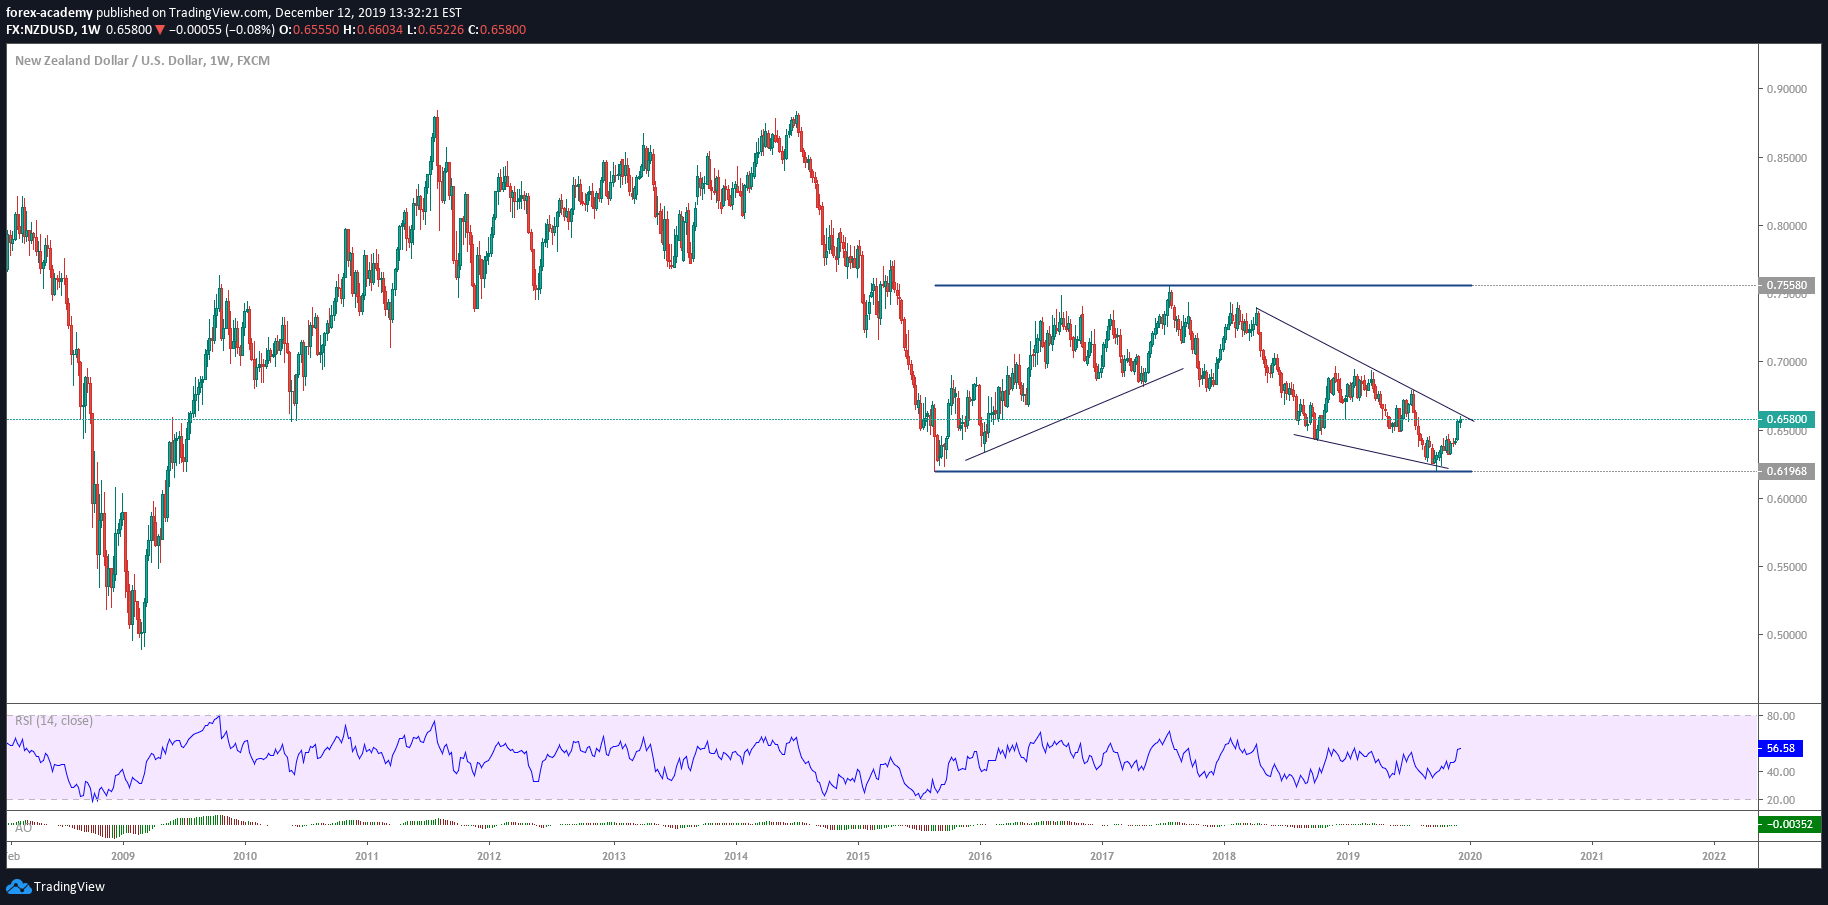 During 2019, NZDUSD approached the lowest level of 2015, developing Elliott’s ending diagonal pattern, which found support at 0.62037 in early October.
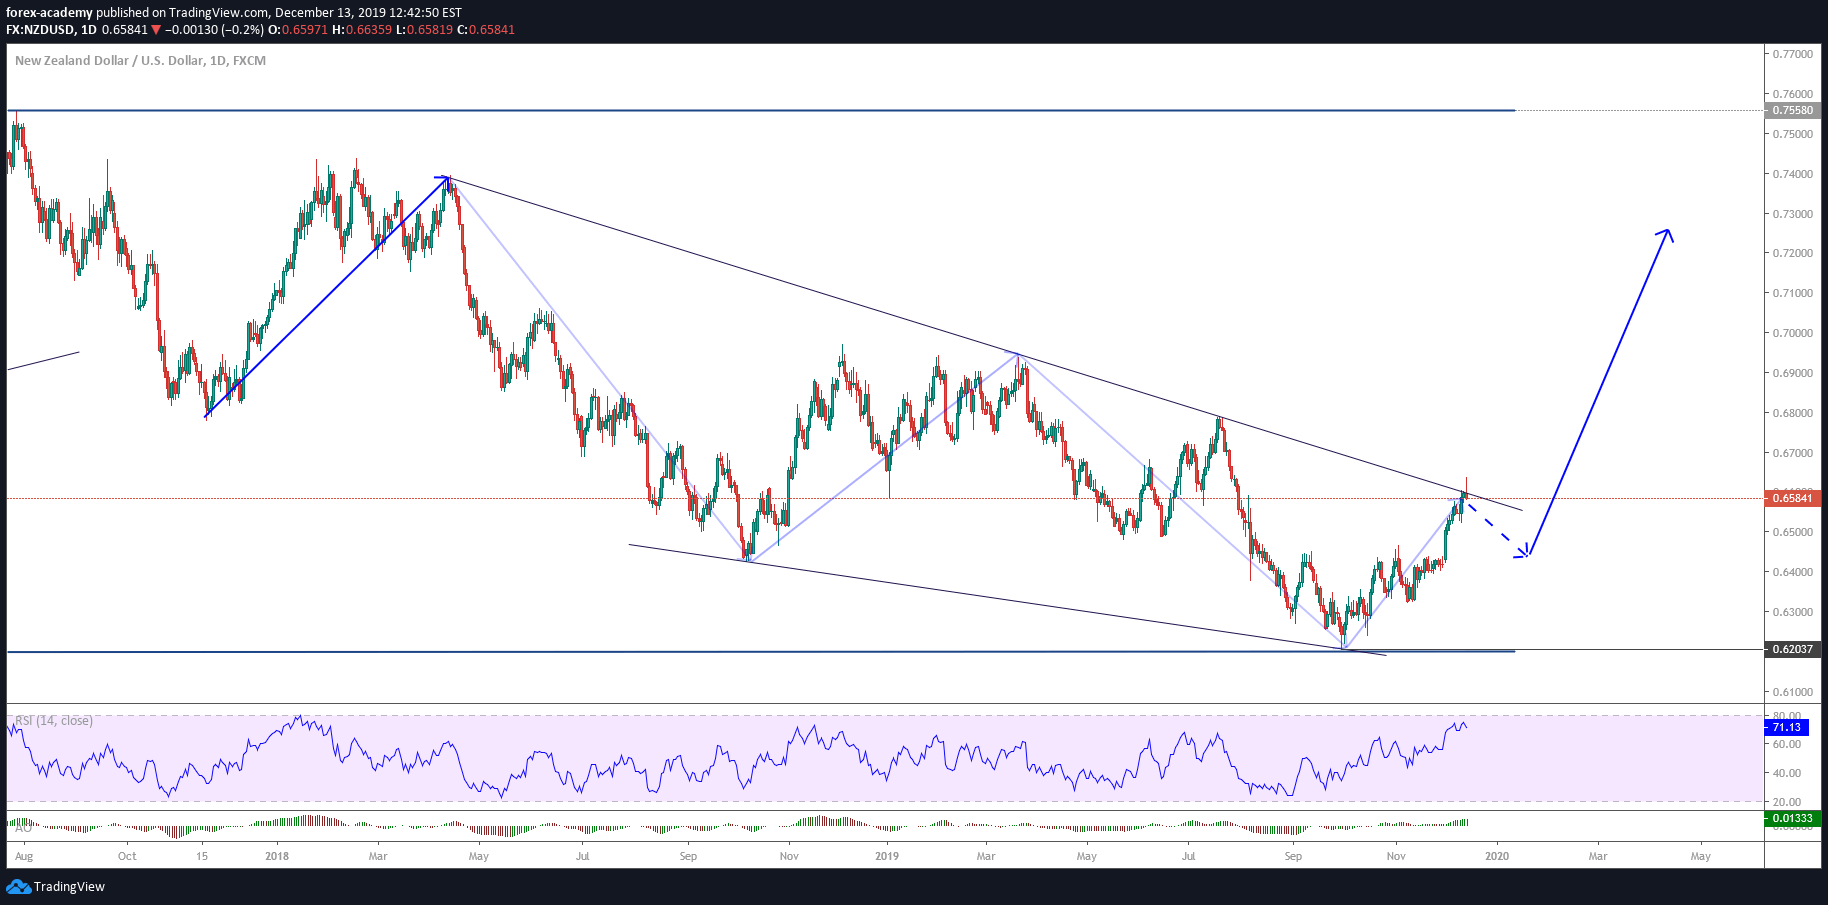
According to the Elliott Wave Principle, a diagonal ending formation is an impulsive pattern that has an internal structure that is divided into 3-3-3-3-3. In turn, this formation can be found in a wave ‘5’ or ‘C’ within a corrective structure.
Once NZDUSD touched the level 0.62037, the pair found buyers and began to realize a bullish movement in three waves. The completion of this upward sequence makes us foresee the possibility of a new decline. Probably the next move will be in three waves.
Our Forecast
The NZDUSD pair in its 4-hour range shows the possibility of a corrective move to the area between 0.64647 and 0.64078. This zone could bring us the opportunity to incorporate us in the potential long-term next rally.
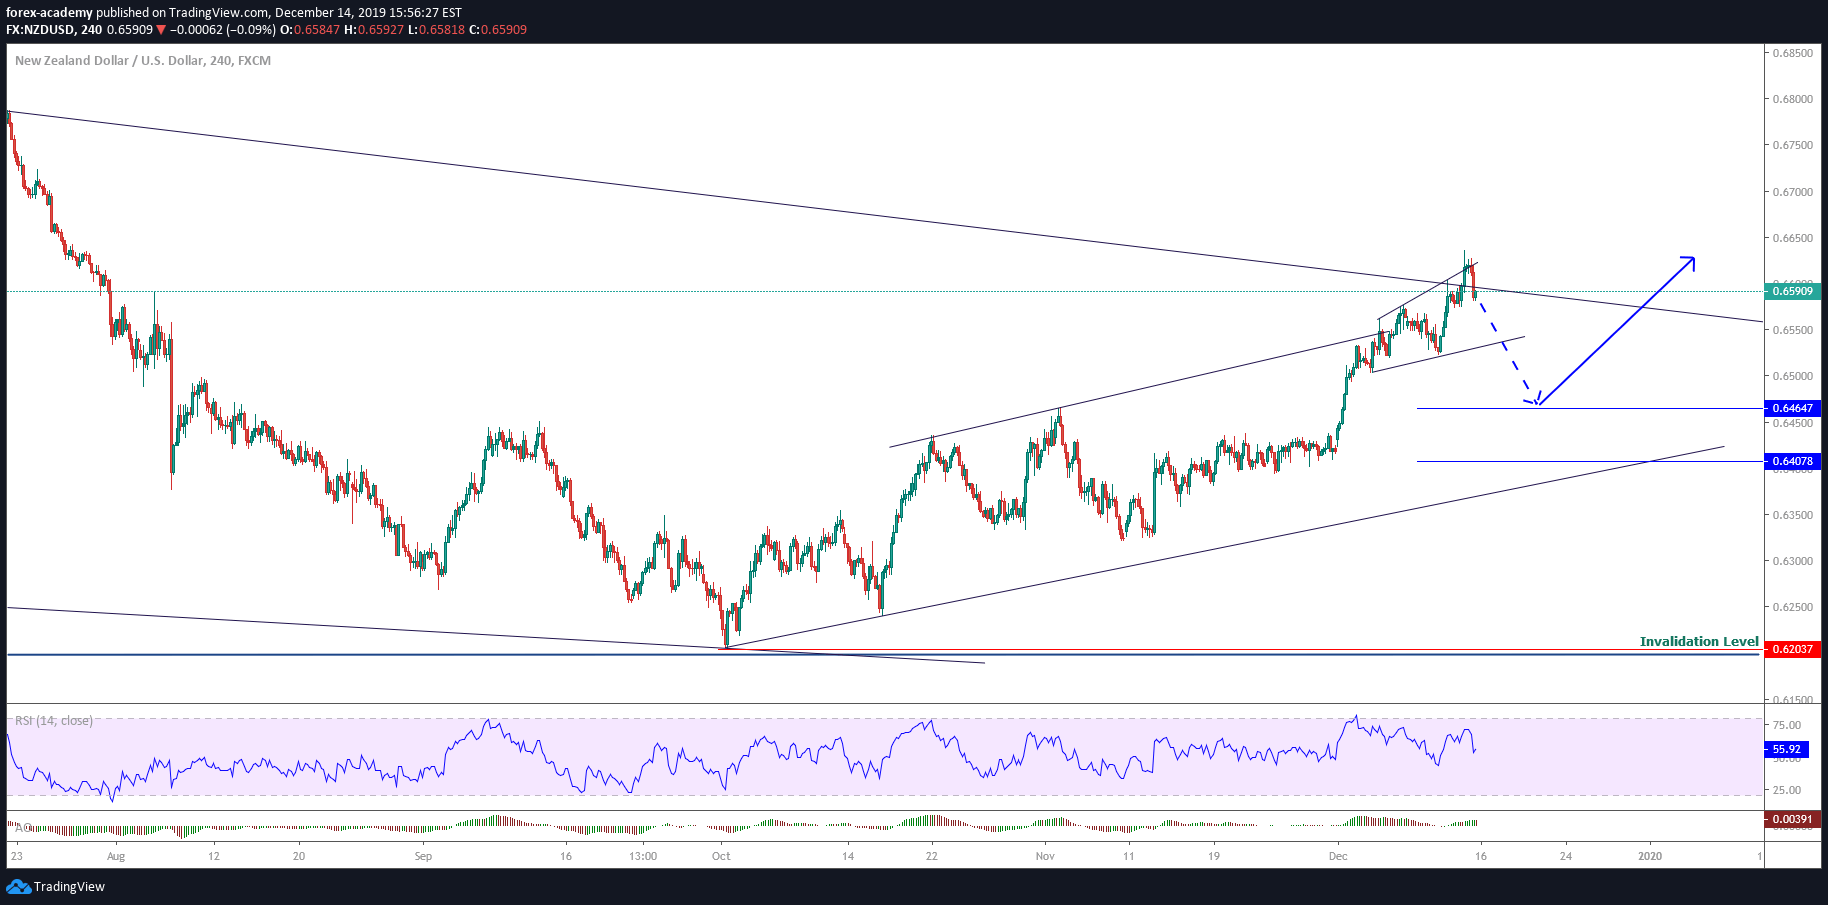
The invalidation level is placed at 0.62028, which corresponds to the lowest level reached by the NZDUSD in October 2019. Our long-term target is at 0.7558 level.
Finally, depending on the retracement level of the NZDUSD, the corrective sequence will reveal to us the strength or weakness for the next path.