Problems with Japanese Candlestick Analysis
One of the big buzz words or methodologies used in trading over the past ten years has been the term and/or style called ‘Price Action Trading.’ It is also known as ‘Naked Trading’ or, much less known as ‘Dynamic Impulse Trading.’ Price Action Trading is a style and methodology that teaches students to utilize candlesticks charts with no lagging indicators or oscillators. Students learn to utilize very little in the form of any tools beyond trend lines, subjective horizontal support/resistance, and pattern recognition. Not surprisingly, many people fail at Price Action Trading. I would venture that out of all the methodologies taught to new traders and analysts, Price Action Trading with Japanese candlesticks causes more new trader accounts to go bust than almost any other trading style or system.

The problem with Price Action Trading using Japanese candlesticks gets exacerbated the faster the time frame used. Japanese candlesticks are, believe it or not, a very advanced form of analysis that requires a significant amount of study to interpret and apply today’s financial markets properly. Traditionally, the application of Japanese candlesticks did not occur on fast time frames. Instead, they were limited to longer time frames such as weekly and monthly charts, and those are timeframes where the analysis, interpretation, and execution of Japanese candlesticks have very few equals. To make Japanese candlesticks work on fast time frames in modern markets requires the use of a myriad of supporting tools such as oscillators and indicators. The use of oscillators and indicators with Japanese candlesticks is necessary is because Japanese candlesticks are three-dimensional: price, time, and volume. Point & Figure only records price.
Point & Figure Analysis

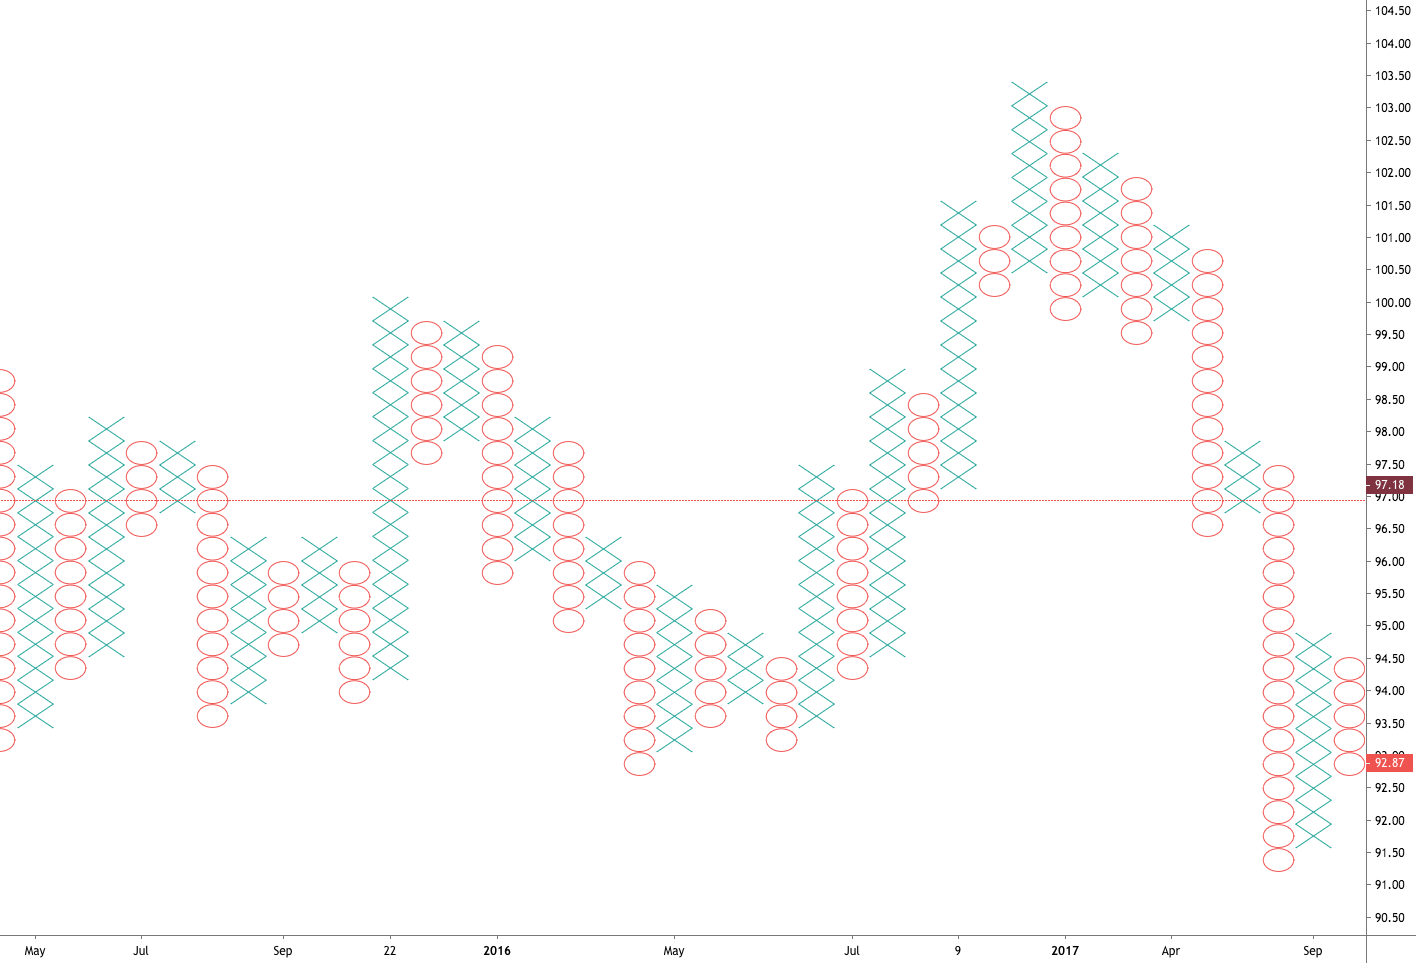
For the Price Action Trader, no chart style is purer than Point & Figure because Point & Figure records only price. In Point & Figure Analysis, time is not measured or used, and volume is anecdotal. That may seem anathema to many traders, but it makes perfect sense from the perspective of a Point & Figure user. Because Point & Figure only records price moves, it makes sense why volume is anecdotal and not significant. If you think about it, the volume itself isn’t relevant unless there is a corresponding price move. Price is the only thing that matters. One of the greatest authorities and written works of Technical Analysis is de Villiers and Taylor’s Point and Figure Charting. They make a compelling case for the weight and authority of this chart and analysis style.
- Point & Figure is logical in its application.
- Simple and easy to master.
- Point & Figure is void of mystery, guessing, and complications caused by subjective analysis.
- News, economic reports, and other sources of market noise are not necessary.
- Losses are limited while profits accrue – easy stop and profit target calculations.
- Point & Figure signals are clear and unambiguous.
- The method avoids and dismisses manipulation.
- Inside information not necessary.
- Volume manipulations are pointless and irrelevant.
- Solo traders outperform professional money, proprietary trading firms, and traditional buy and hold investors with this method.
- Insignificant price moves are ignored.
- Support and resistance easy to identify.
Sources:
Dorsey, T. J. (2013). Point and figure charting: the essential application for forecasting and tracking market prices (4th ed.). Hoboken, NJ: John Wiley & Sons.
Kirkpatrick II, C. D., & Dahlquist, J.R. (2016). Technical Analysis: The Complete Resource for Financial Market Technicians (Third). Old Tappan, NJ: Pearson.
Plessis, J.J. (2012). Definitive Guide to Point and Figure – a comprehensive guide to the theory (2nd ed.). Great Britain: Harriman House Publishing.
DeVilliers, V., & Taylor, O. (2008). Point and figure charting. London: Financial Times/Prentice Hall.