The GBPCHF cross during this year underperforms over 7.3% YTD easing over 940 pips. Although the market action made it decline until lower levels since 2011, the cross could experience a recovery that could propel it toward fresh highs.
The Market Sentiment
The GBPCHF cross in its weekly chart illustrates the price moving below 50% of the 52-week high and low range, which reveals that market participants maintain its bearish bias for the cross. At the same time, we distinguish the 26-week moving average acting as dynamic resistance at 1.19298.
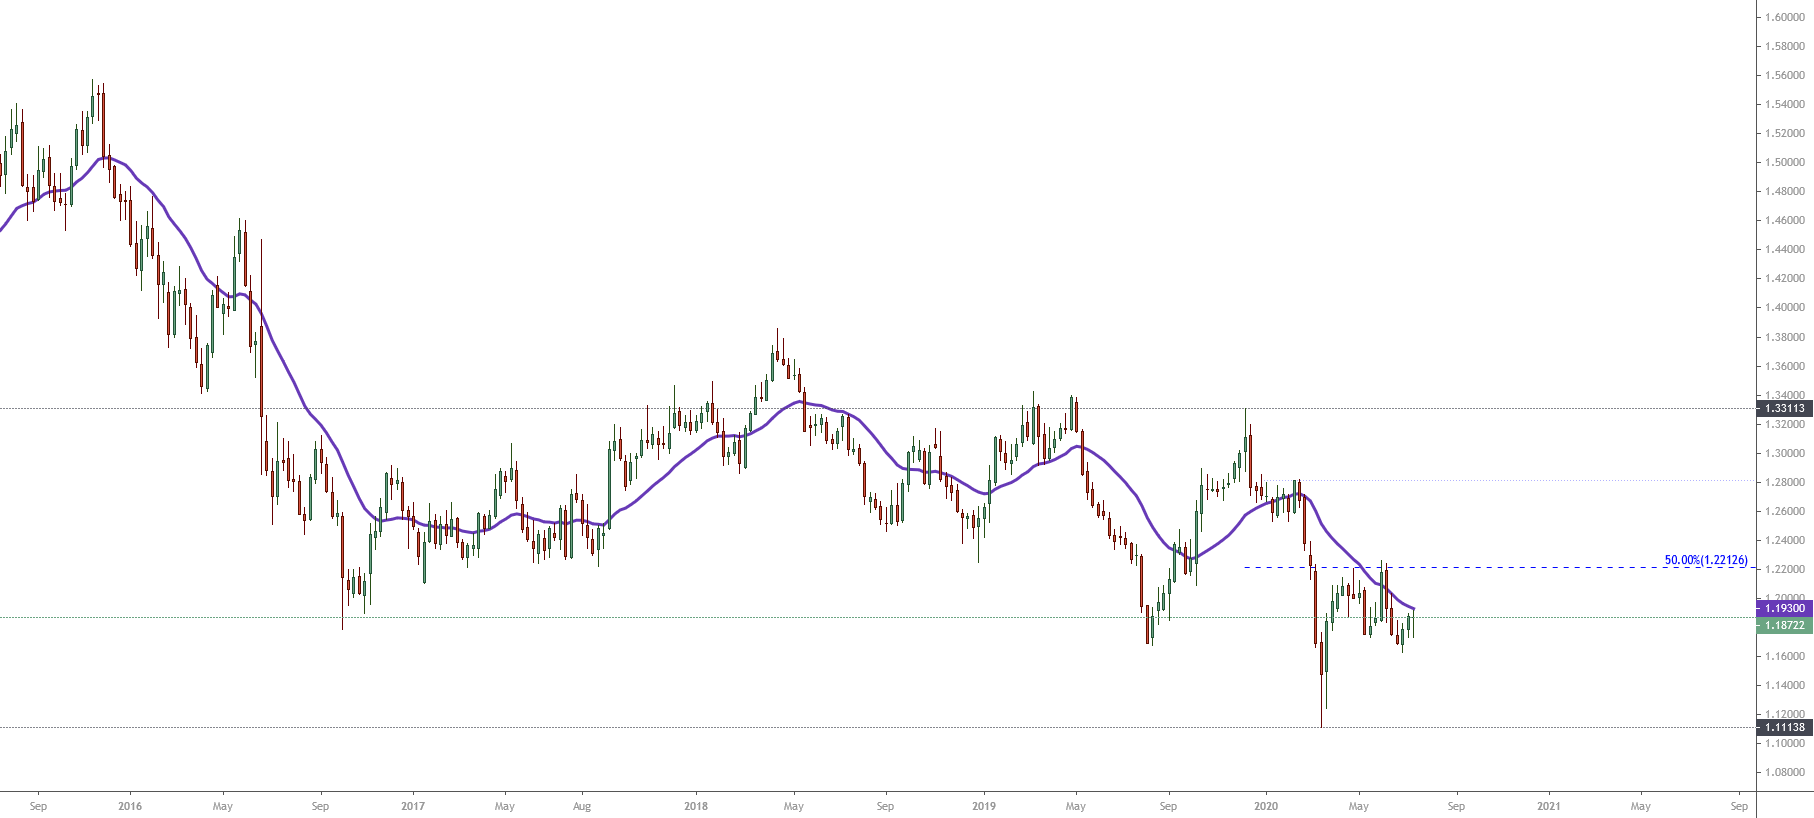
On the previous chart, we distinguish a bearish sequence that began in mid-November 2016 when the price topped at 1.5572 and looked ended on last March 19th, when the cross found support at 1.1113. Once the GBPCHF dropped until the lowest level since August 2011, the price bounced, finding a short-term resistance in the zone of 1.2212, which coincides with 50% of the 52-week high and low range.
During the previous two weeks until now, the market action moved it down, finding resistance at the 26-week moving average, which leads us to conclude that bear traders still maintains the market control.
Consequently, while the GBPCHF keeps moving below the 26-week moving average, the market sentiment bias continues being bearish.
The Elliott Wave Outlook
The GBPCHF cross under the long-term Elliott wave perspective exposes a broadening diagonal formation that began on April 17th, 2018, when the price found fresh sellers at 1.3855.
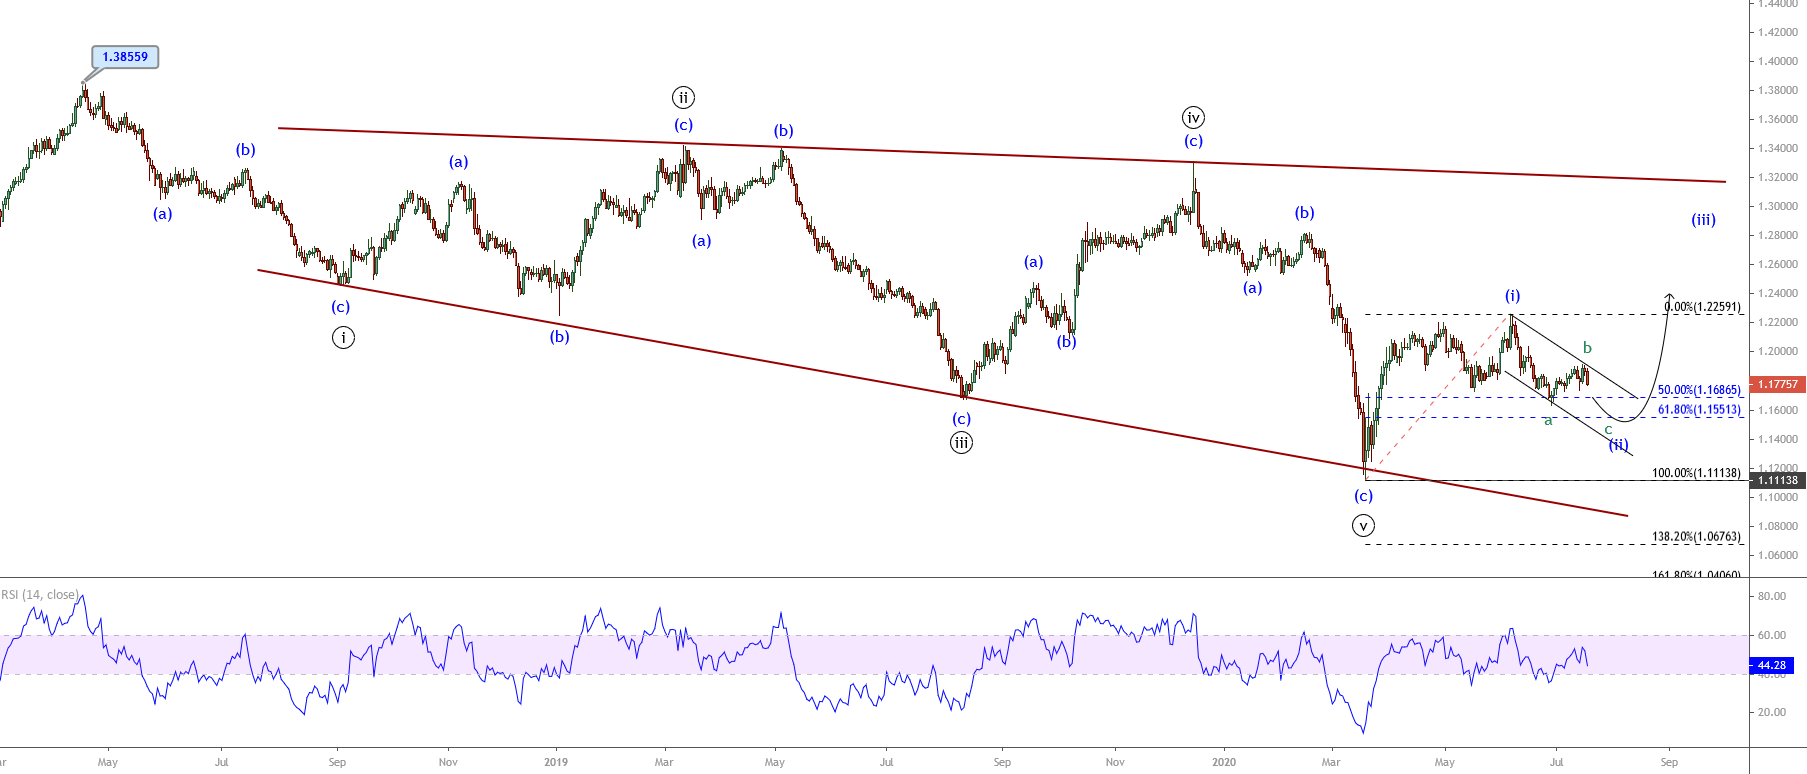
In the previous figure, we distinguish an expanding sequence that follows a 3-3-3-3-3 internal subdivision of Minuette degree identified in blue. This structural series could have its fifth wave of Minute degree (labeled in black) concluded on March 19th, when the price found support at 1.1113.
After the market participants took down the price to the lowest level of the year, the pair reacted mostly upward, developing a bounce in a five-wave sequence. This bullish movement may correspond to a wave (i) of the Minuette degree, which ended last June 05th, from where the GBPCHF cross started to develop an incomplete corrective corresponding to wave (ii) in blue, which remains in progress.
On the other hand, the RSI oscillator, which moves below the level-60, confirms the short-term bearish bias that GBPCHF maintains.
However, considering that the price action advances in an incomplete bearish wave (ii), our preferred near-term positioning remains neutral until the current bearish structure completion expects the potential rally corresponding to wave (iii), which could raise until 1.28 area.