The US Dollar Index (DXY) jumps on Thursday trading session after the FED’s policymakers decided to keep unchanged the rate at 0.25%

Market Sentiment Overview
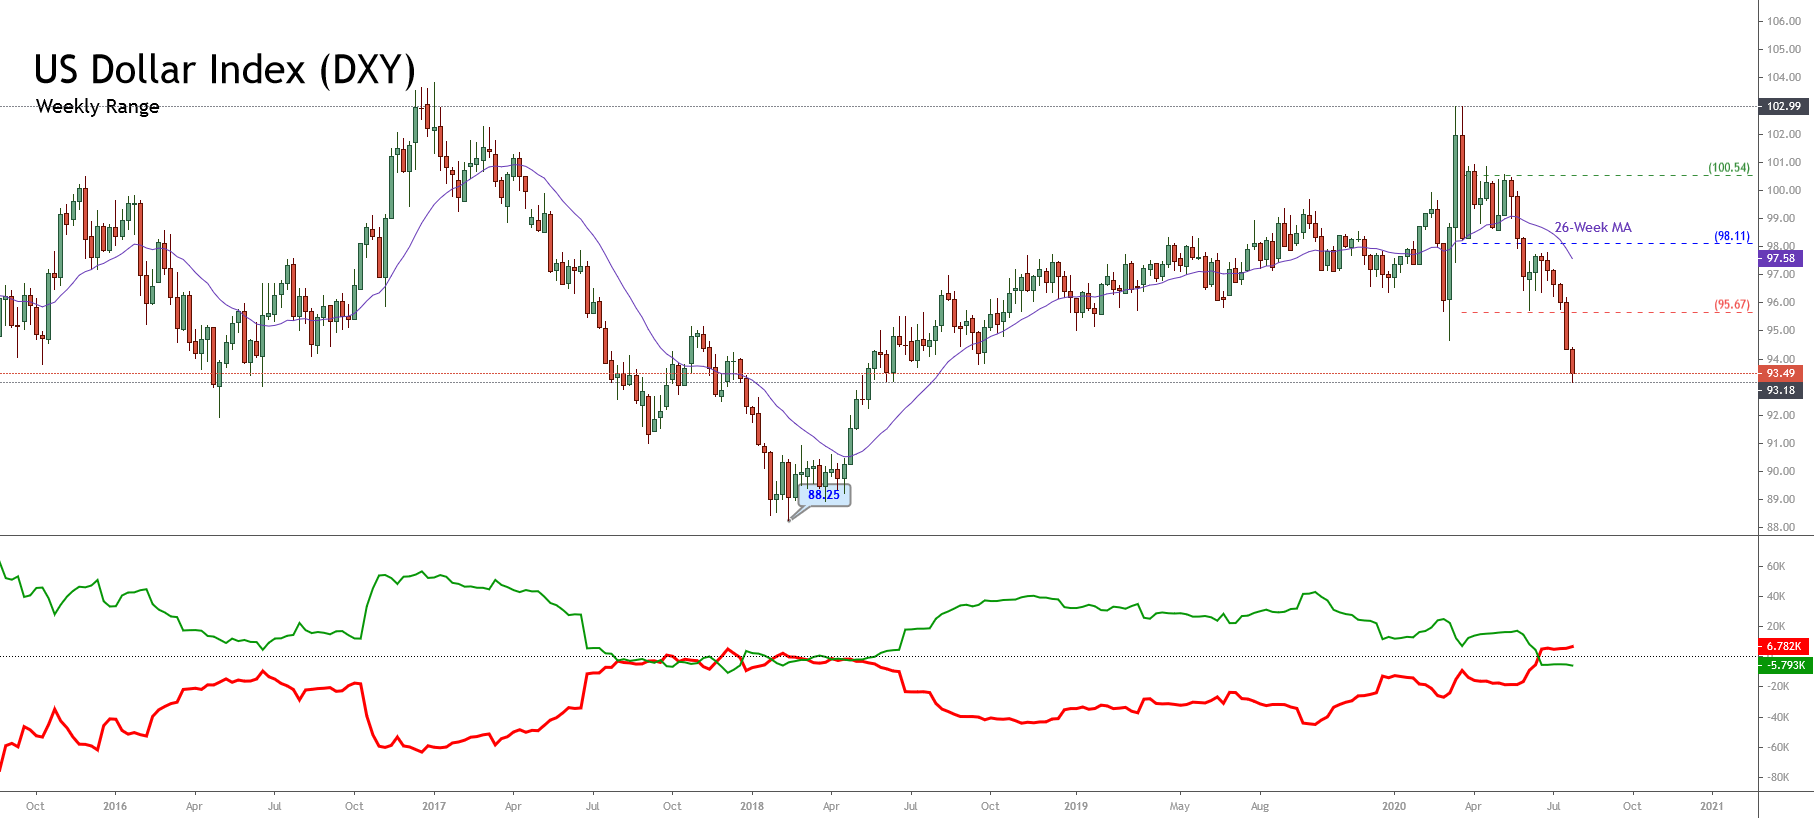
In its weekly chart, the US Dollar Index exposes a downward movement with an accelerated bearish momentum that brought it to decline for the sixth week in a row, falling to its lowest level since mid-June 2018 when the DXY found support at 93.19.
The price action observed in the 52-week high and low range places DXY in the strong bearish zone. This market context leads us to expect more declines in the long-term. Simultaneously, in the short-term, we could see a limited recovery, which could find resistance at the 95.67 zone.
From an institutional activity perspective, the net positioning informed by the COT report released by the CFTC last Friday, reveals that speculative traders (green line) continue favoring a bearish-side positioning.
In consequence, the long-term market sentiment for the US Dollar index remains bearish. At the same time, a short-term recovery could signify only a retracement of the primary bearish trend.
Elliott Wave Outlook
The short-term Elliott wave perspective for DXY illustrated in its 4-hour chart reveals the advance in a bearish trend that began on the last March 19th high at 102.99. Once the Greenback found fresh sellers, the bearish market participants took the price down in an incomplete descending sequence.
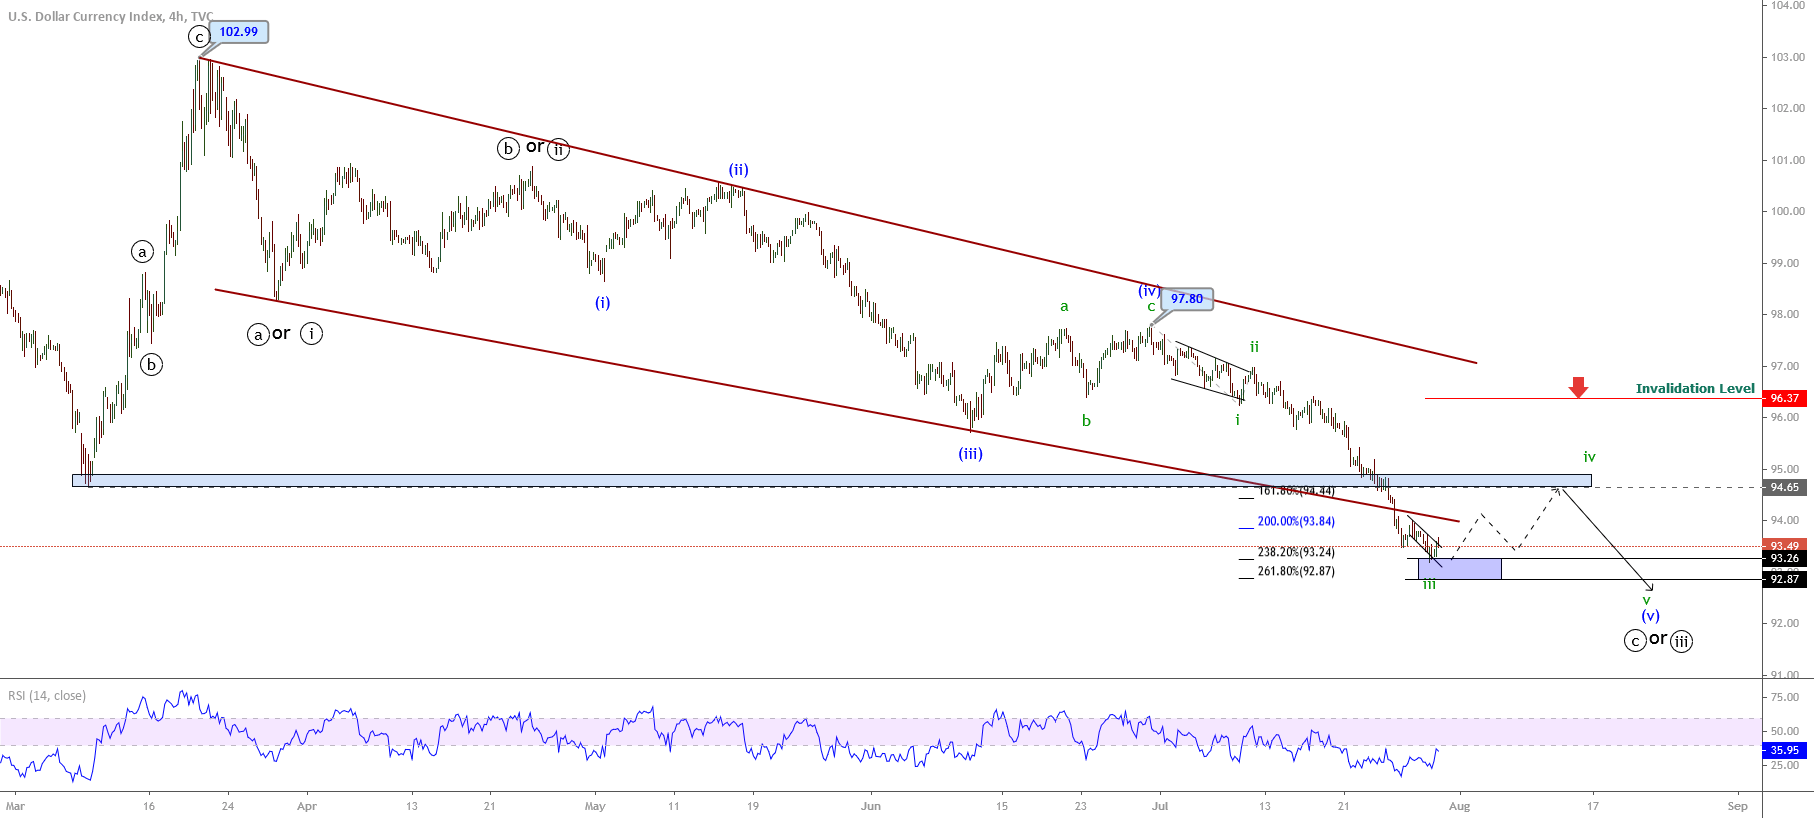
In the figure, we observe the US Dollar index moving in an incomplete wave ((c)) or ((iii)) of Minute degree labeled in black. At the same time, the price advances in its wave iii of Subminuette degree identified in green, this move belongs to the fifth wave of Minuette degree labeled in blue, which began on June 30th when the price made a lower high at 97.80.
Although the third wave in green touched the bearish target area located in the blue box and started to bounce, there is no evidence to support the end of the bearish cycle. Neither does the bullish divergence observed on the RSI oscillator bring us a signal of exhaustion or reversal trend. On the other hand, considering the alternation principle and that the current bearish movement has strong downward momentum, the fourth wave in green should likely evolve as a sideways sequence, possibly as a triangle pattern. This technical formation could find resistance at 94.65, corresponding to the last March 09th low. Even, the move could extend until the 95.72 level, where the price might reverse towards the primary bearish trend.
In summary, the US Dollar index currently runs in a bearish five-wave sequence, which seems incomplete. There exist a possibility that the Greenback starts to develop its fourth wave of Subminuette degree identified in green, which could find resistance in the area between 94.65 and 95.72. The current bearish scenario will be valid as long as the price stays moving below 96.37.