Overview
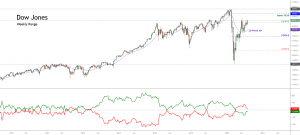
The Dow Jones Industrial Average continues its advances toward the green side. During this year, it is still easing 1.08% (YTD). The DJIA index, which groups to the 30 largest capitalized U.S. companies, move in the extreme bullish sentiment zone unveiling the probability of new record highs in the U.S. stock market. Likely, it could find resistance at the 30,000 pts as a psychological barrier confirming the all-time highs observed both S&P 500 and NASDAQ 100.

Market Sentiment Overview
During this year, the Dow Jones Industrial Average eases 1.08% (YTD), returning from the bear market to bull market side. The recovery experienced by the Industrial Average, carried it to jump from the lowest level of the year at 18,213.5 pts to 28,287 pts gaining over 55%.
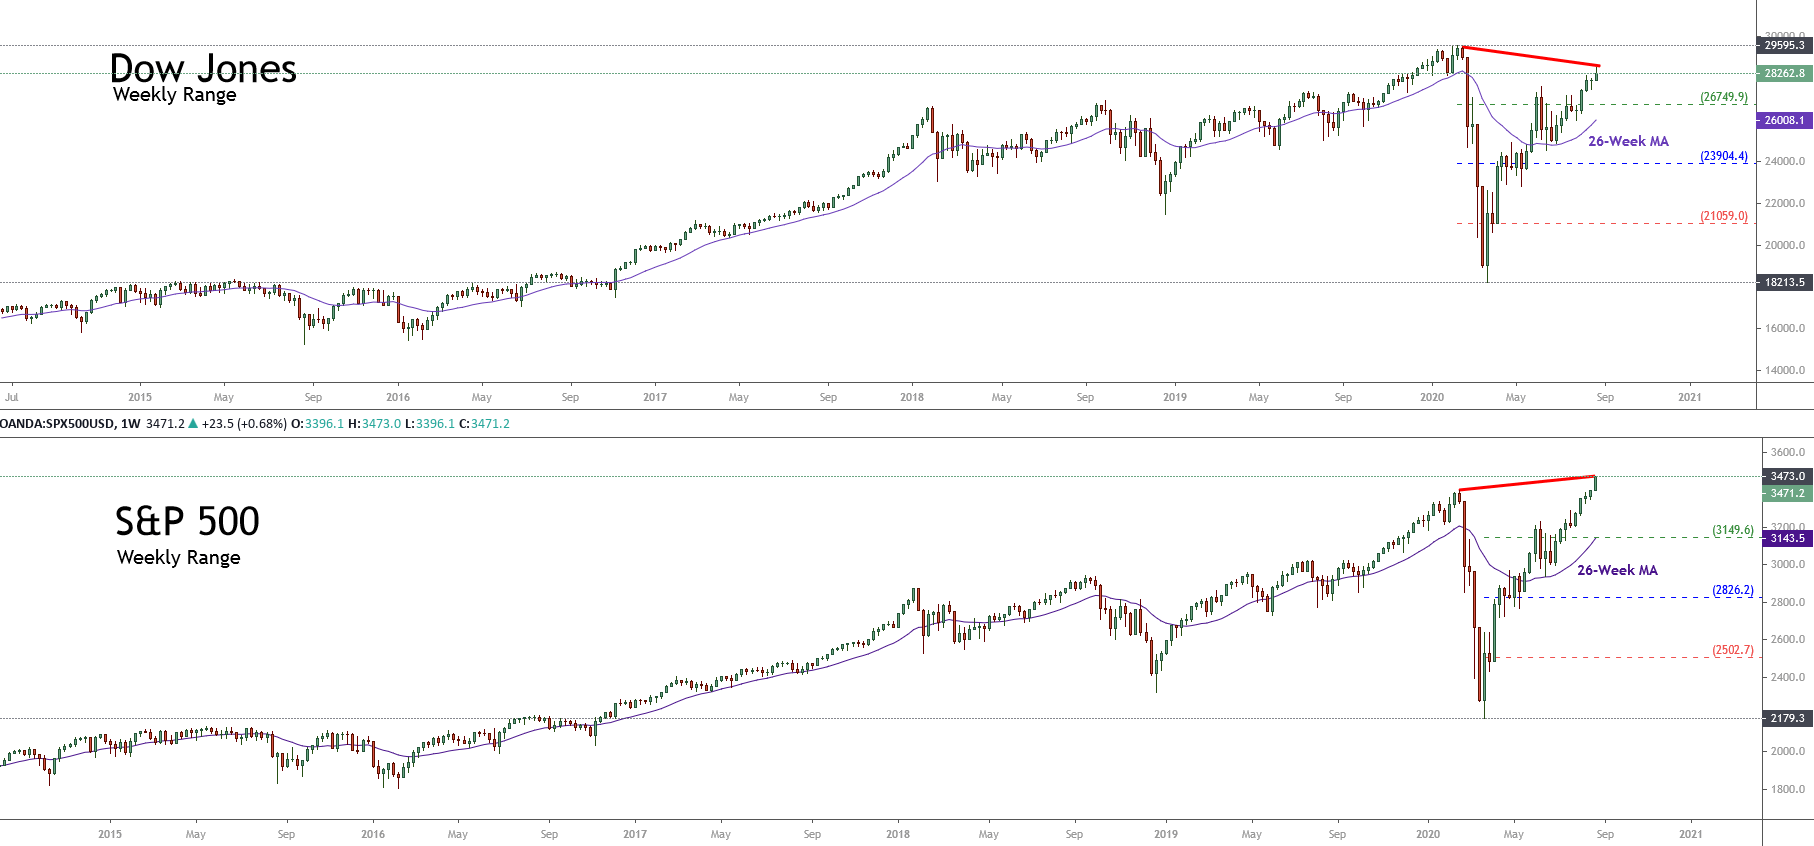
The following figure compares the advance of Dow Jones and the S&P 500 in its weekly timeframe. In these two charts, we observe that both indexes move in the extreme bullish sentiment zone. However, although surprising, the recovery observed in the U.S. stock market, the Industrial Average still doesn’t confirm the all-time high of the S&P 500, reached on the latest trading sessions.
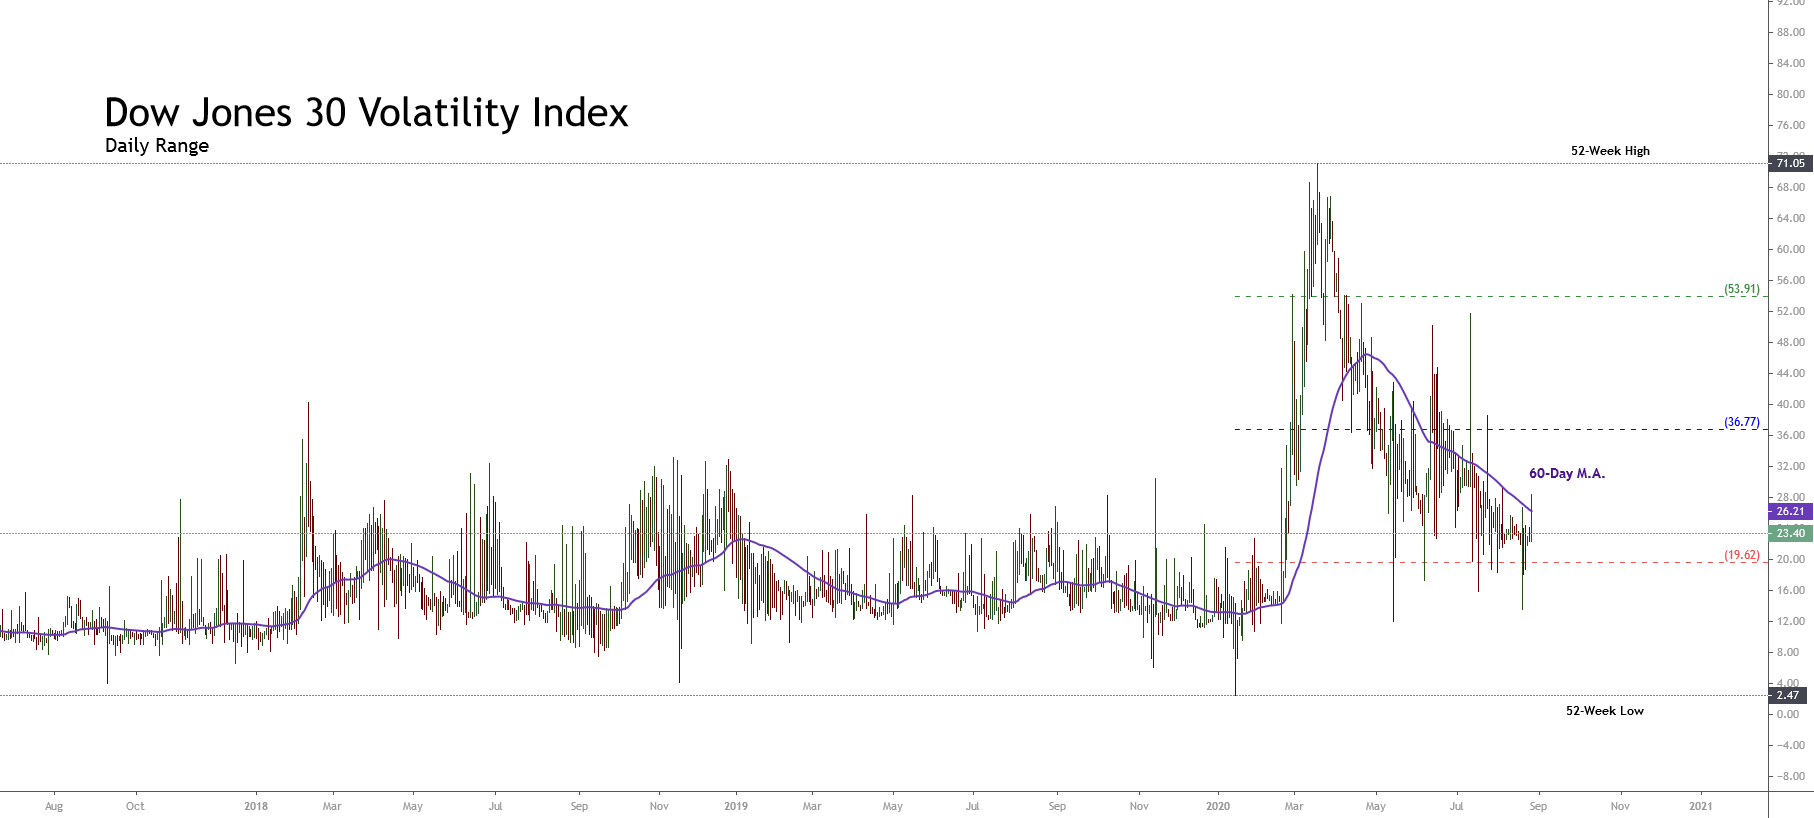
If we look at the Dow Jones’ volatility (VXD), it is running below the 60-day moving average, which confirms that the market sentiment continues being in favor of fresh upsides on the Industrial Average.
Finally, considering that both NASDAQ 100 and S&P 500 reached fresh all-time highs in the latest sessions, the Dow Jones should follow the same path in the coming trading sessions.
Elliott Wave Outlook
The mid-term outlook for the Industrial Average provided by the Elliott Wave Analysis reveals the bullish continuation of the incomplete wave B of Minor degree labeled in green, which could push it toward new all-time highs.
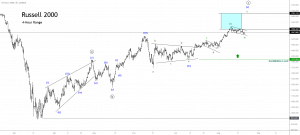
The next 4-hour chart illustrates the price running in an uptrend that began on March 23rd when the U.S. Blue Chip index found fresh buyers at 18,213.5 pts, developing a corrective structural sequence that remains incomplete.
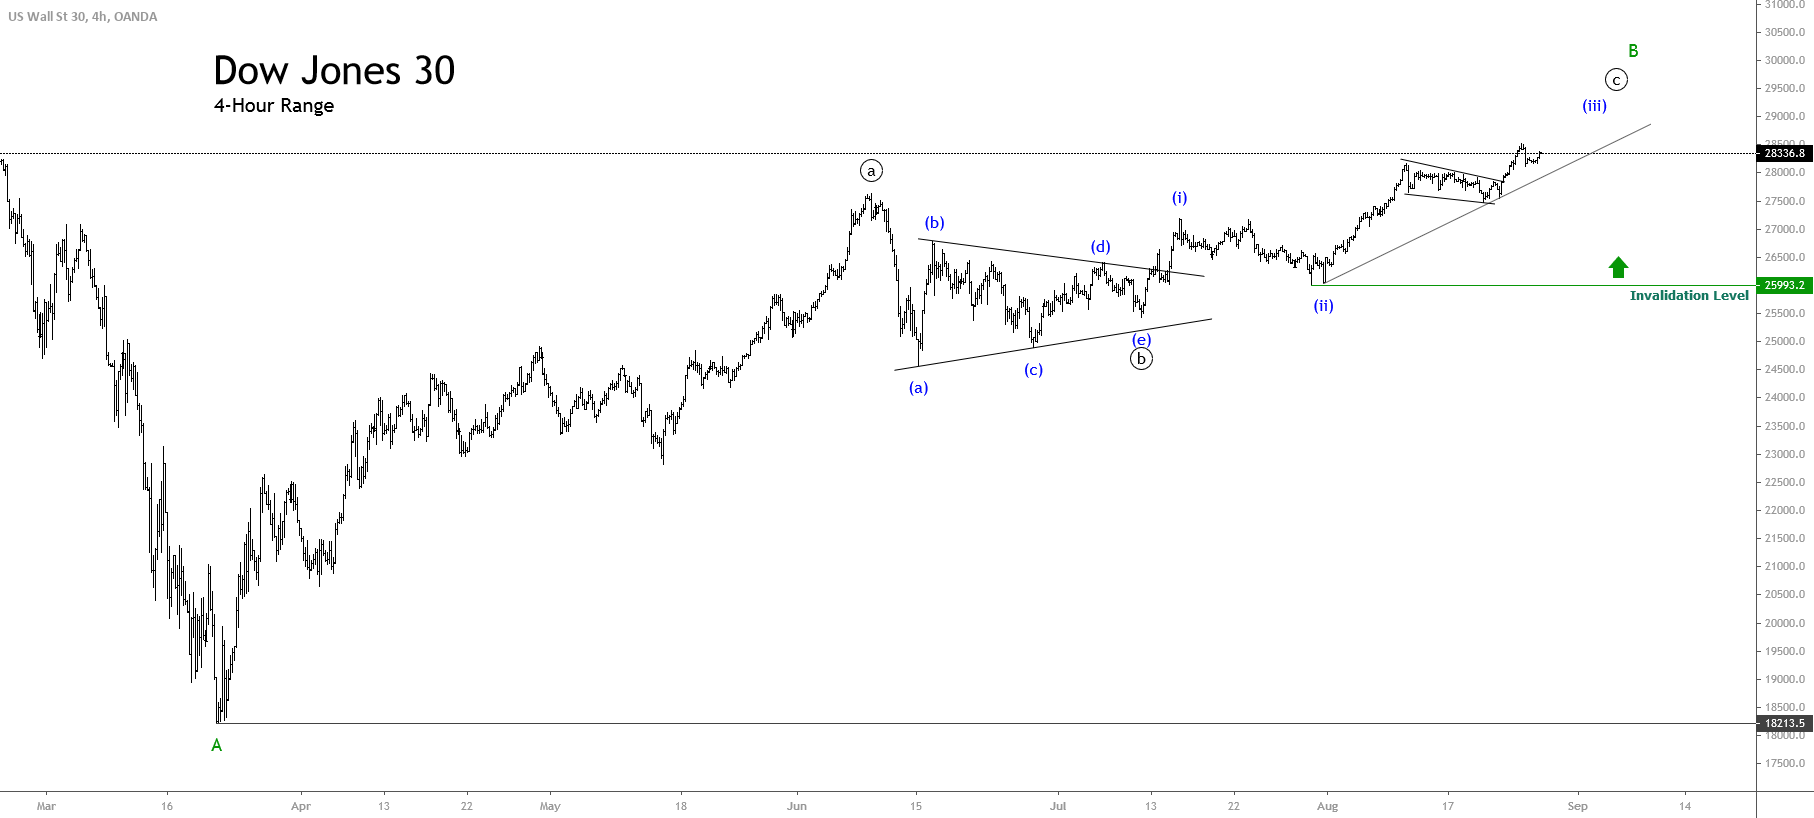
Once the Industrial Average broke upward the (b)-(d) upper-line of the triangle drawn by the wave ((b)) of Minor degree, the price activated its progression as wave ((c)), which is characterized by the inclusion of five internal waves.
Currently, Dow Jones continues its development in an incomplete wave (iii) of the Minuette degree labeled in blue. Simultaneously, the bullish trendline looks intact, which leads us to conclude that the uptrend remains sound, calling for more upsides in the following trading sessions.
Finally, considering that both the S&P 500 and NASDAQ 100 reached new record highs, we expect further upsides and record highs on Dow Jones. A potential target could be at 30,000 pts as this psychological barrier will be a natural profit-taking level.