This year, The Dow Jones Industrial Average performance went down more than 36% during the first quarter collapse that dragged to the global stock market. Although the recovery experienced by the Industrial Average after March 23th keeps its performance on the negative side, the DJ-30 index could still reach a new all-time high.

Market Sentiment Overview
During the first quarter of 2020, the Coronavirus spread attained the status of a global pandemic, which triggered an economic crisis, originated from a worldwide lockdown. The economic context took down the stock markets. In particular, the U.S. stock market led the Industrial Average to plummet until the 18,213.5 pts, its worst level since November 2016.
Once Dow Jones found support in its lowest level of the year, after losing over 36%, the Industrial Average began to recover partially from of its losses, advancing near 49% from its March’s low to date.
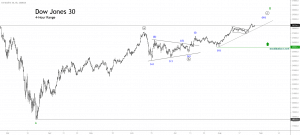
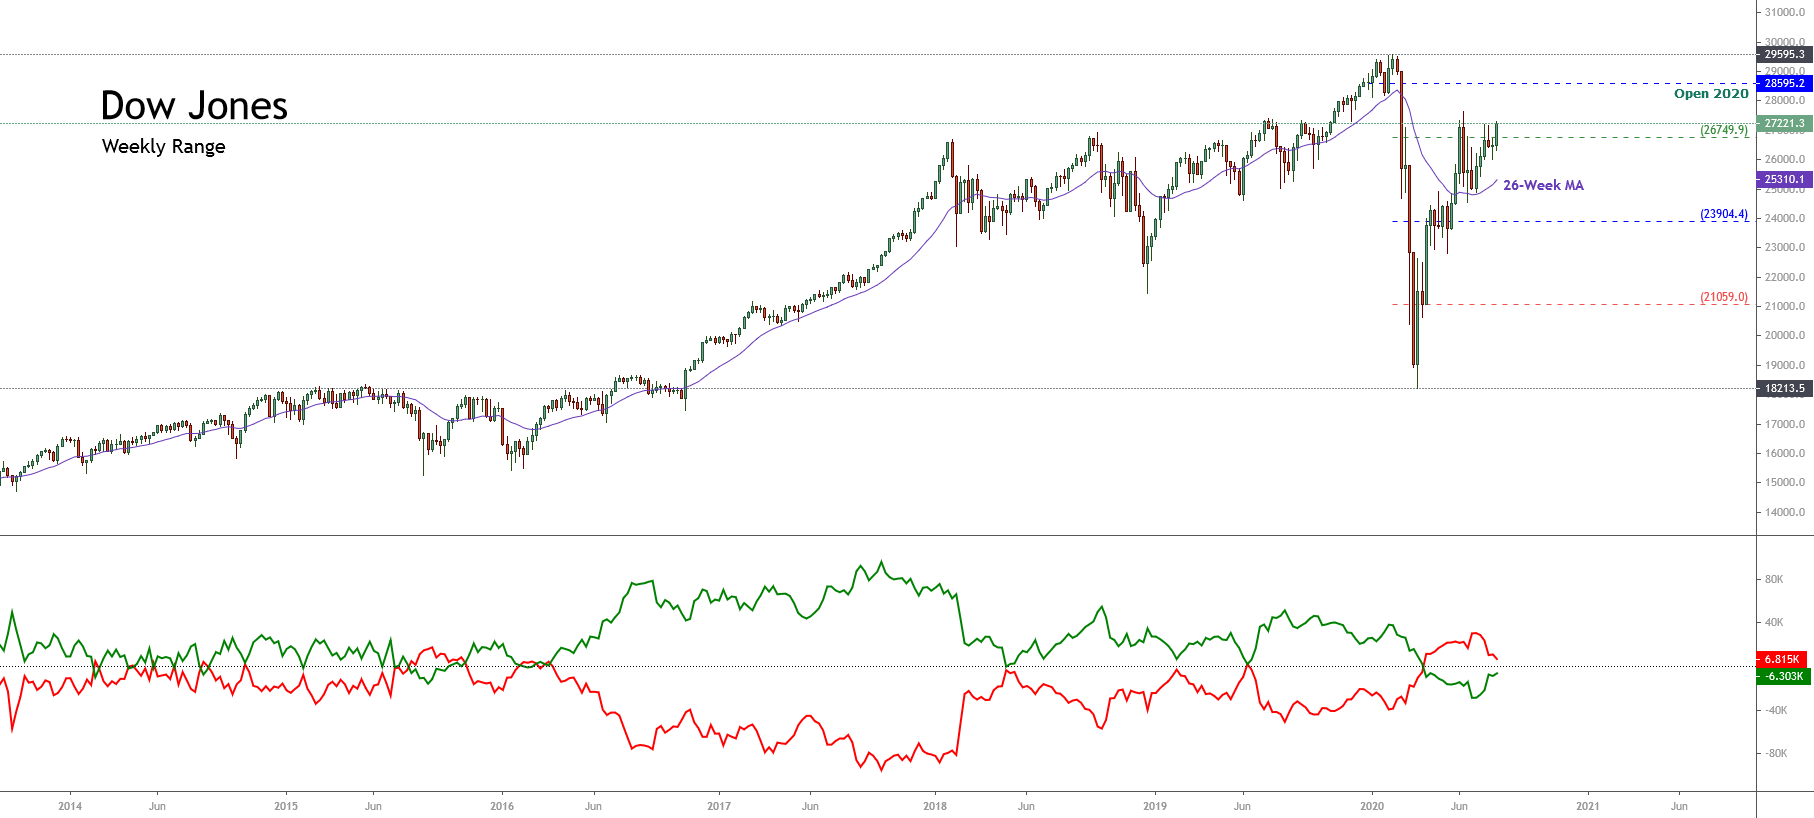
Under this context, the upper figure illustrates the Dow Jones moving in the 52-week high and low range’s strong bullish sentiment zone. At the same time, we distinguish its price moving above the 26-week moving average, which leads us to anticipate more advances in the short-term.
On the other hand, the Institutional Net Positions (green curve) informed in the latest CFTC report unveils that the speculative bull traders increased their positioning on the long side. However, the institutional sentiment remains on the bearish side.
In summary, the short-term sentiment remains on the long side. In this context, a potential recovery could make it advance toward the 28,595.2 pts, which corresponds to the opening price of 2020. On the other hand, if the Dow Jones Industrial Average develops a new bearish movement, the next key supports are located at 26,749.9 pts and 23,904.4 pts.
Elliott Wave Outlook
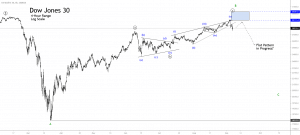
Under an Elliott Wave perspective, the big picture of the Dow Jones Industrial Average reveals its advance on an incomplete fourth wave of Primary degree identified in black.
The current bull market began in early March 2009, when the Industrial Average found fresh buyers at 6,466.6 pts. In the next figure, we distinguish that the third wave corresponds to an extended movement, which ended in early February when the Blue Chip U.S. stock market index found resistance at 29,595.3 pts.
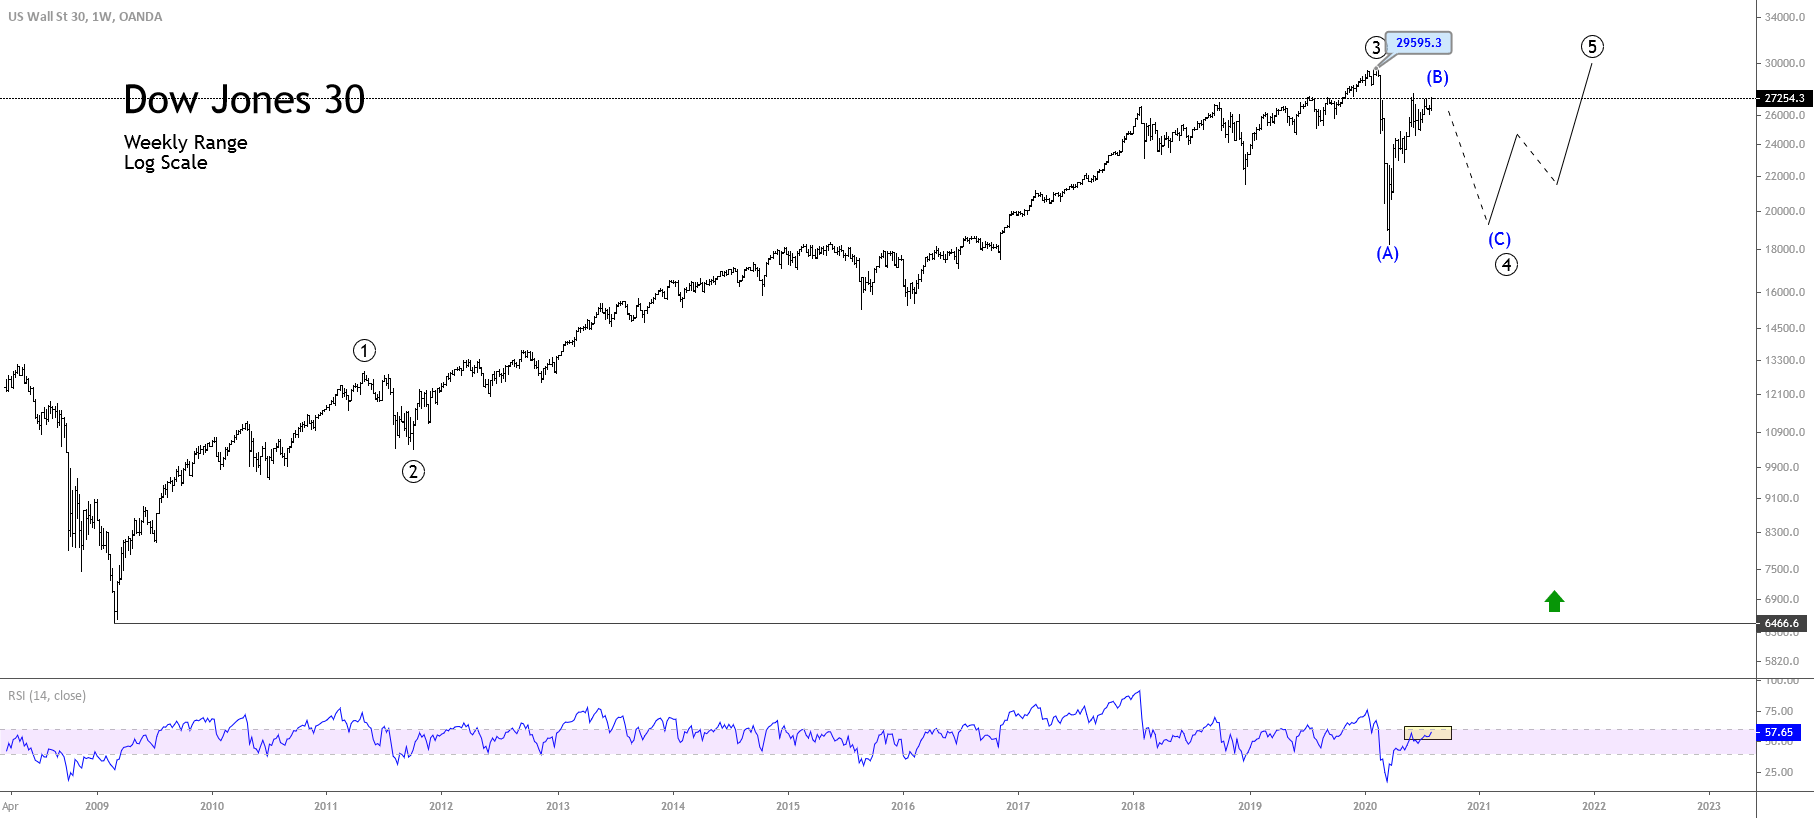
Currently, the Dow Jones index advances in its fourth wave of Primary degree, which progress on its wave (B) of Intermediate degree identified in blue. On the other hand, we noticed that the second wave (identified in black on the left of the chart) developed a simple correction in a brief lapse of time. In this context, and considering the alternation principle, the fourth wave should be a complex correction that should take longer than the second wave, for instance, in the form of a triangle formation, or a double three pattern. After this corrective wave formation, the price action should continue the bullish trend developing a fifth wave of Primary degree with a potential target at the psychological barrier of 30,000 pts.
Finally, with the completion of the five-wave upward sequence of Primary degree, the Industrial Average would complete a motive wave of Cycle degree. Hence, the end of the current bull market will give way to a downward corrective sequence in three waves of Primary degree.