Overview
The Dow Jones Industrial Average stopped its progress that started on the March 23rd’s low at 18,213.5 pts, from which it proceeded toward the 29,193.6 pts, reached on September 03rd. This movement made it recover its yearly losses that happened in the first quarter of 2020. The latest decline observed following the ending-diagonal breakdown leads us to warn about a likely bearish scenario.
Market Sentiment Overview
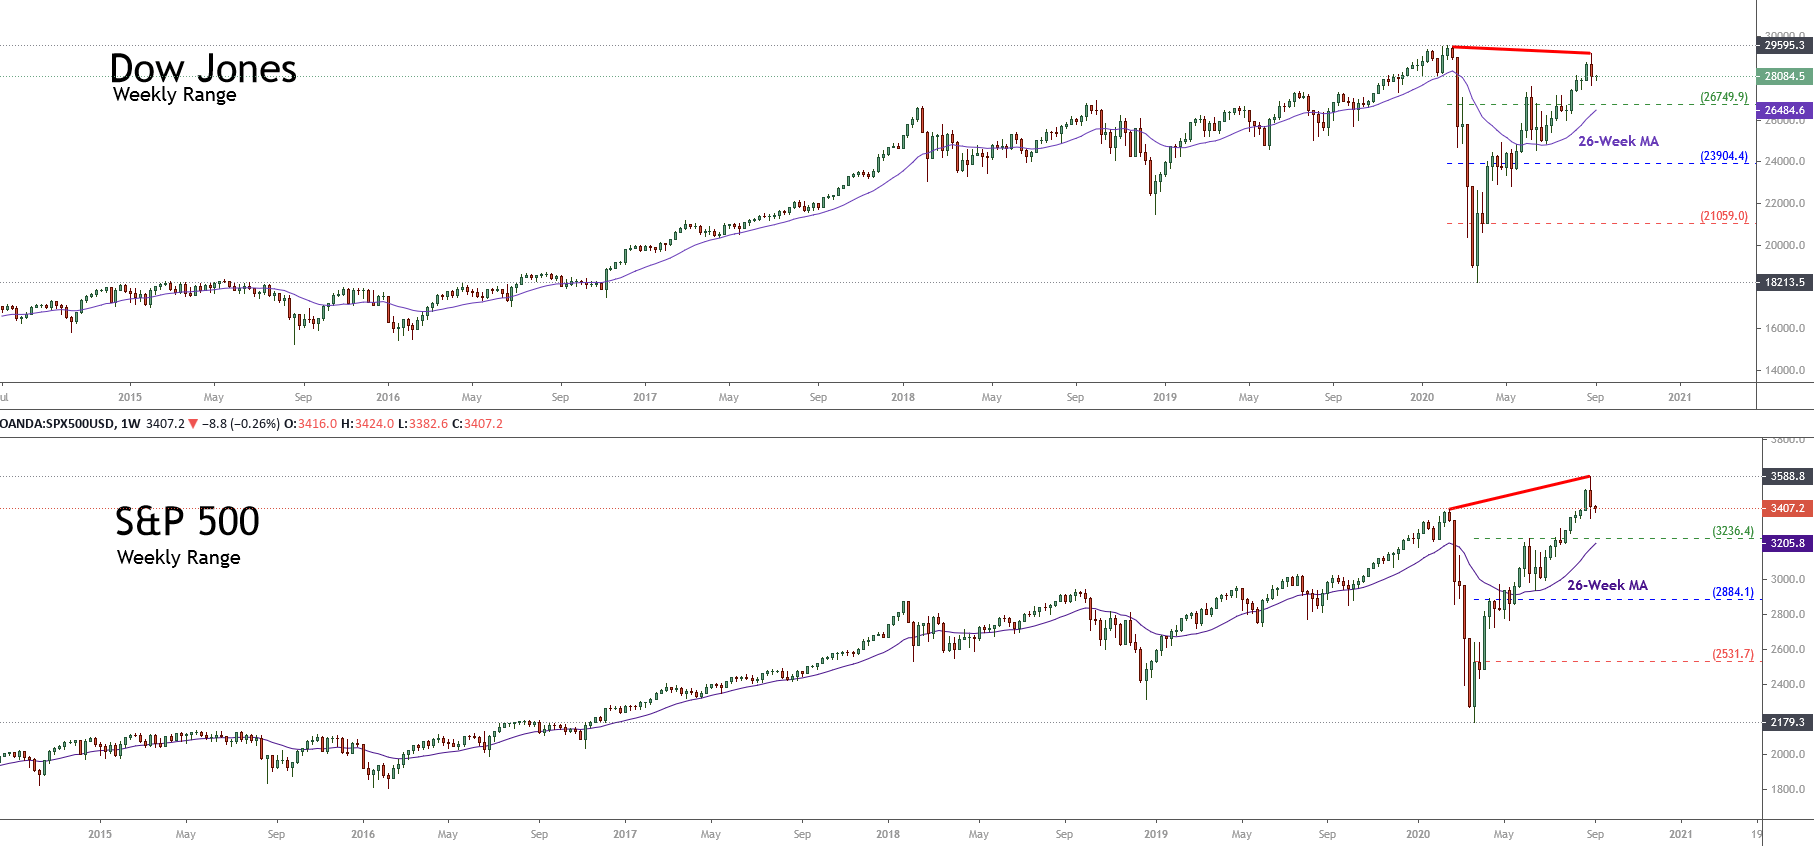
The Dow Jones Industrial Average stopped its advance from the mentioned recovery in our previous analysis. In our previous outlook, we commented about the divergence between the S&P 500 and the Industrial Average, which still did not reach a fresh record high as the S&P 500 did. As the following figure illustrates, the divergence observed between the two U.S. indices drives us to the conclusion that the last all-time high reached by the S&P 500 remains without confirmation by the Dow Jones. This situation carries us to expect the exhaustion of the current stock market recovery.
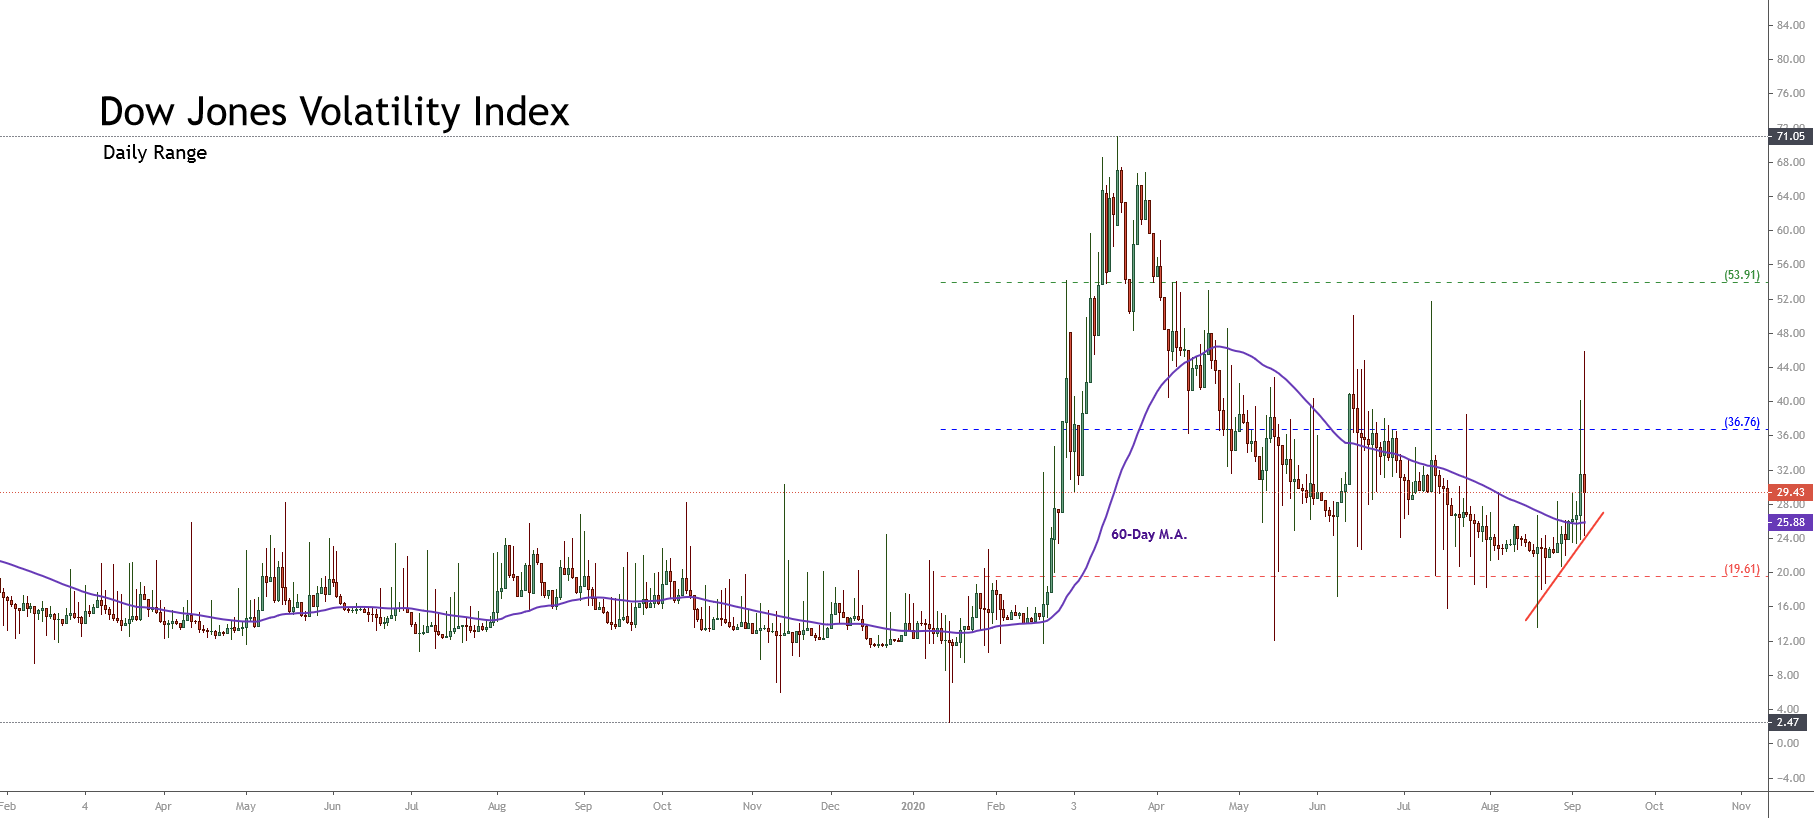
The next chart illustrates the Industrial Average in its daily timeframe. In the figure, we distinguish the market action moving on an extreme bullish sentiment zone, confirmed by its price action above the 60-day moving average. However, the latest sell-off negated the strike of the opening 2020 price easing near to 1.75% (YTD).
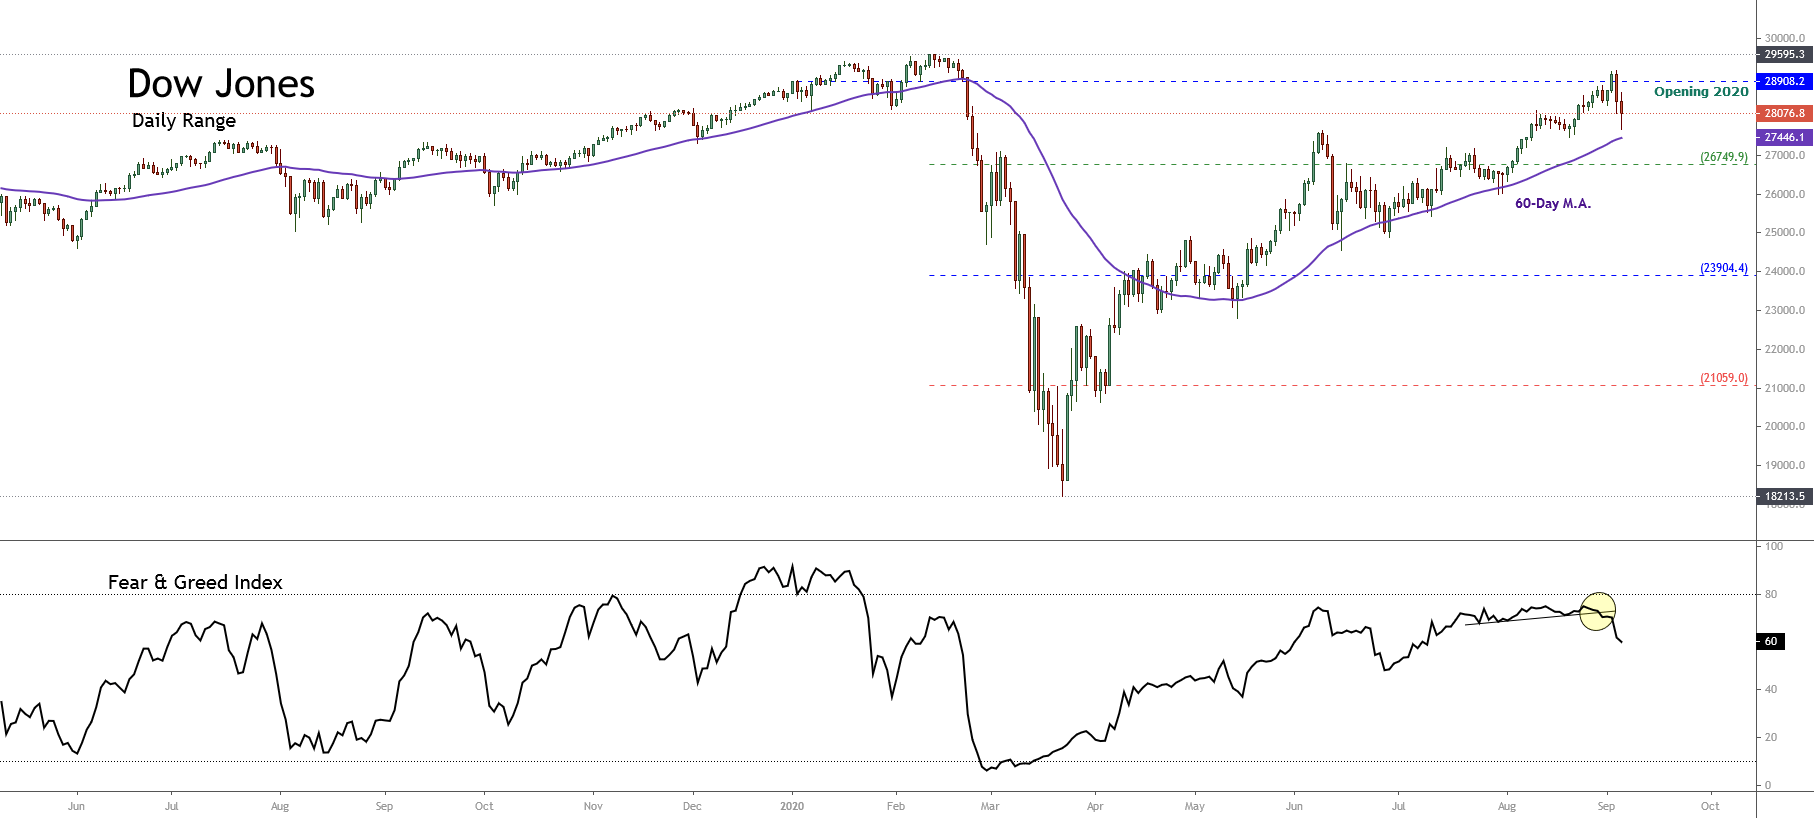
The breakdown observed in the Fear and Greed Index highlighted in yellow, signal the decline of the bullish sentiment prevailing during the previous stock market sessions. This reading adds to the context observed in the Dow Jones Volatility Index daily chart, which remains well in the bearish sentiment zone – above the 60-day moving average. This leads us to suspect that the recovery observed in the stock market is ending.
In consequence, from a market sentiment perspective, our position for the Dow Jones changes from bullish to neutral expecting the bullish continuation or bearish reversal confirmation.
Elliott Wave Outlook
Under the mid-term Elliott Wave perspective, the Industrial Average in its 4-hour chart reveals the completion on September 03rd of the fifth wave of Minuette degree labeled in blue, as the price topped at 29,193.6 pts., where Dow Jones found fresh sellers.
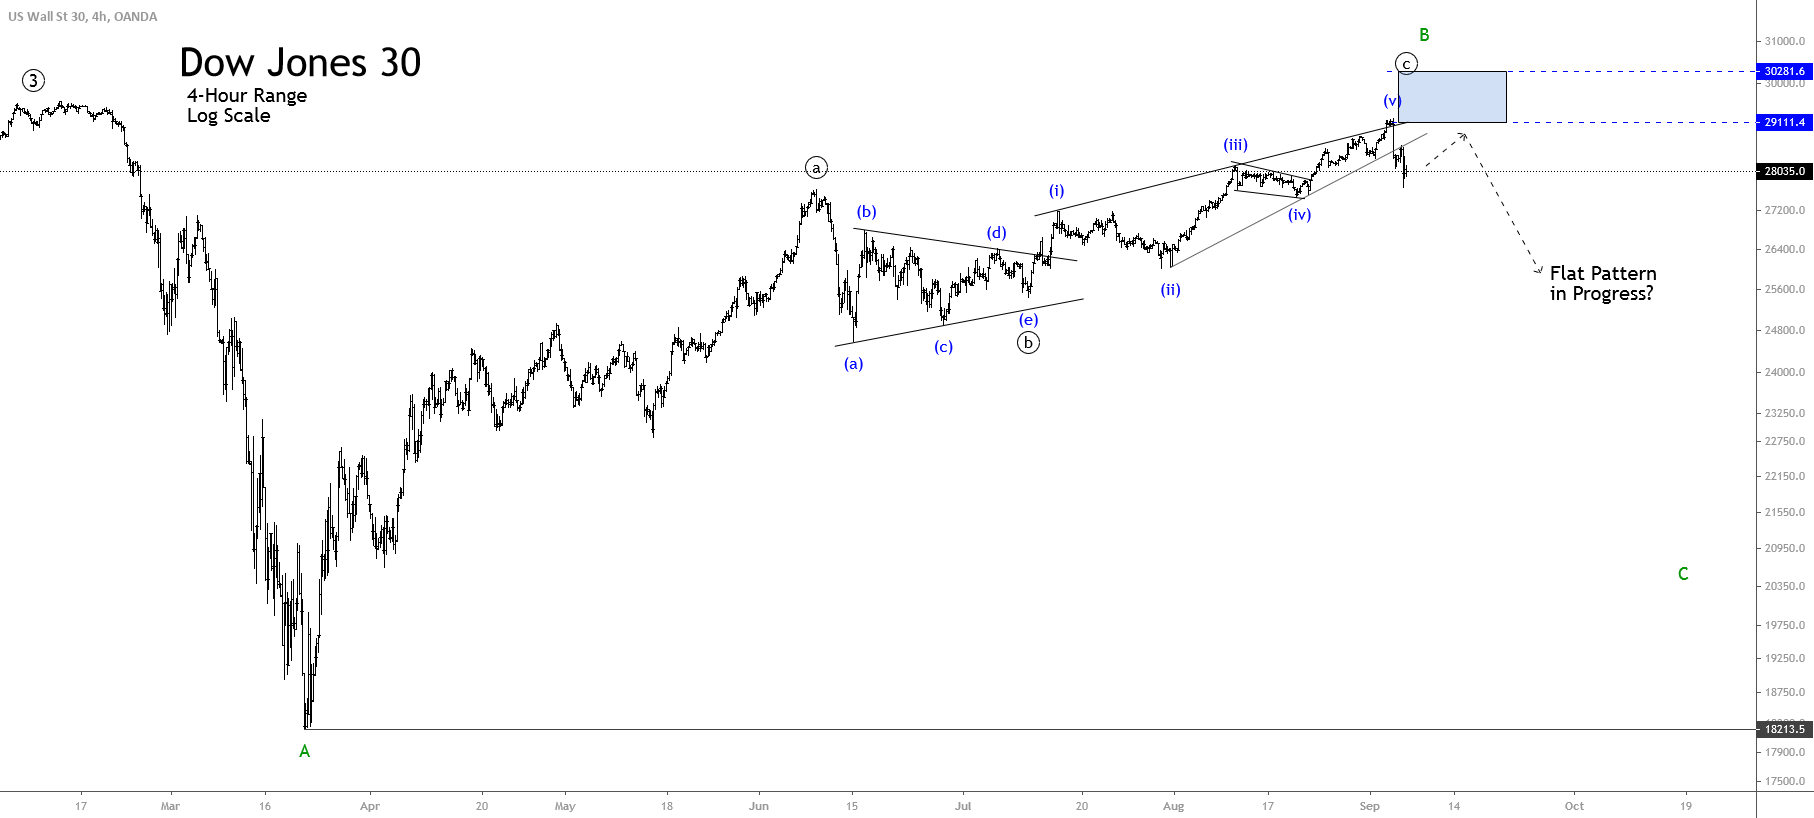
The last Dow Jones rally observed in the previous chart, developed in five waves, illustrates an ending diagonal pattern, which, after the price broke and closed below the line (ii)-((iv), dropped until the wave (iii) in blue. This movement leads us to expect further corrections in the U.S. stock market.
Simultaneously, the completion of the wave ((c)) of Minute degree in black and wave B of Minor degree in green points us to anticipate the development of a regular flat pattern, which follows a 3-3-5 structural sequence. In this context, Dow Jones might start to develop a new decline into five waves.
Finally, our central perspective for the Industrial Average remains neutral, expecting additional confirmation signals for the next movement. If the price action confirms a bearish continuation, the Dow Jones index could find support in 21,000 pts.