Categories
Forex Videos

The DOW Jones Is Getting Ready To Drop!


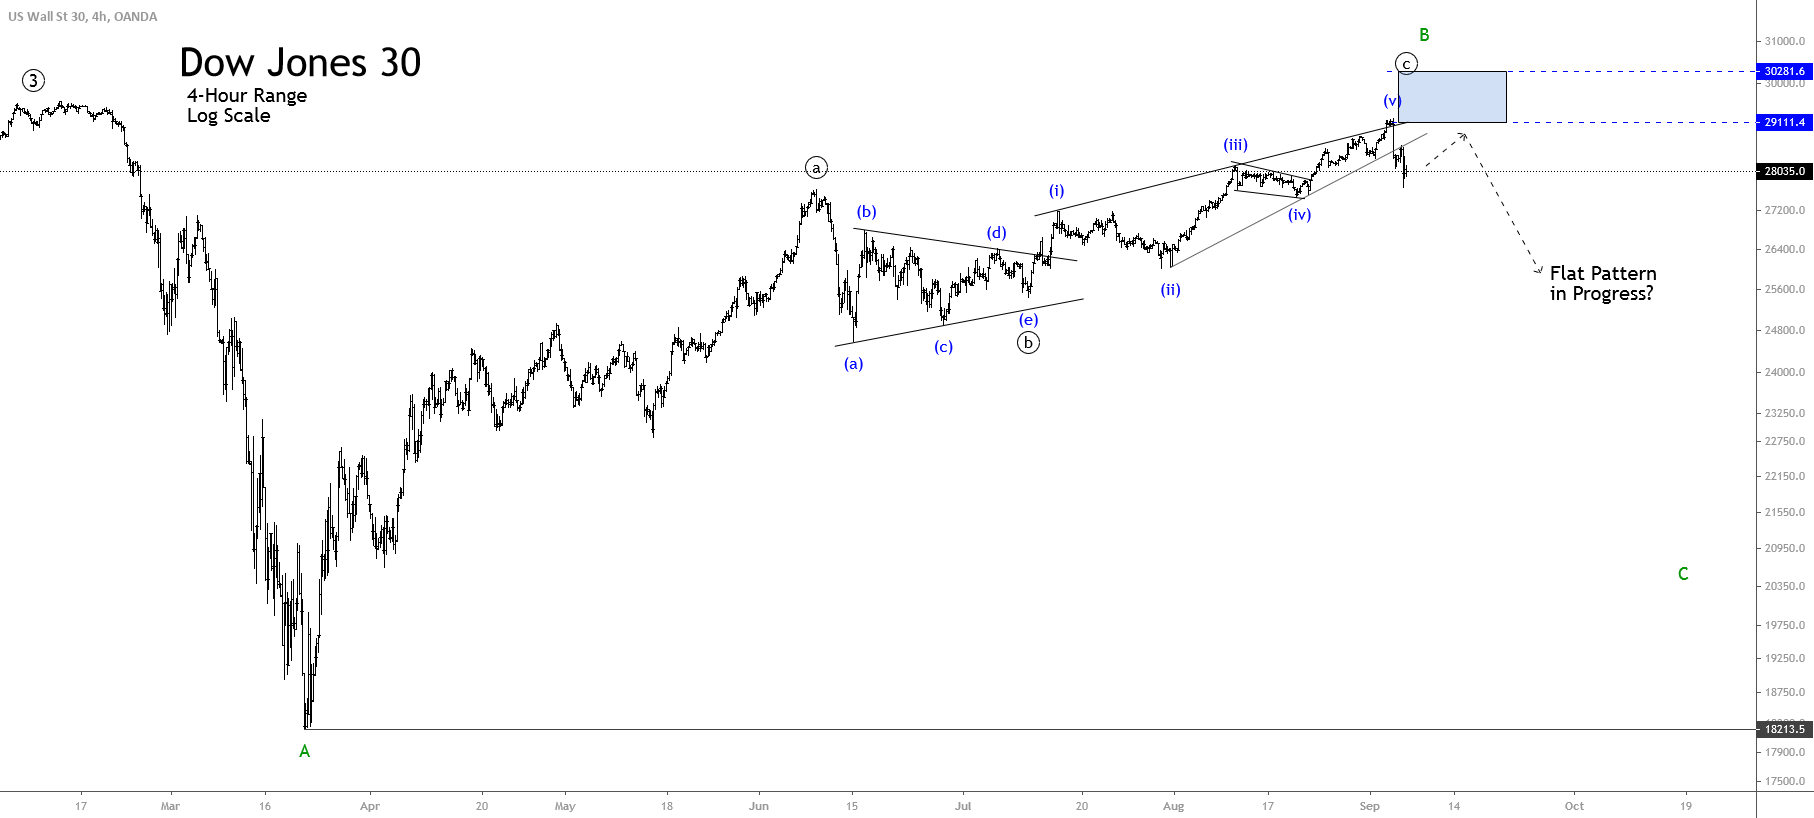
Dow Jones 30 Industrial index pulls from historic highs. Where next?

 Thank you for joining this forex academy educational video.

In this session, we will be looking at the potential directional bias for the United States Dow Jones 30 industrial index, which has recently hit a historic high.

On the 6th of January 2021, the United States capitol riot shocked the world. The United States Congress insurrection was carried out by a mob of Donald Trump’s supporters in an attempt to overturn his defeat of the 2020 presidential election.

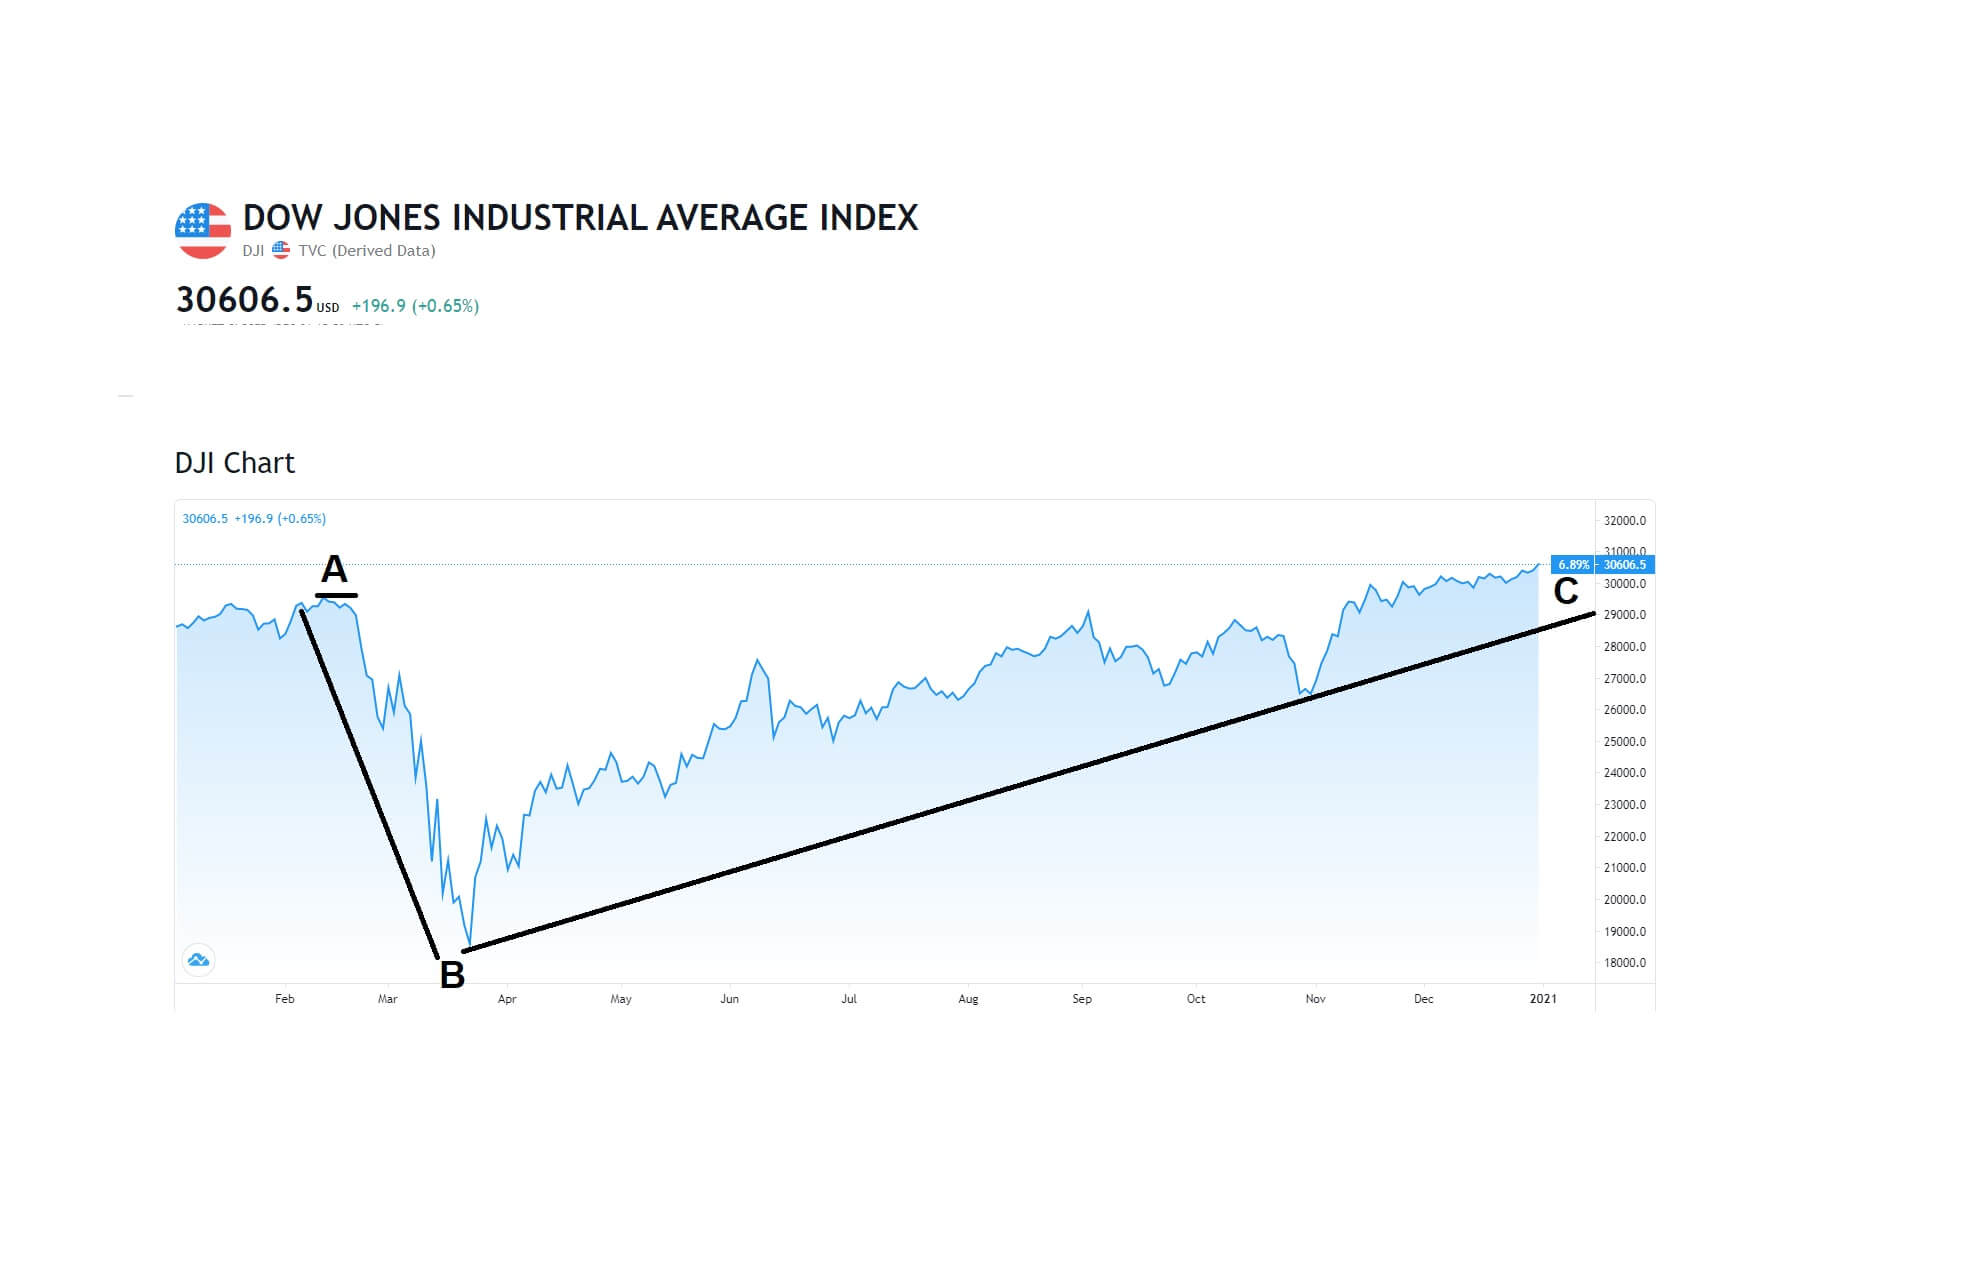
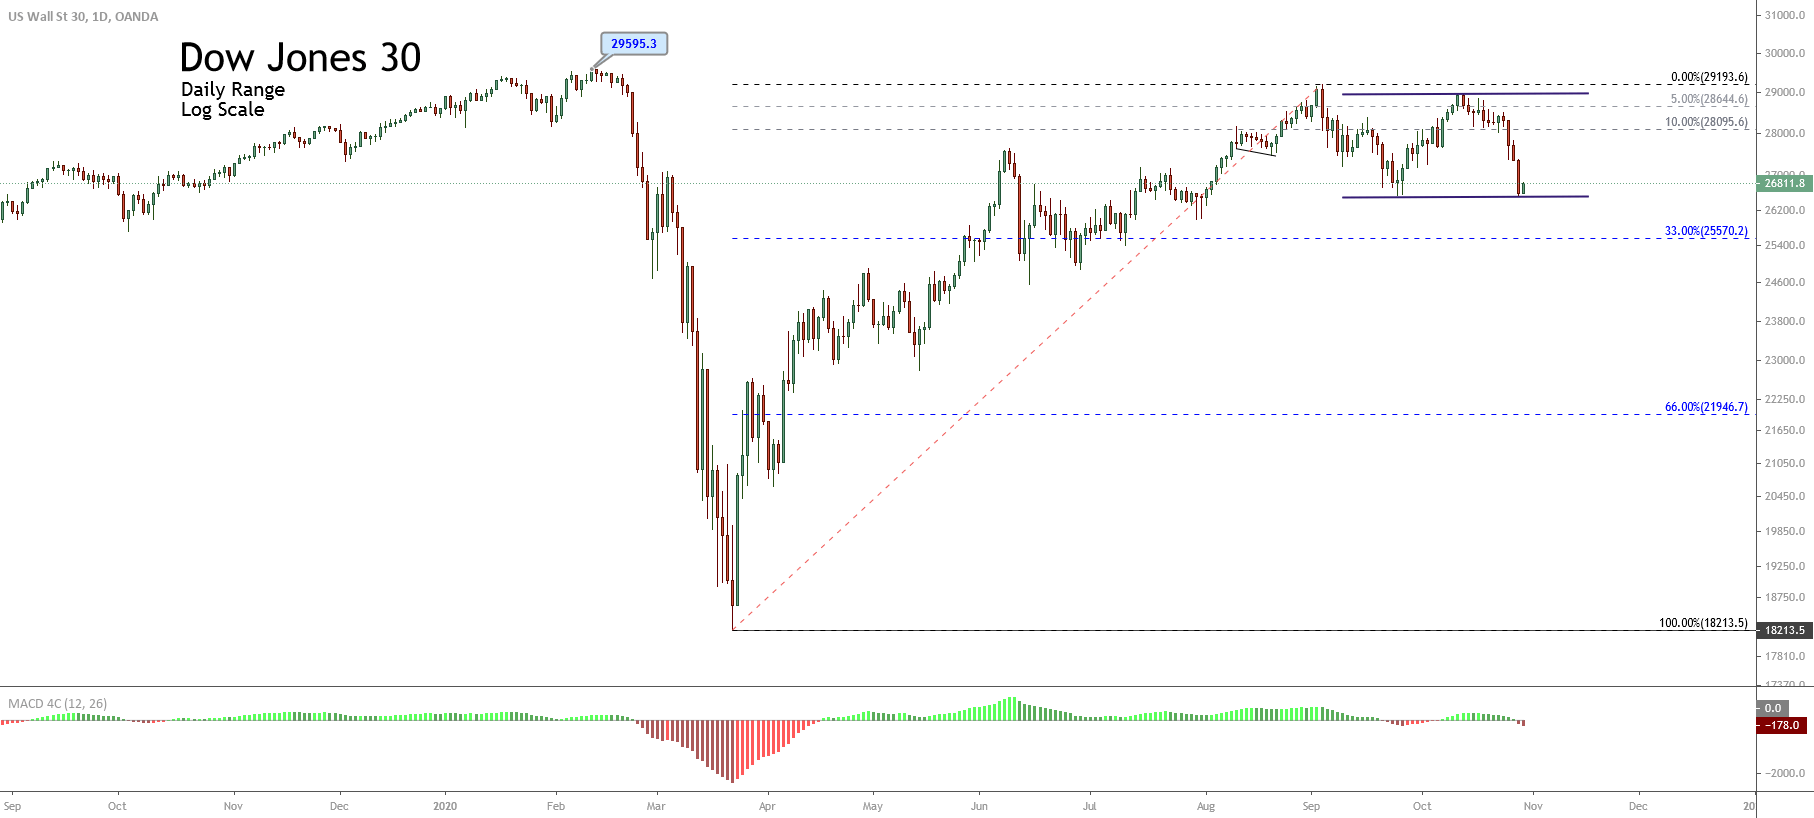
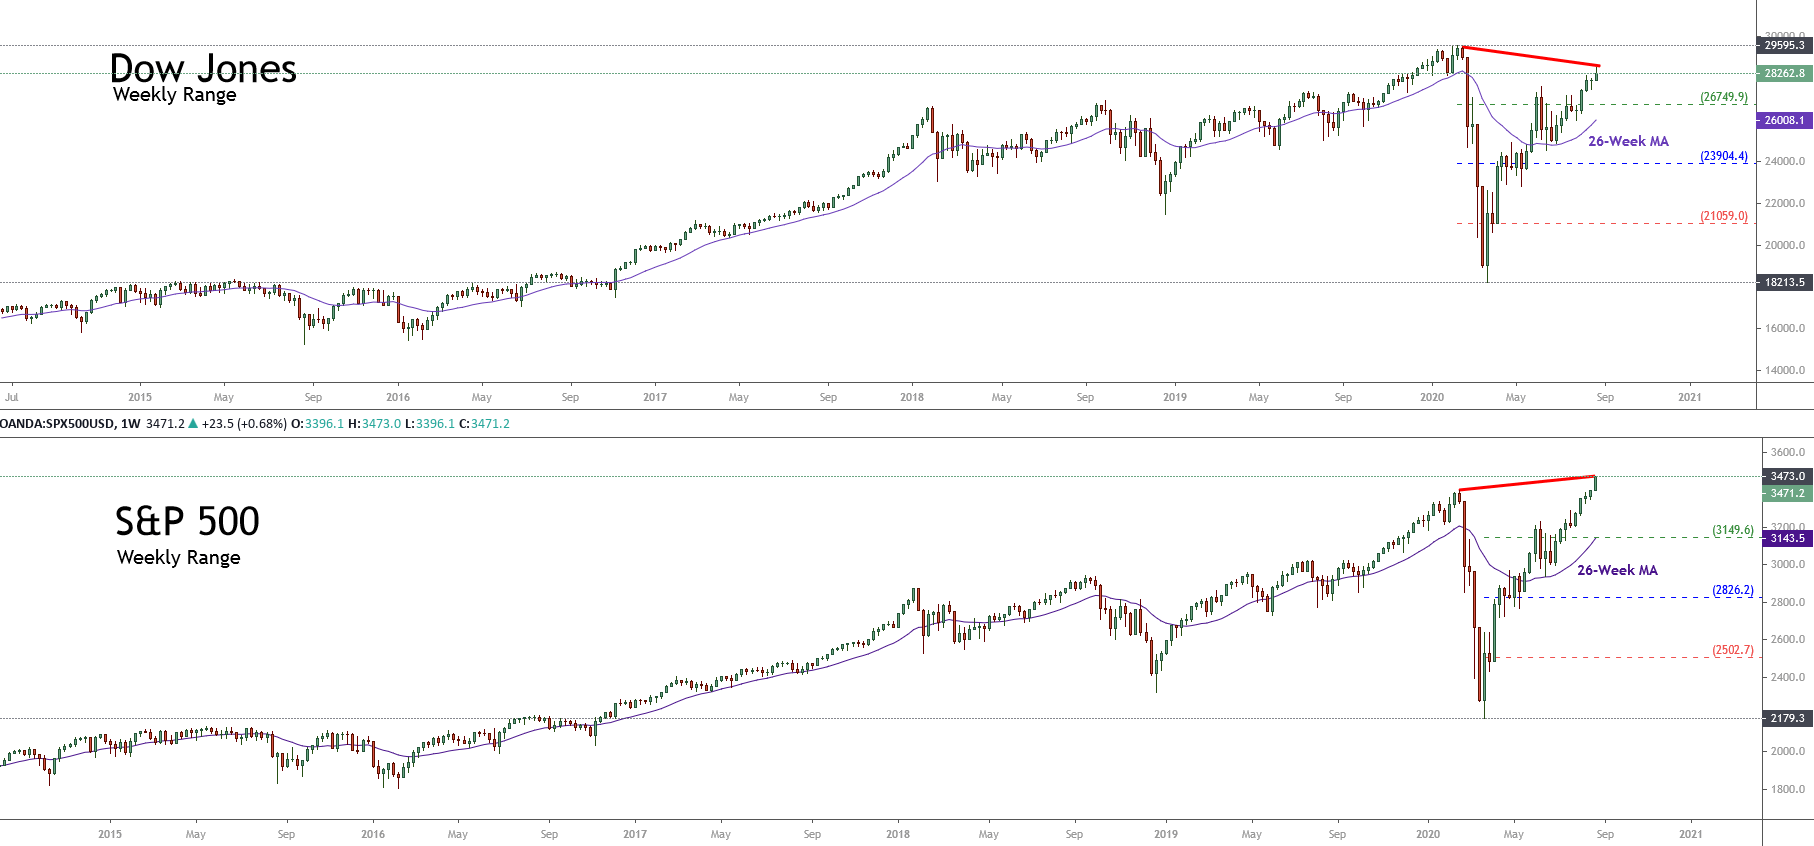
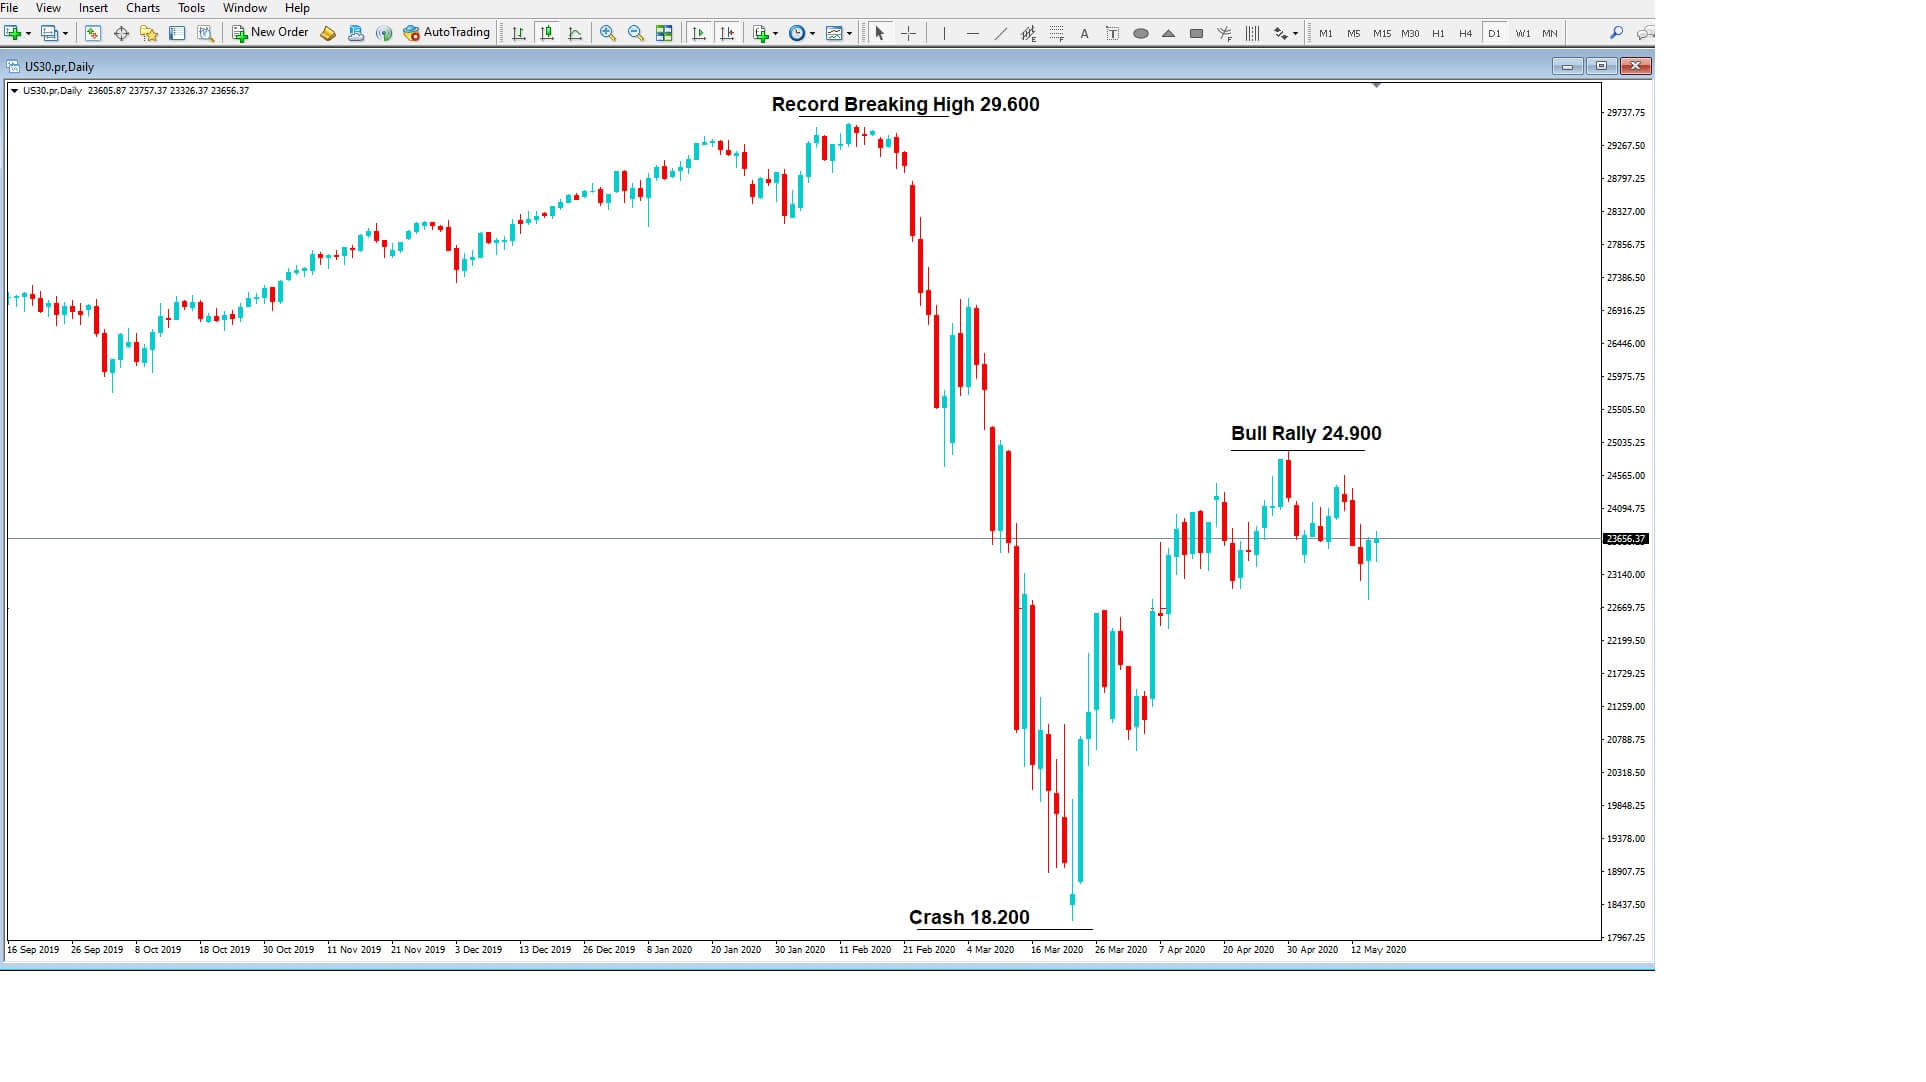
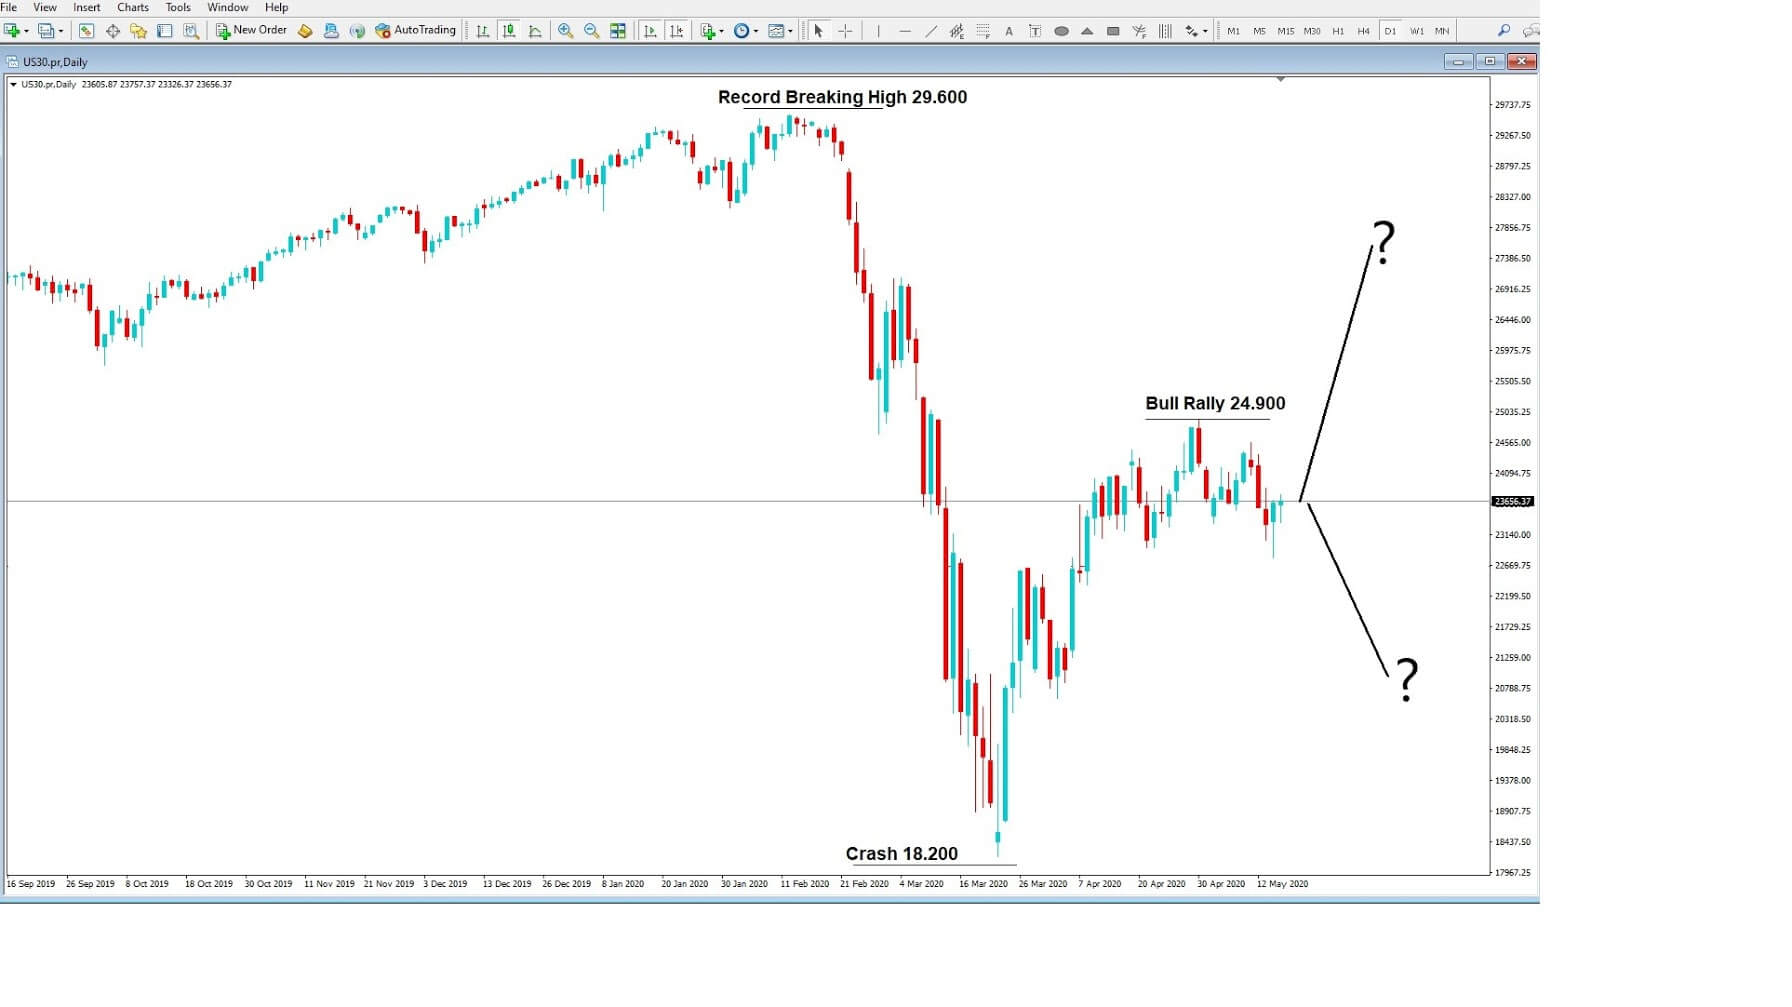
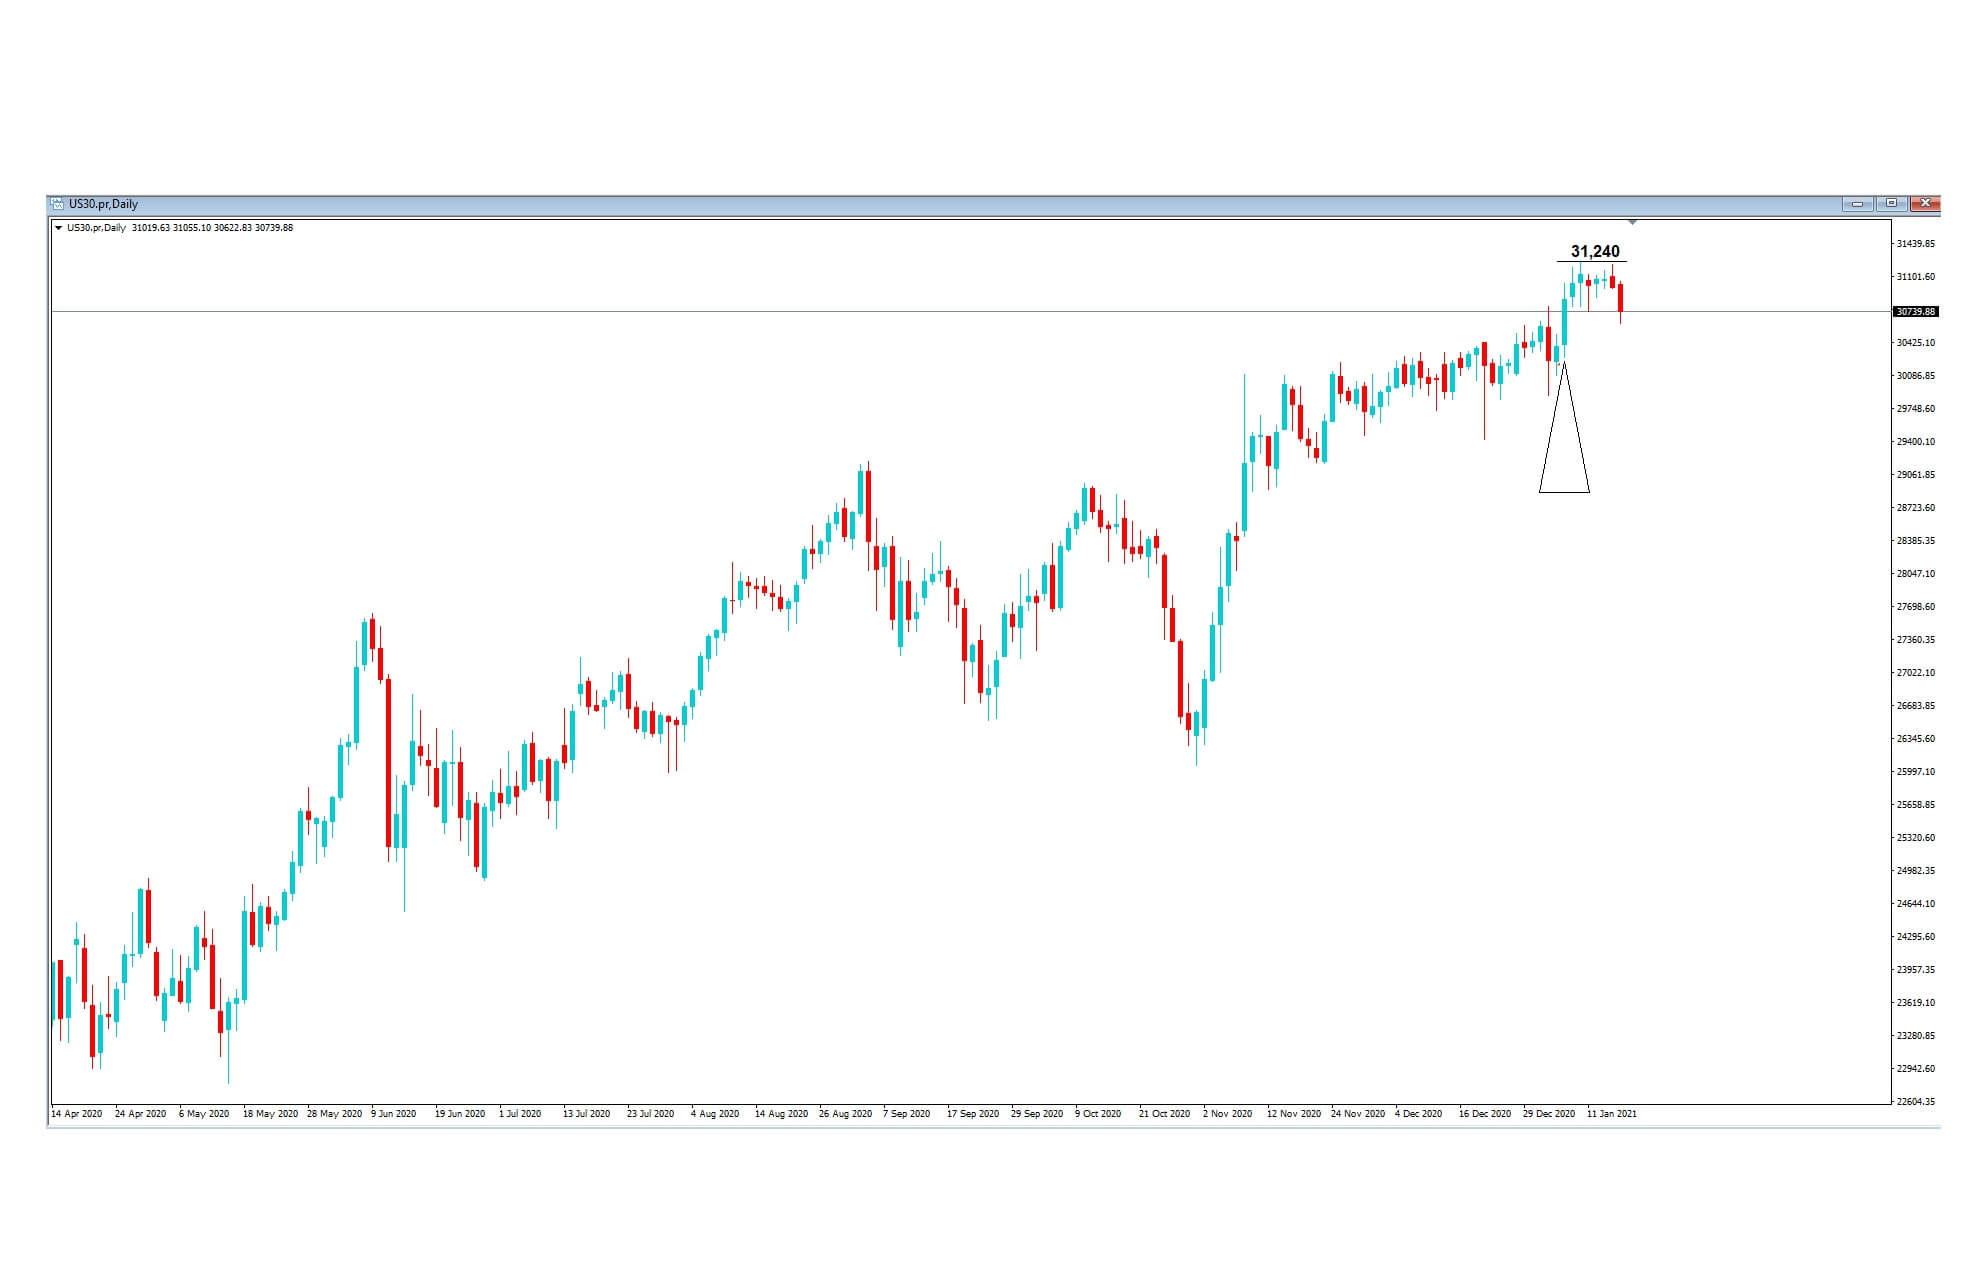
While the world’s media focused on the attack of the most advanced political system in the world, which was viewed by billions of people across the globe in utter shock and disbelief, and where 5 souls, including a police officer, lost their lives in the riot, the Dow Jones 30 industrial index, in a somewhat unexpected move, aggressively turned bid, and subsequently went on to reach an all-time record high around the 31,200 level.

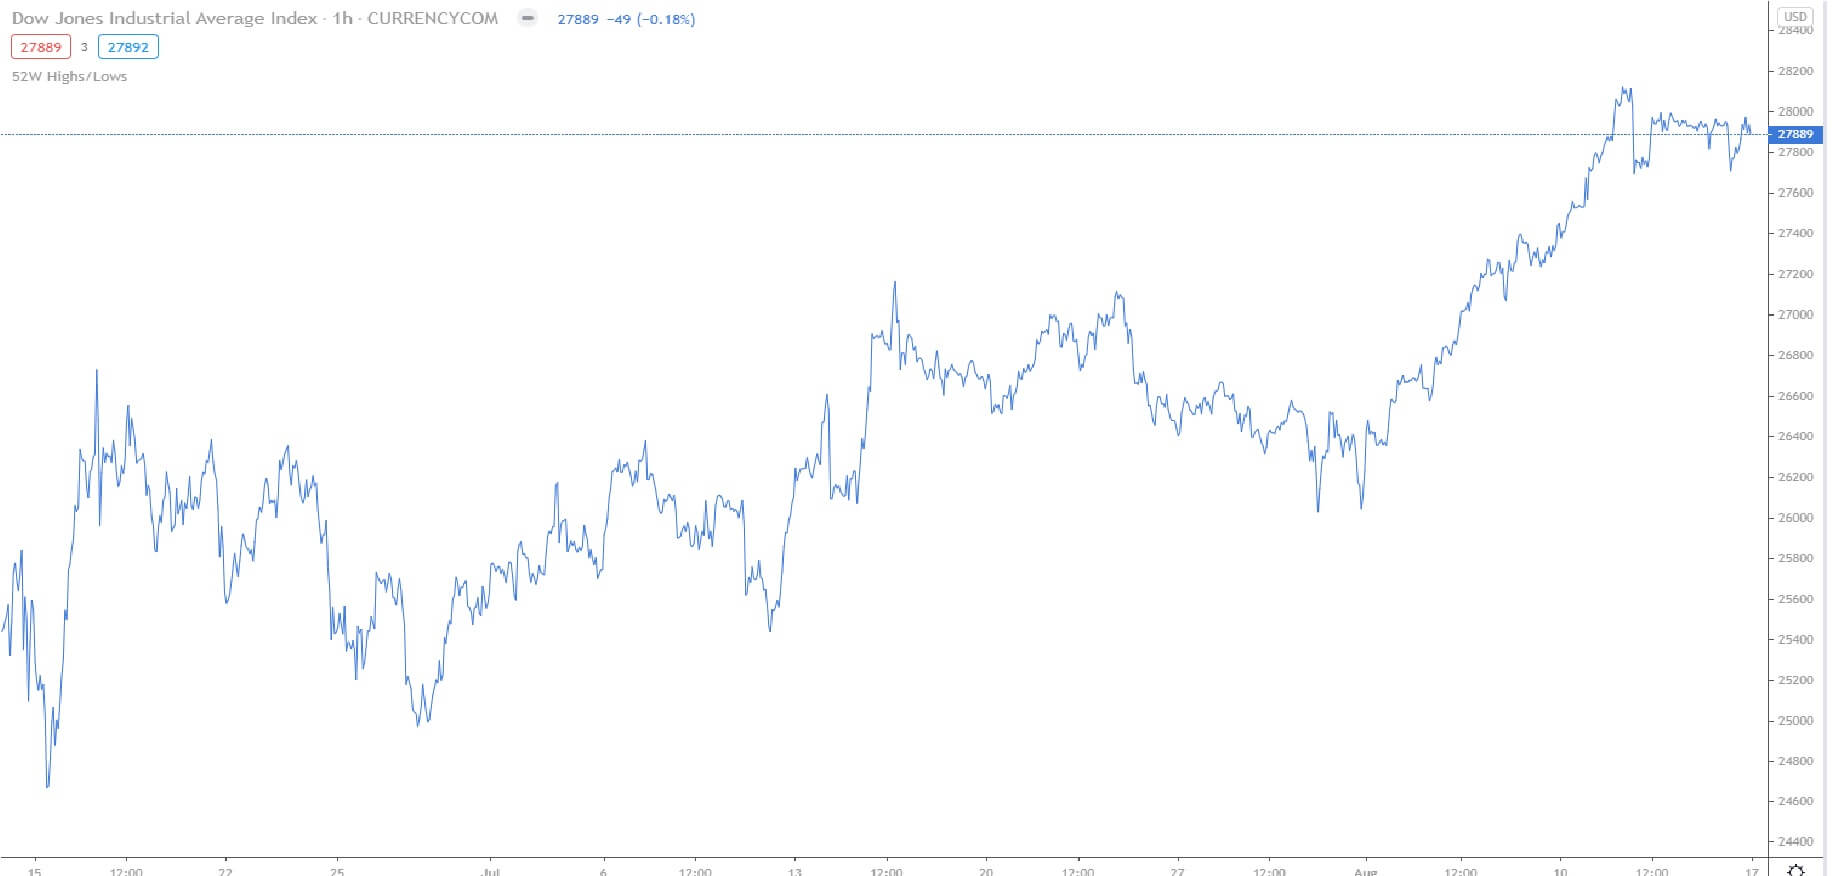
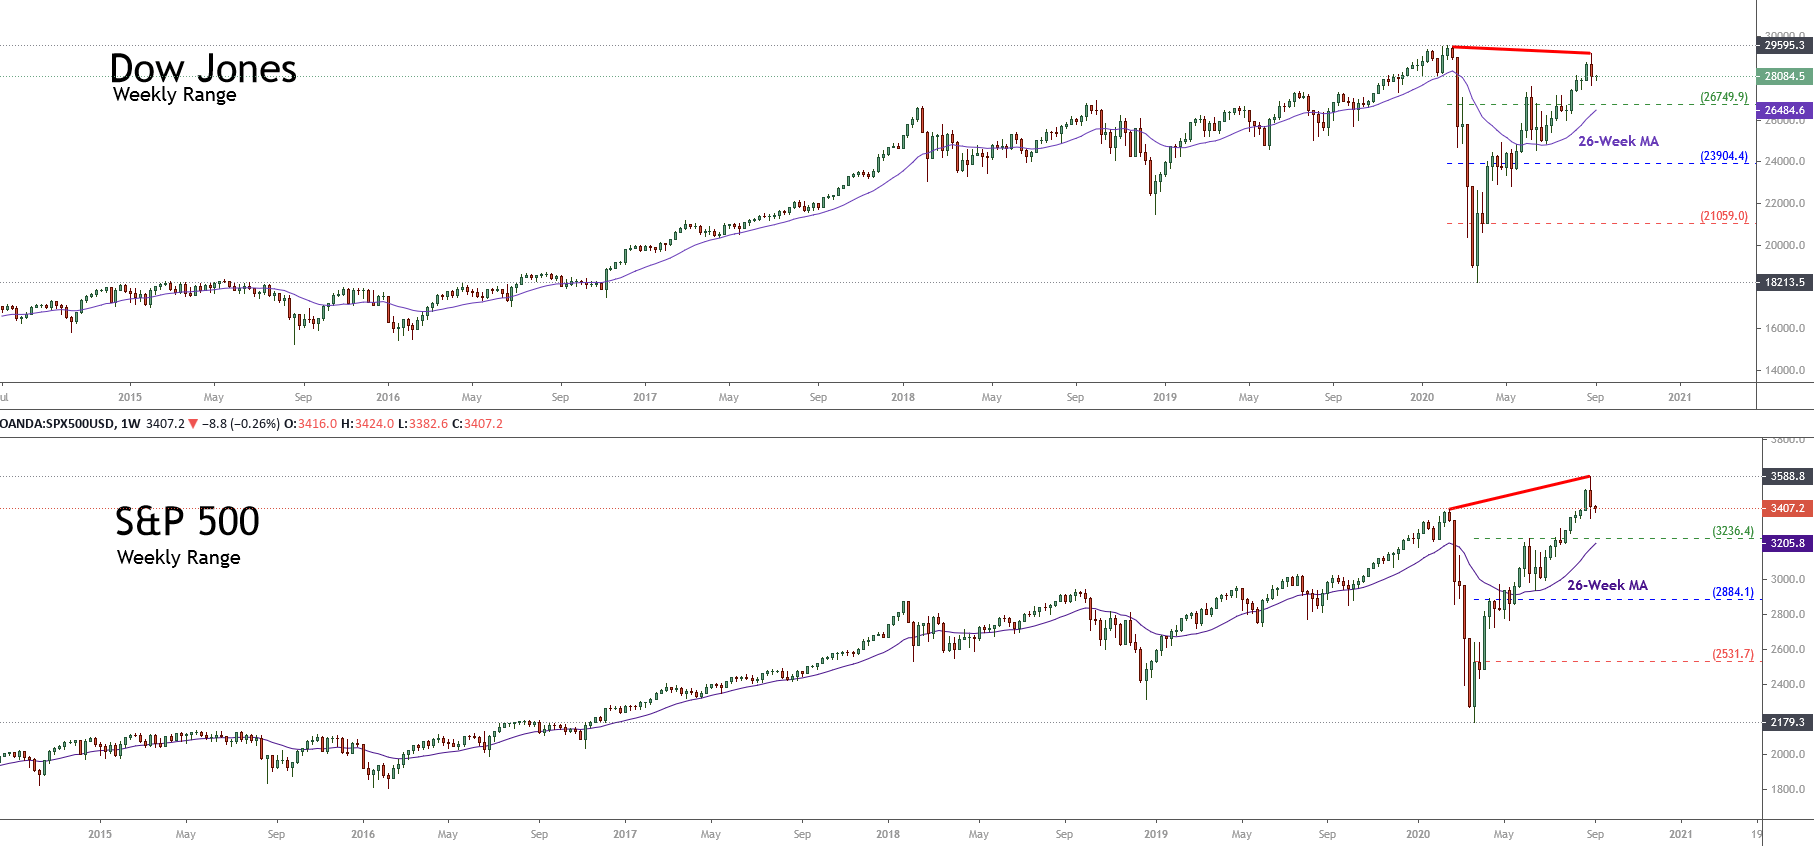
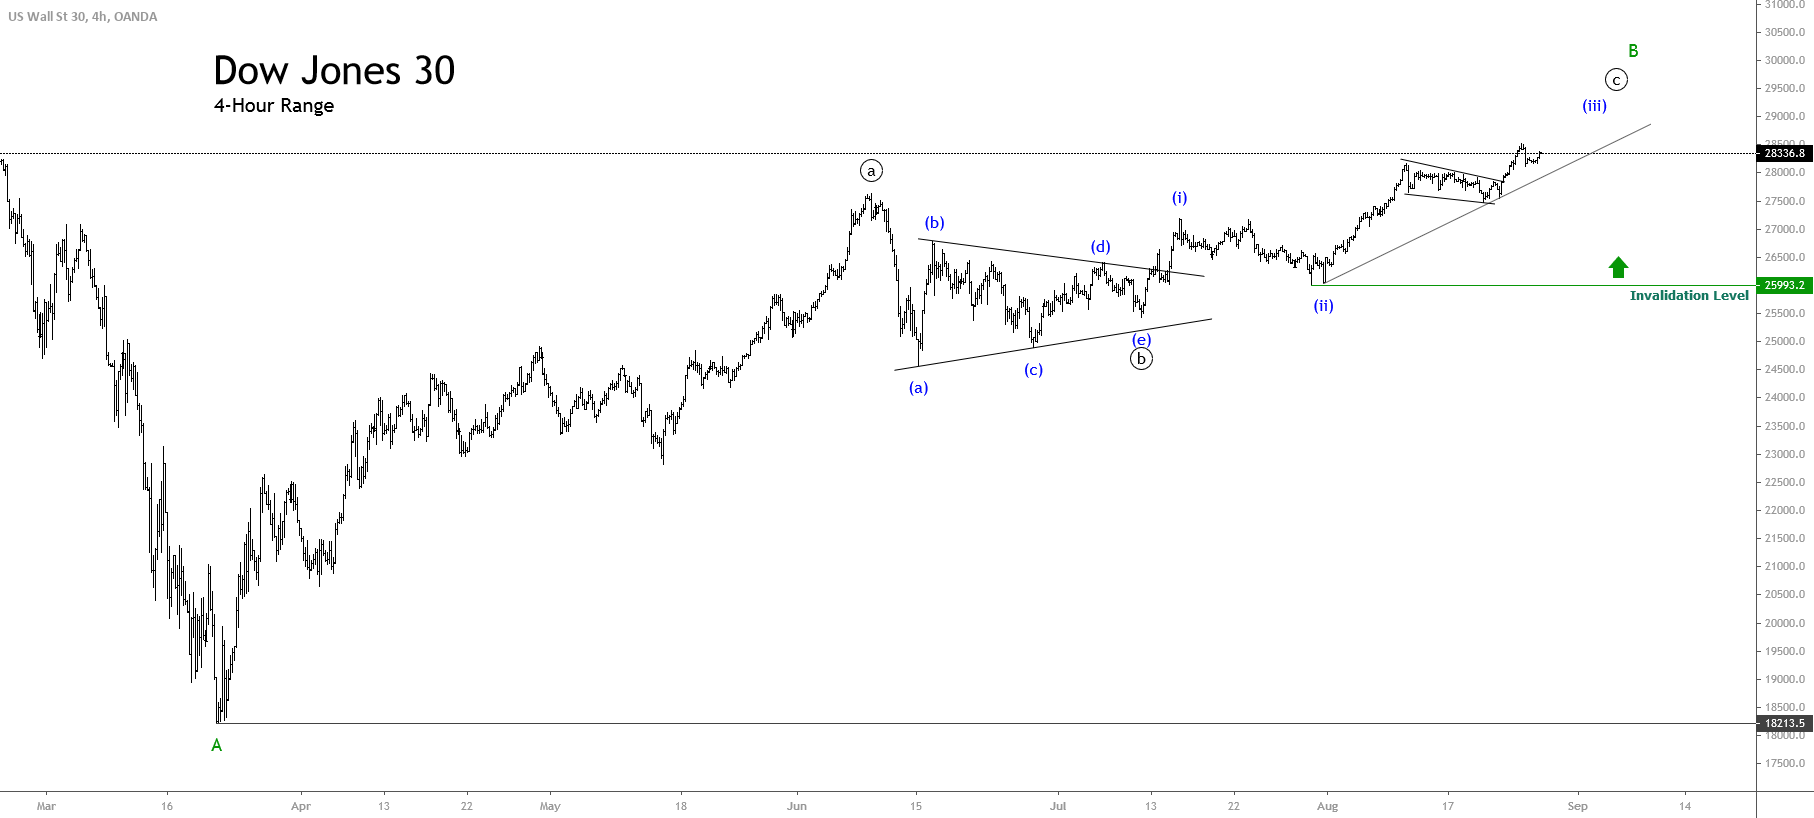
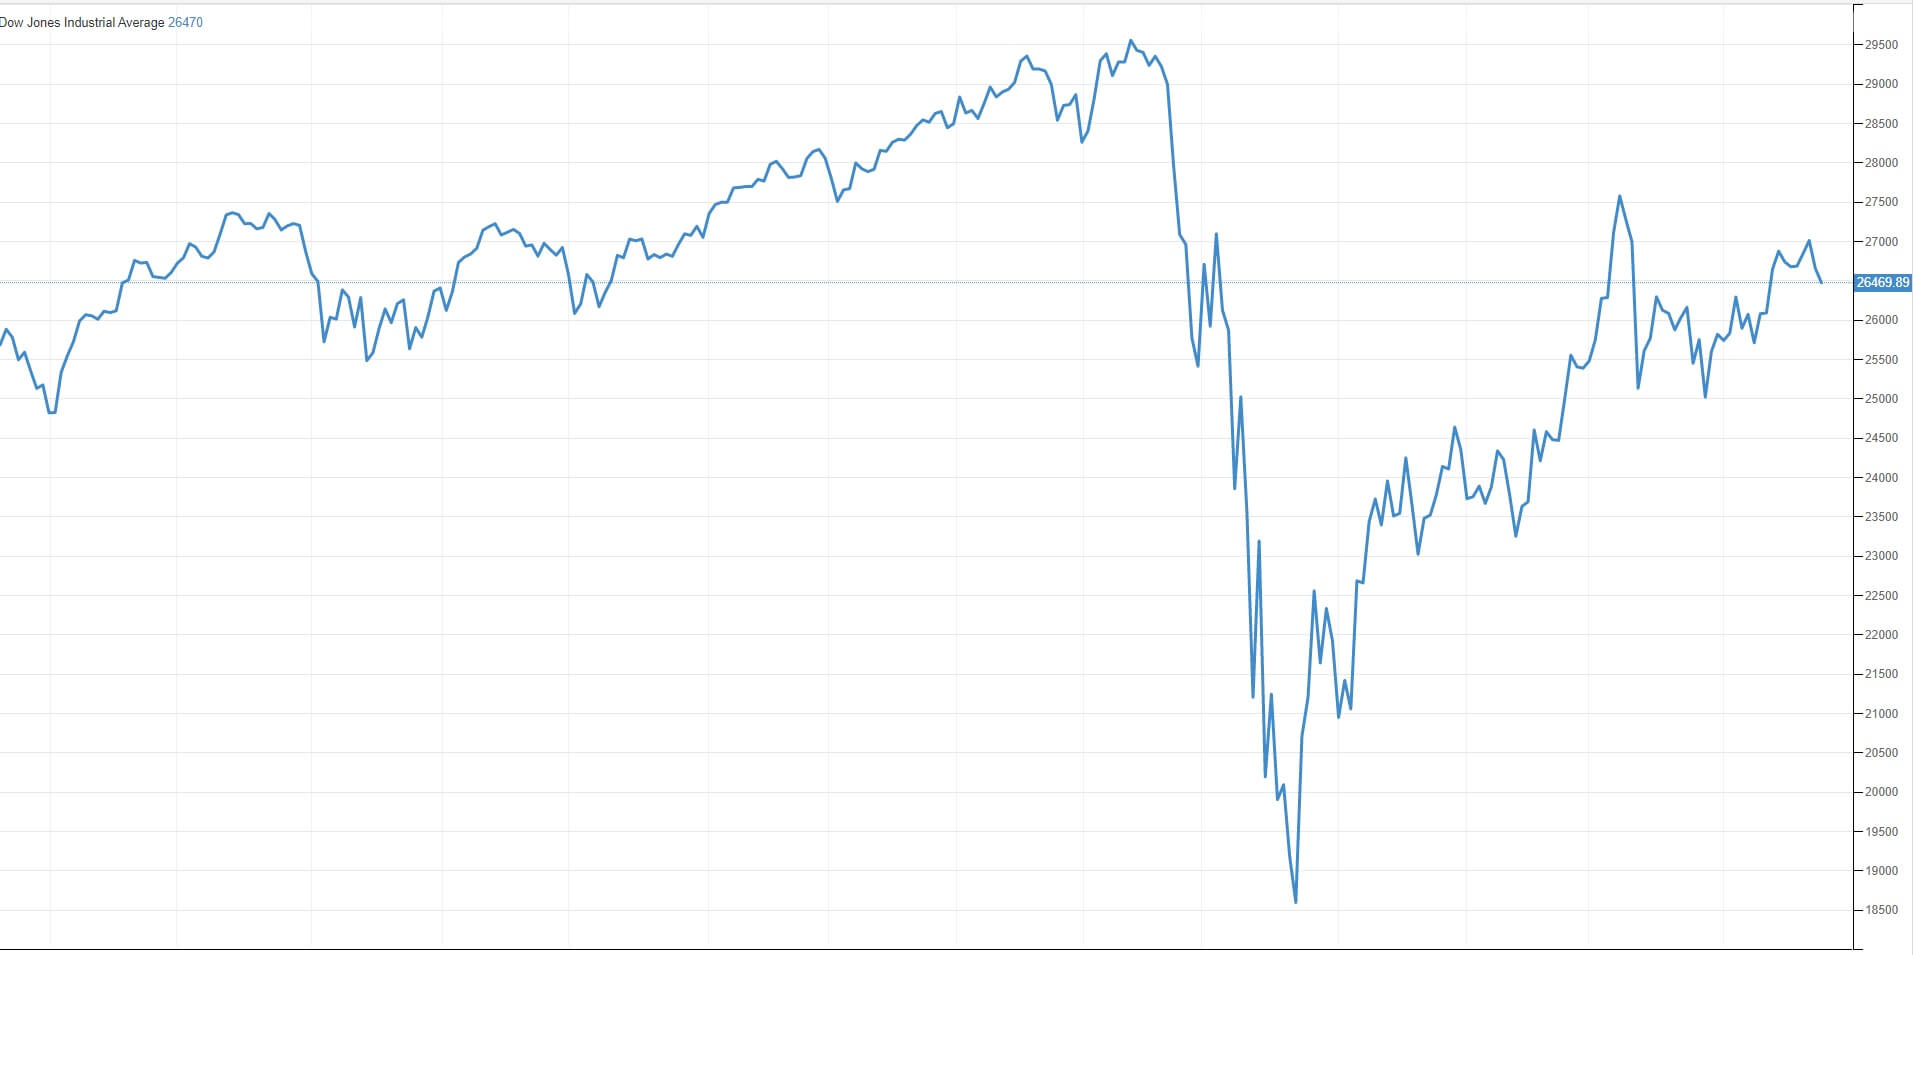
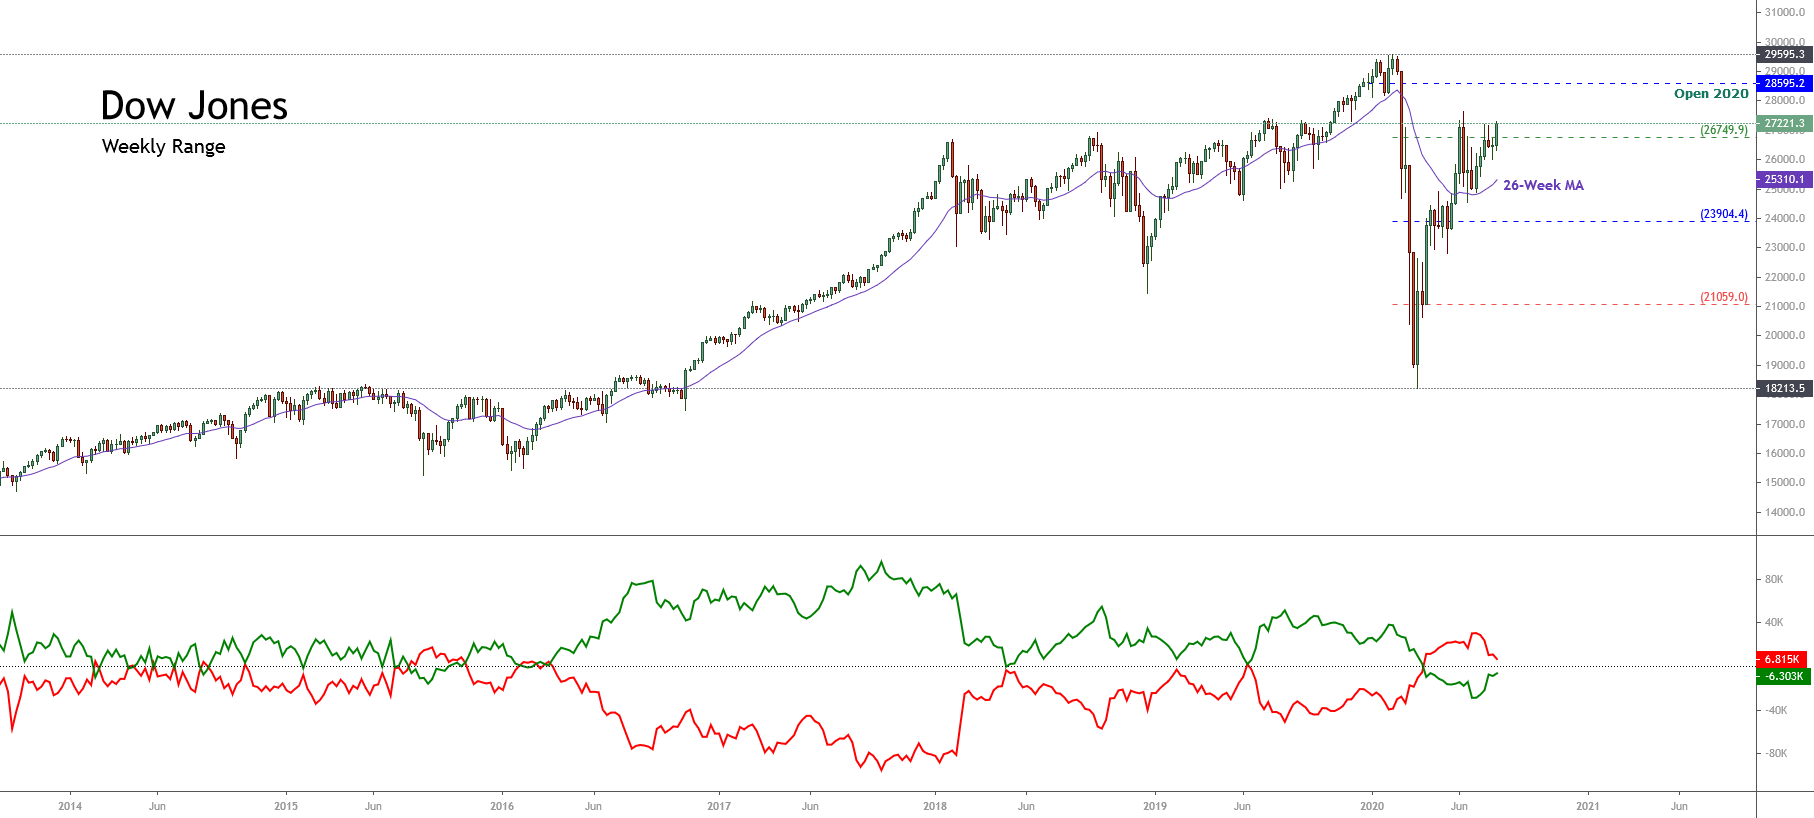
The bull run has largely been a continuation of the 18,000 low reversal in March when the pandemic began to bite the US economy and caused the shock collapse from its recent 29,500 record-breaking pre-pandemic high.

Much of the pre-pandemic record-breaking high on us stock indices, including the Dow Jones 30, can be attributed to the Trump administration’s policies of low taxation for corporations and less red tape for them. Indeed, had it not been for the pandemic, President Trump may well have gone down as one of the best presidents ever in terms of revitalising the United States economy, where it also so reached a record number of US citizens in employment.

However, with Trump and the republican party on the way out, and with Biden and democratic about to take office on the 20th of January, 2021, the incredible amounts of money which have been thrown at the US economy to prop it up during the pandemic from the coffers of the United States treasury department,  must be repaid,  and where president-elect, Joe Biden has made it quite clear, during his campaigning, that he intends to raise corporate taxation in order to find some of the money, and where he will also reverse policies of the previous government,  such as low red tape requirements for businesses.

In which case, there is an obvious conflict, whereby one government’s policies caused Dow Jones to be at a record high and where the incoming party is about to reverse the policies which caused the record run, which will likely cause pressure on those businesses, which will have less profit due to higher taxation, in which case the stock market should reverse its winning streak? So why the continued bull run on stocks?

This can largely be put down to positioning.  Where hedge funds, banks, investors, and other financial institutions are preparing themselves for a potential future shock by driving stock indices higher before any such new legislation will cause a likely negative impact on stocks.

Quite often, investors will position themselves for future shocks by driving an asset higher, in anticipation of a future correction lower, – or the other way – which on a fundamental economic basis, in this scenario, should be the way forward if such policies of higher taxation were introduced. More tax equals less profit, equals lower dividends for investors, and lower corporate valuation.

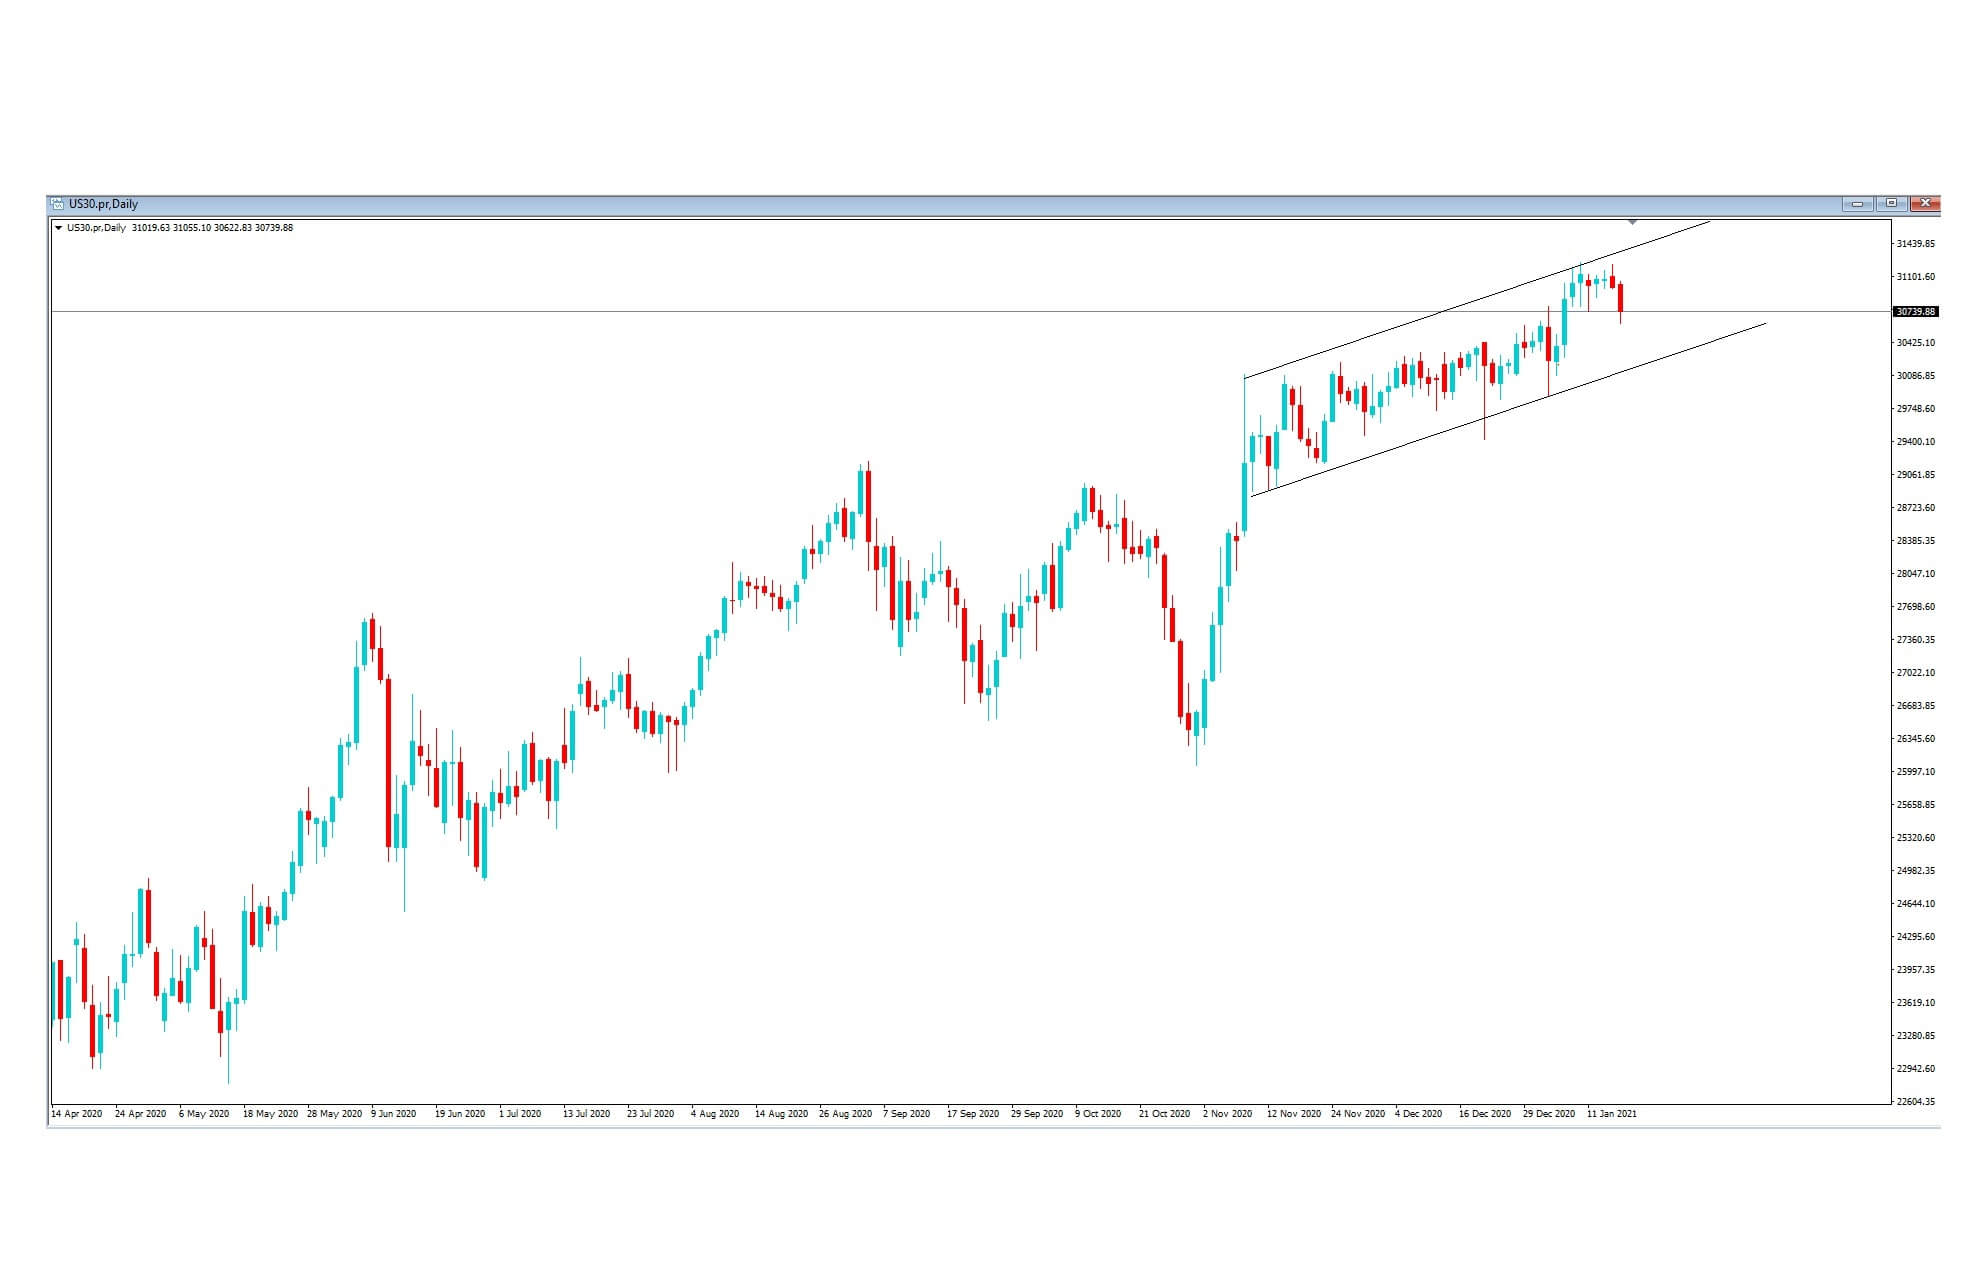
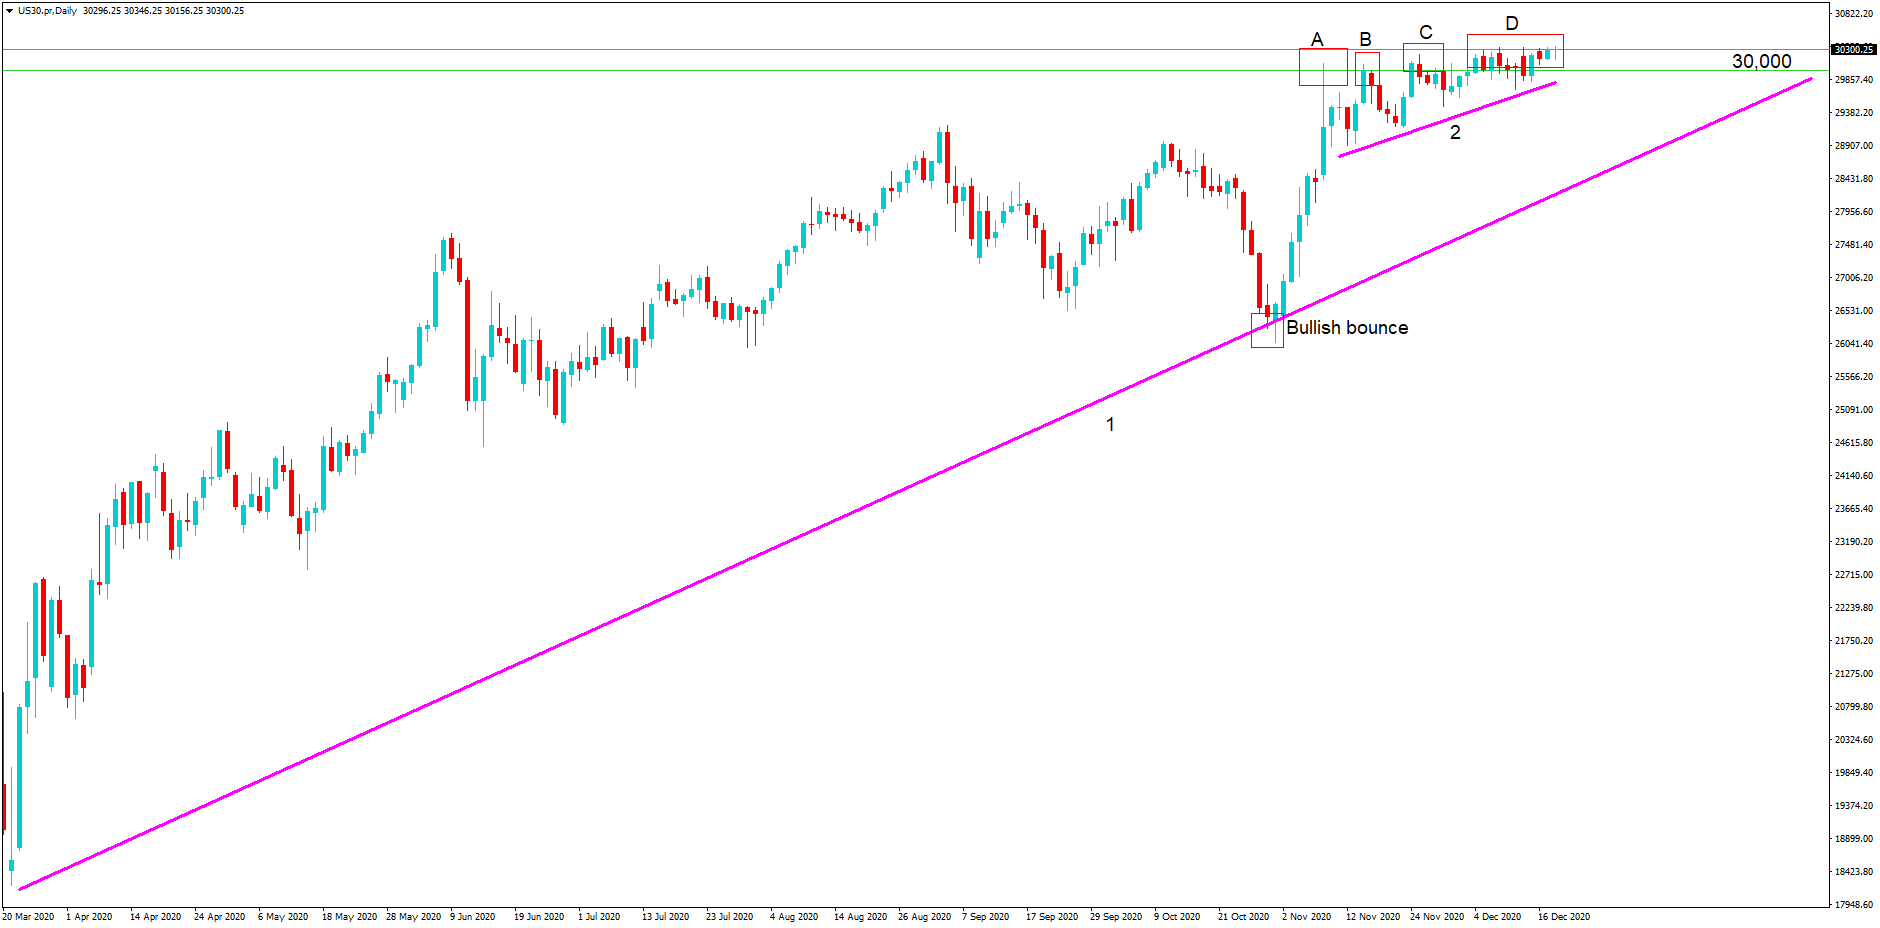
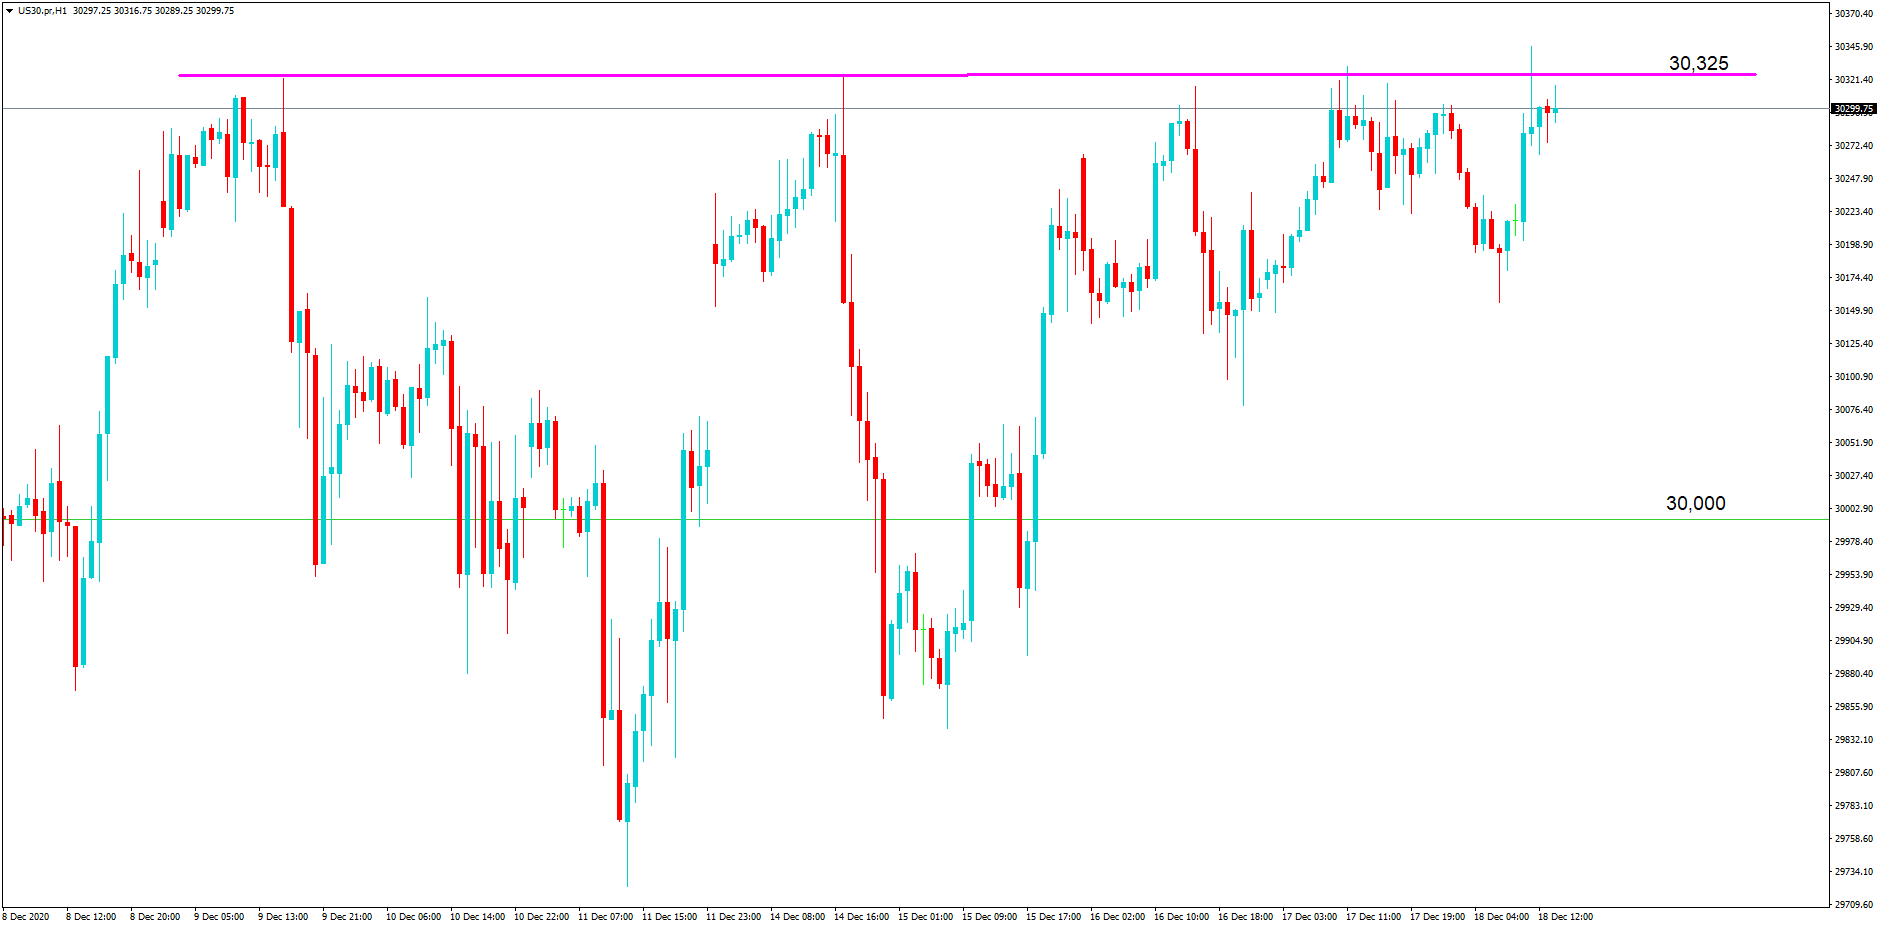
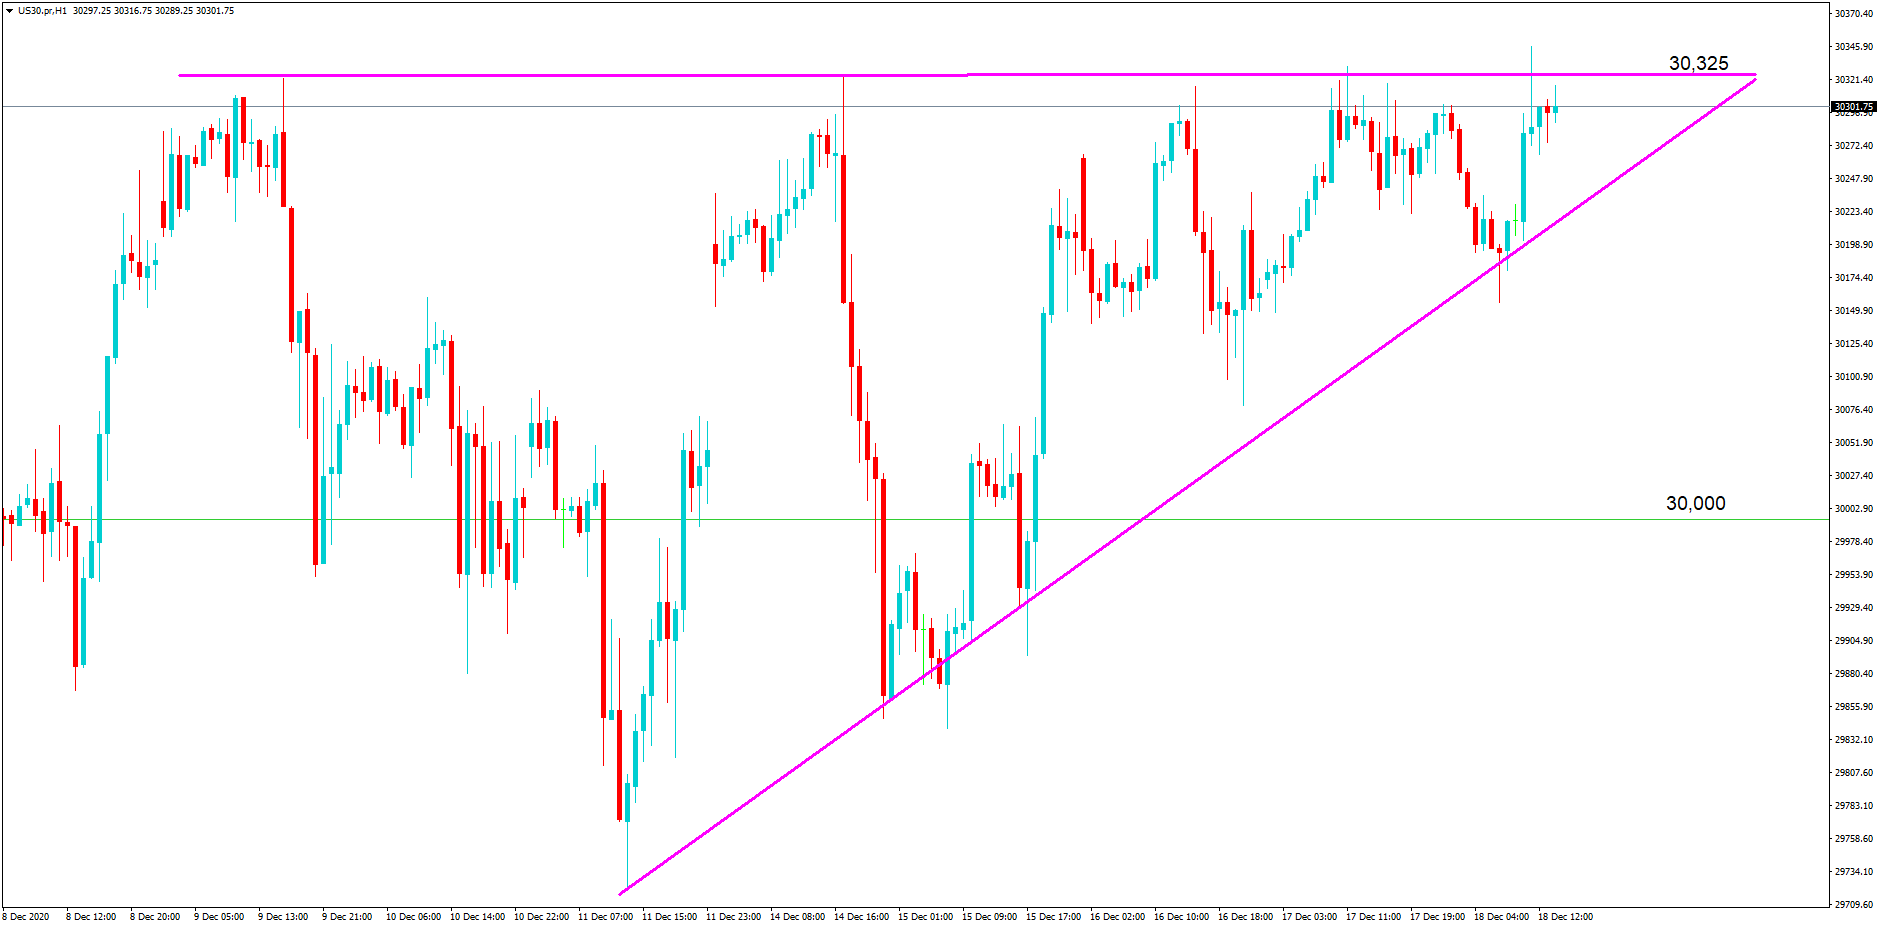
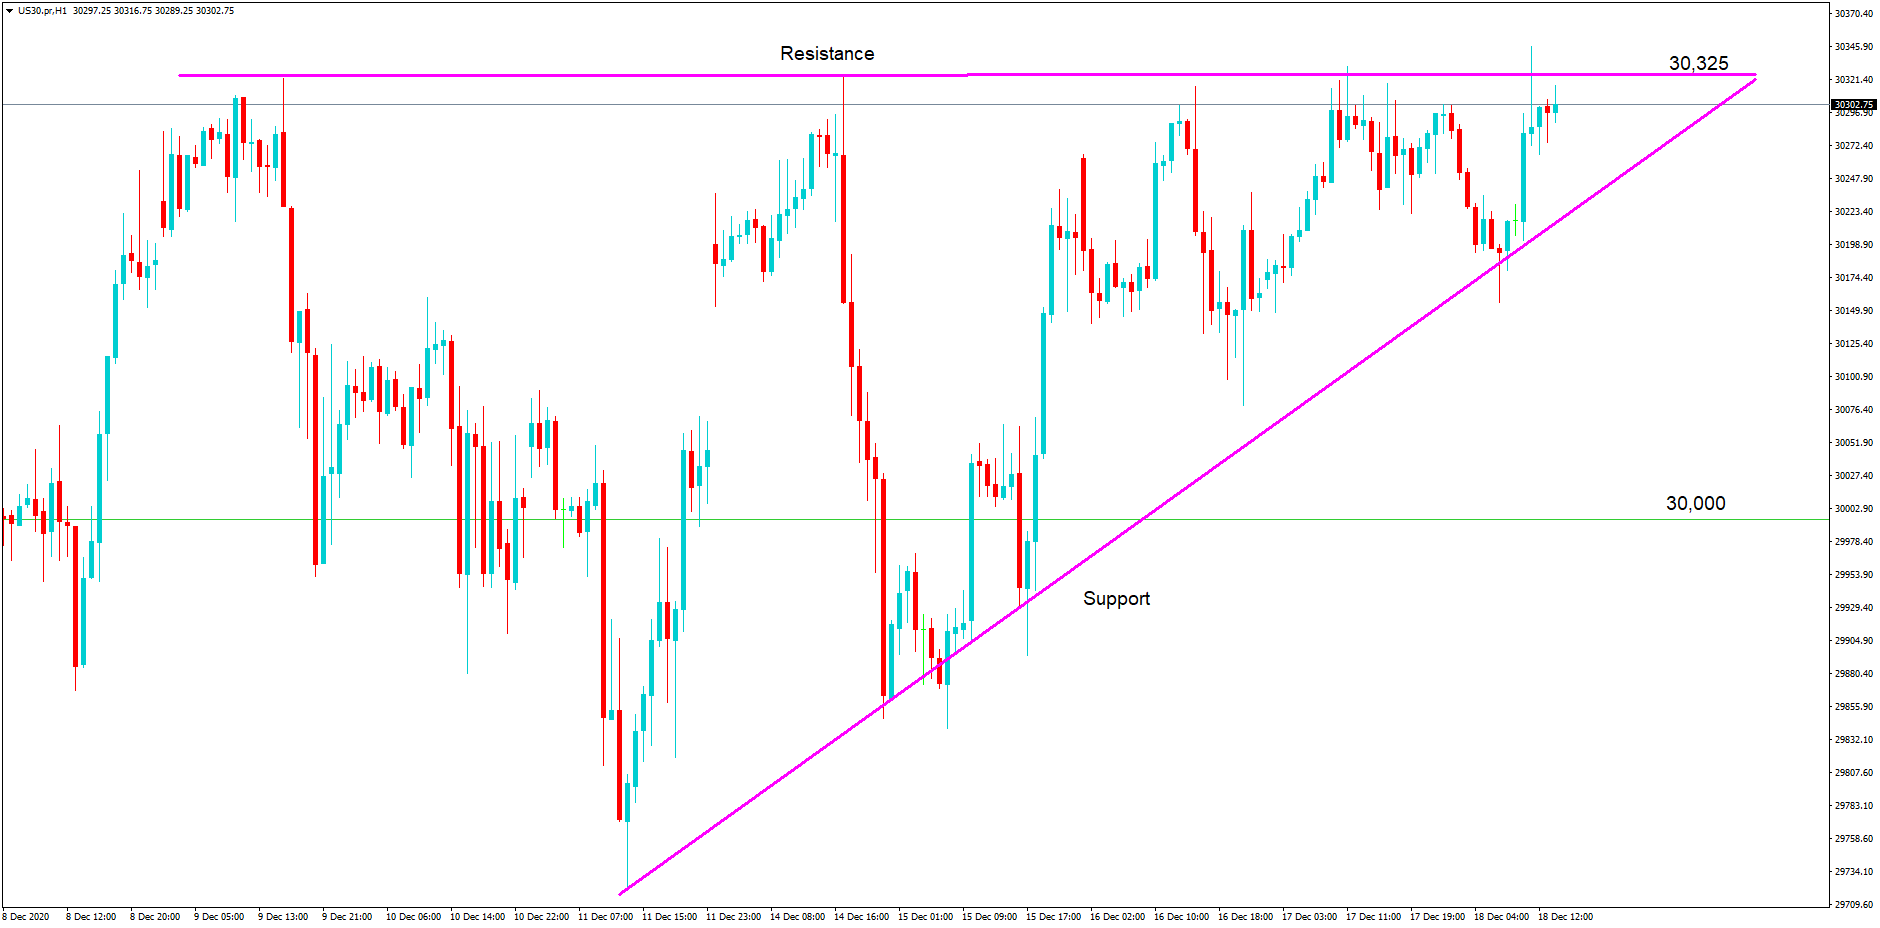
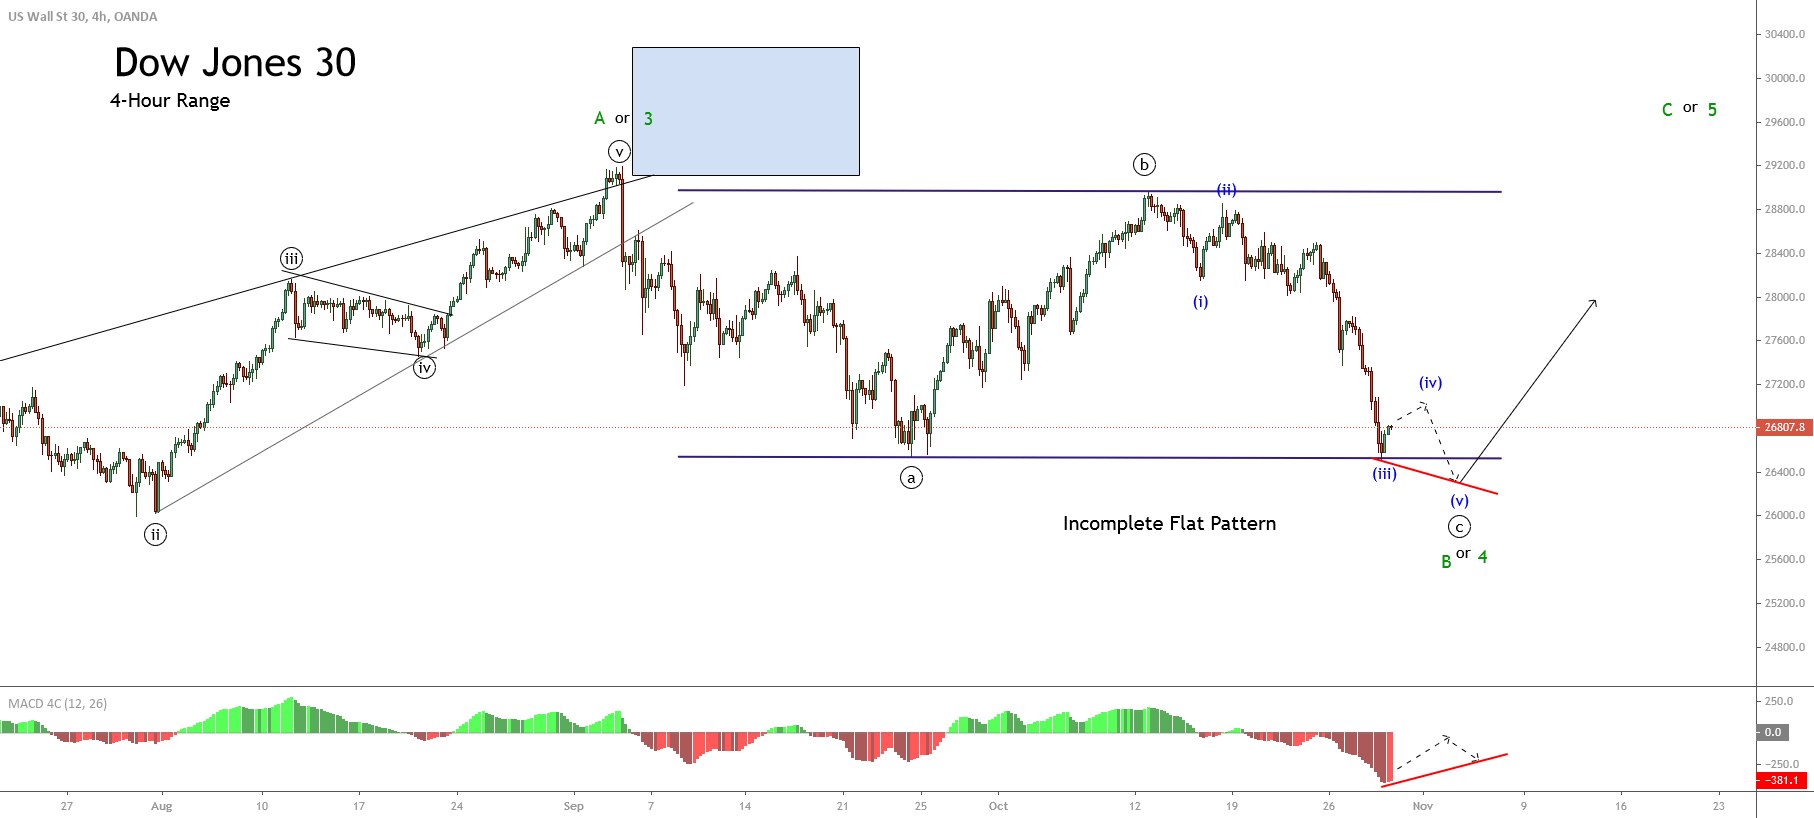
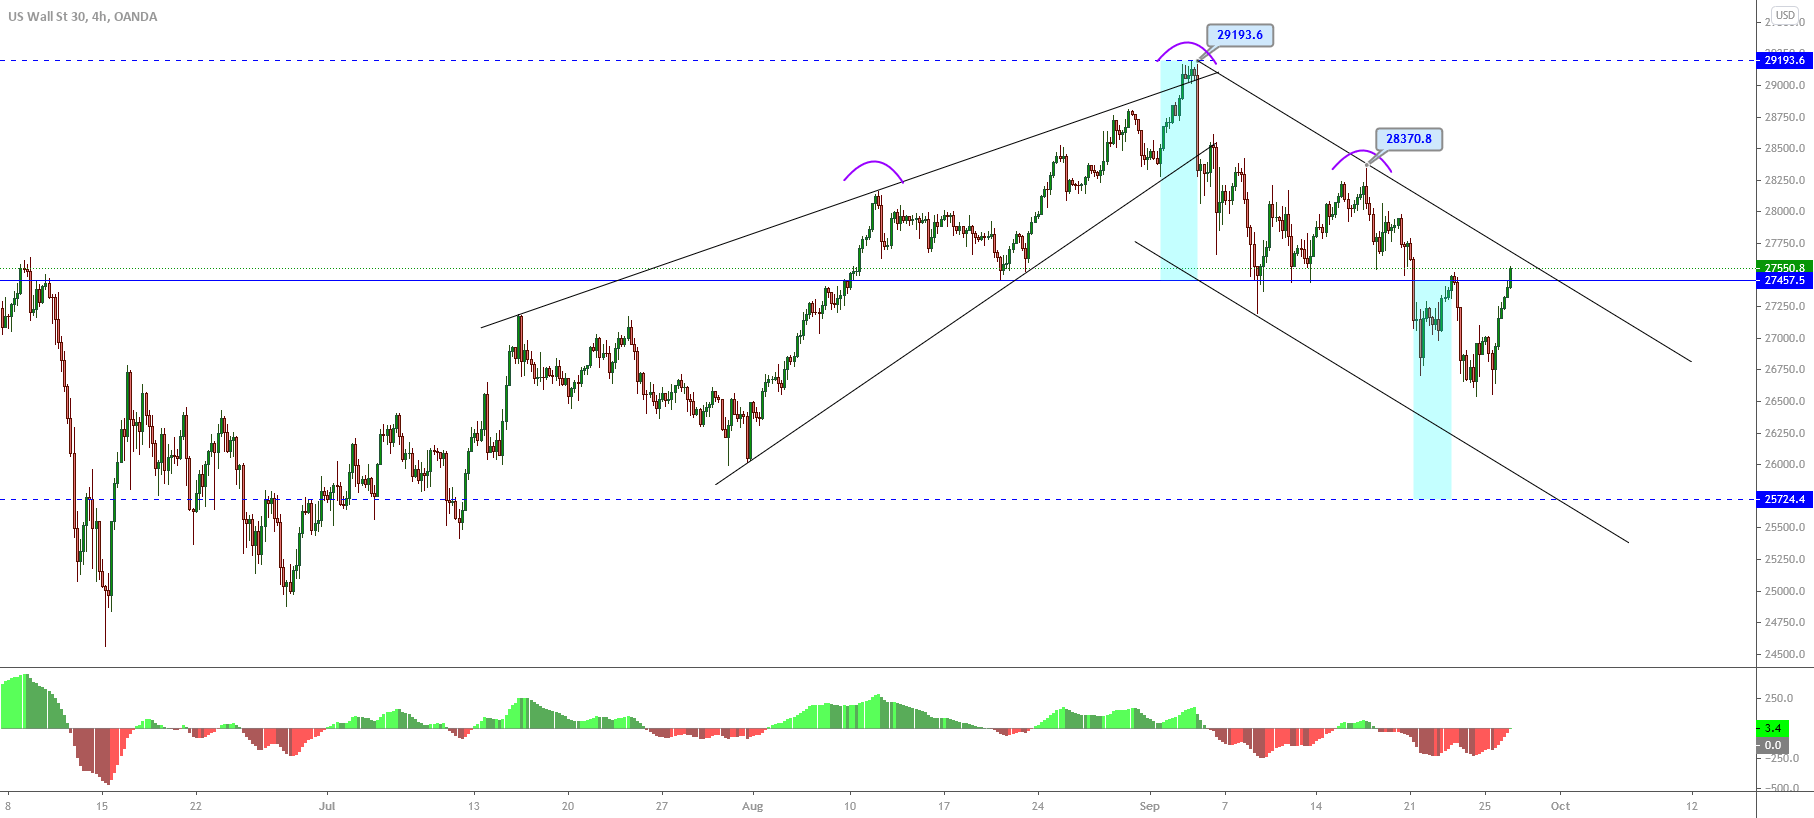
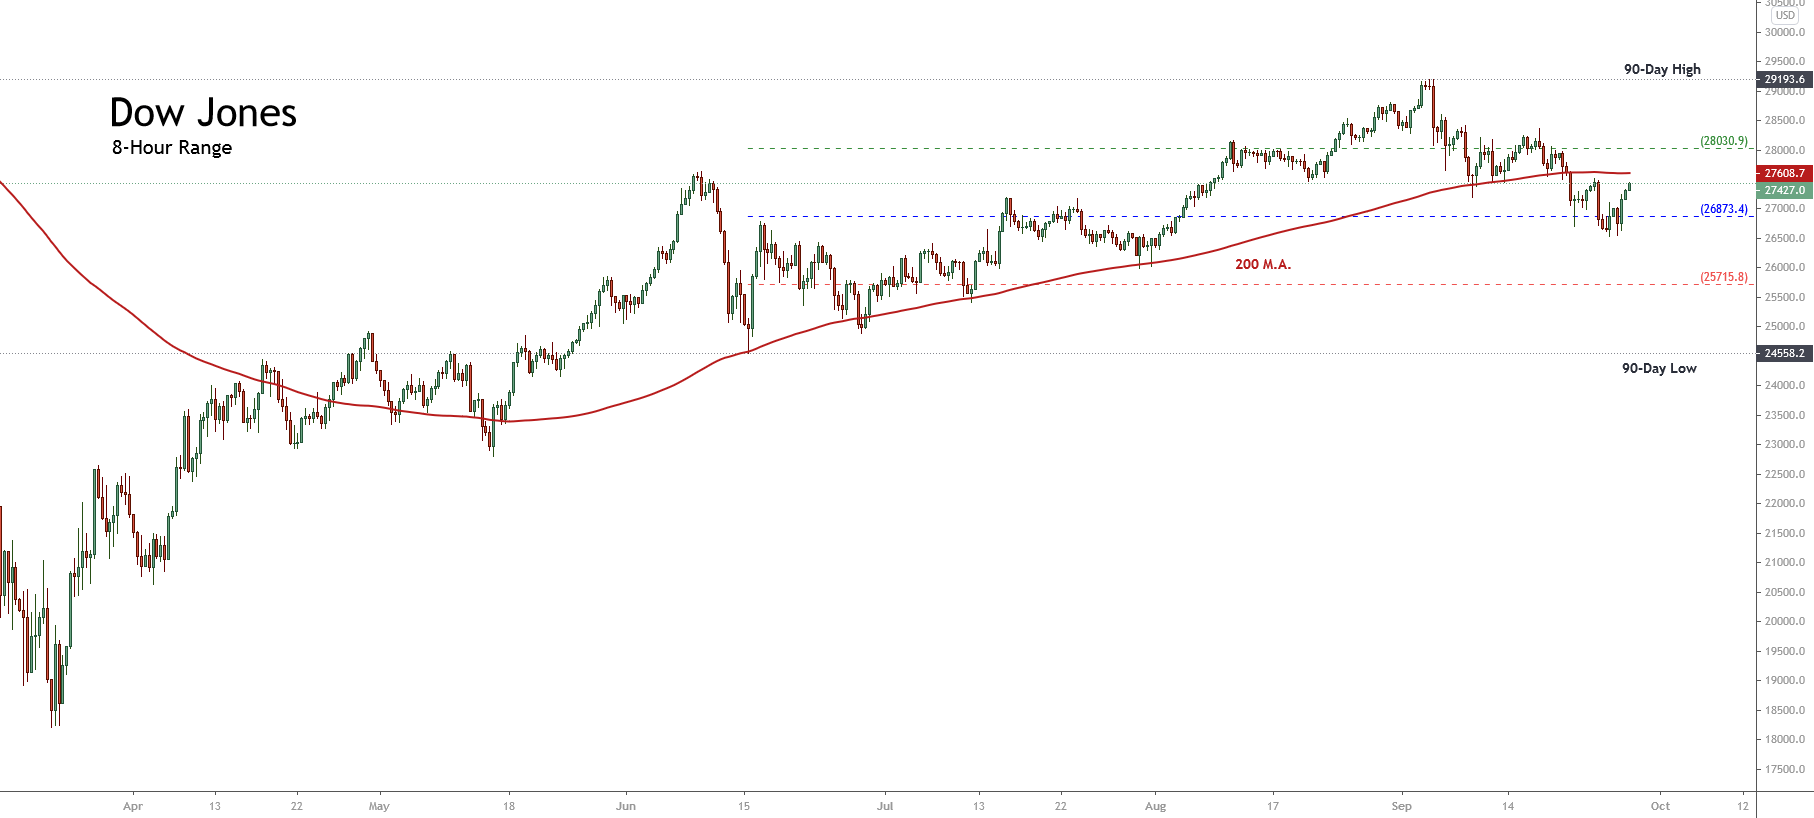
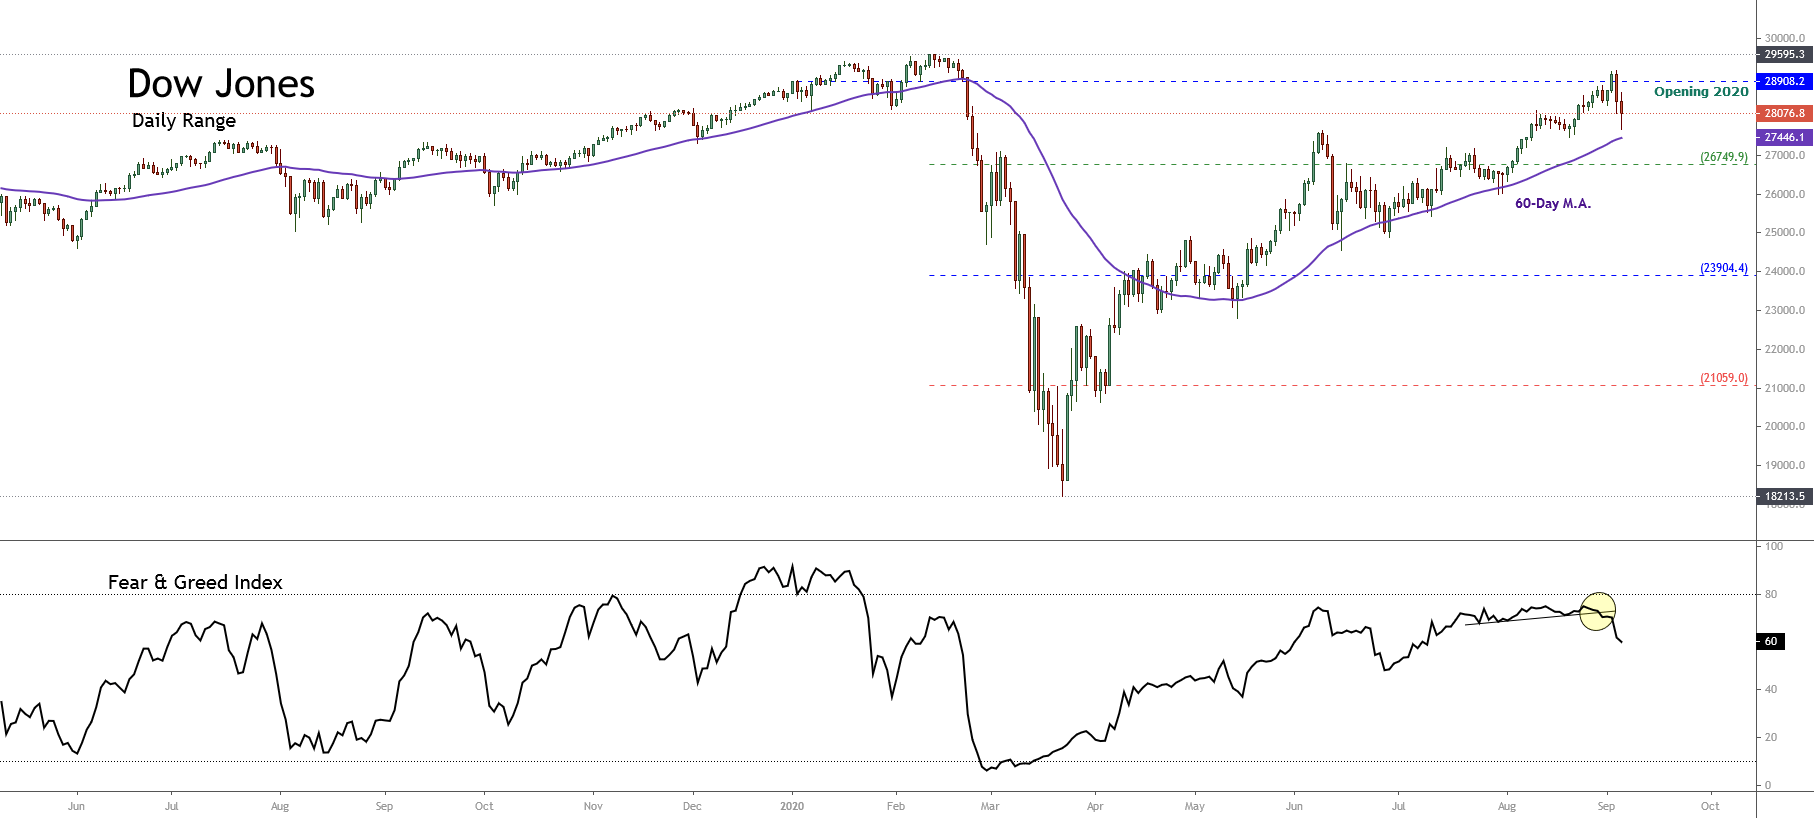
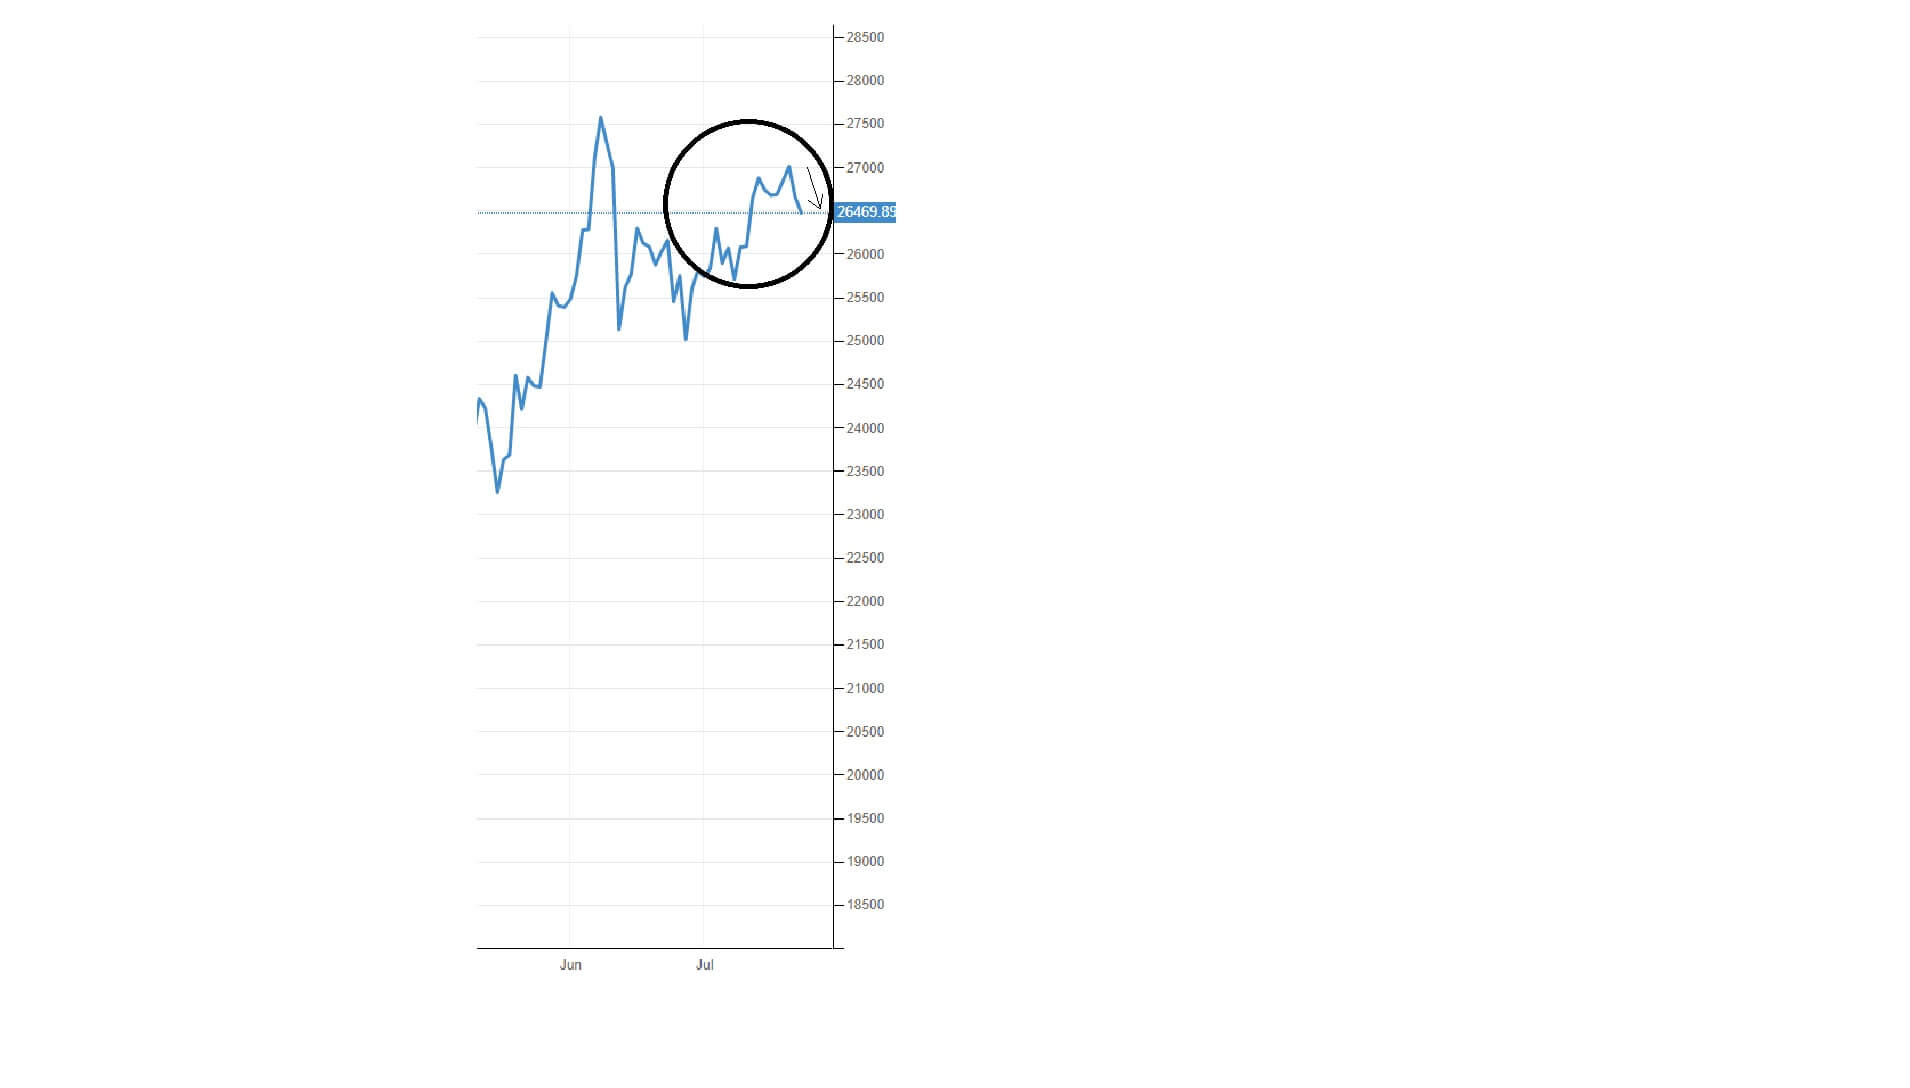
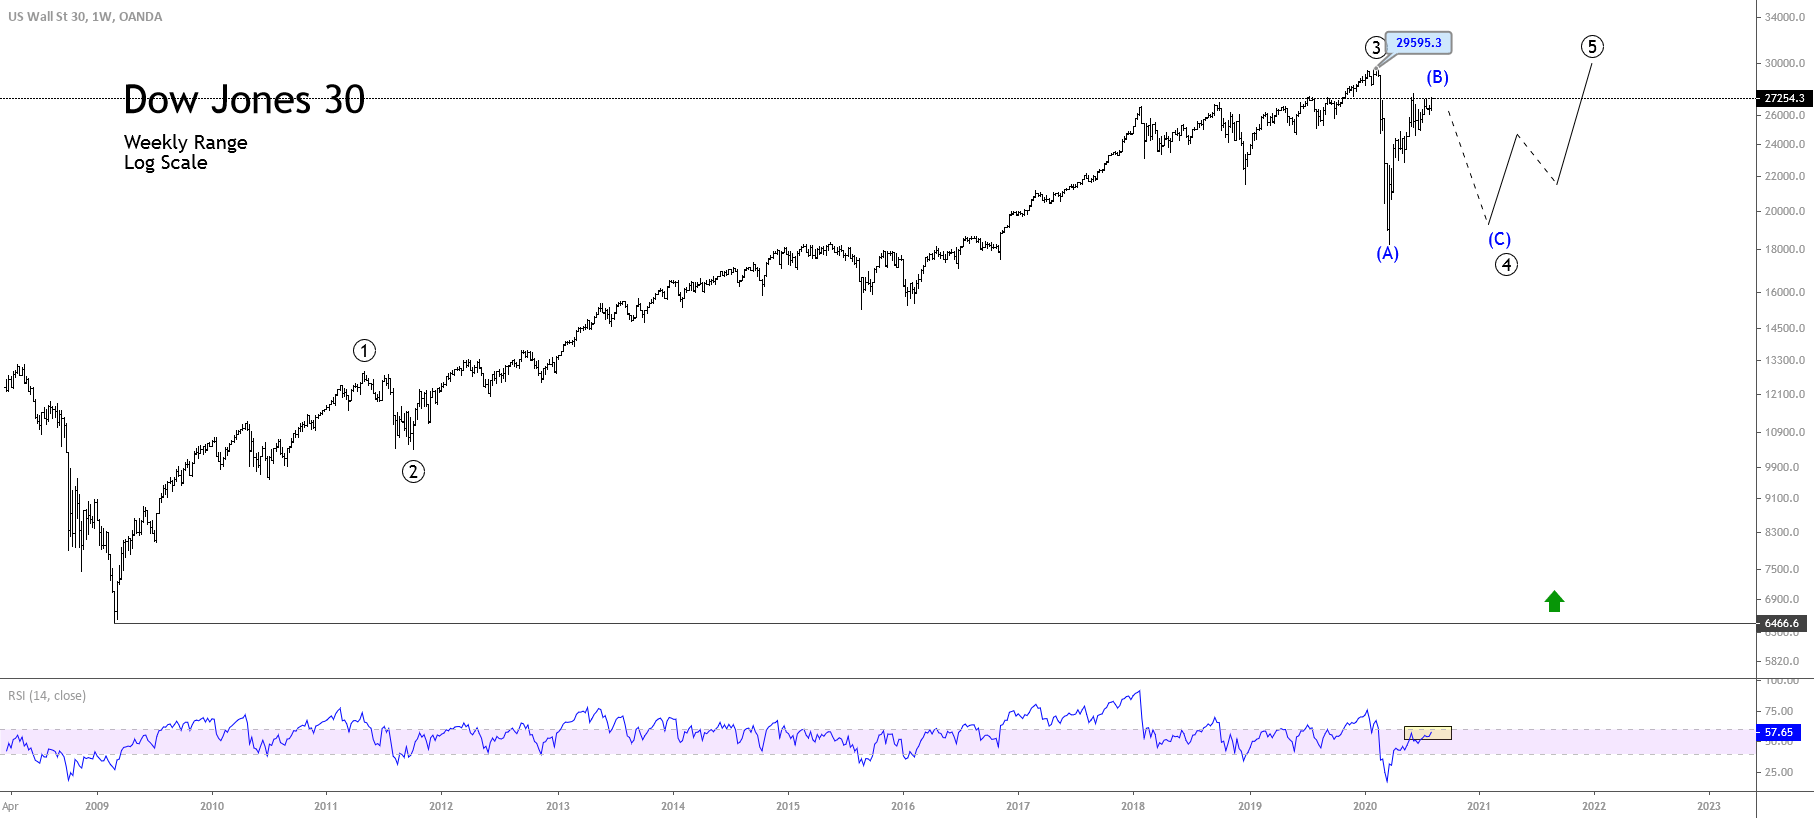
We still have a few days to go and until the inauguration, and then there is the Donald Trump impeachment, which may cause a delay in the democratic party’s policy implementation, and, as shown here on the daily chart for the Dow Jones 30 index, it is still in a confirmed bull trend, in which case traders will be looking for breaches of the support and resistance lines as shown here, while eagerly waiting for any new policy changes by the incoming Democratic administration.

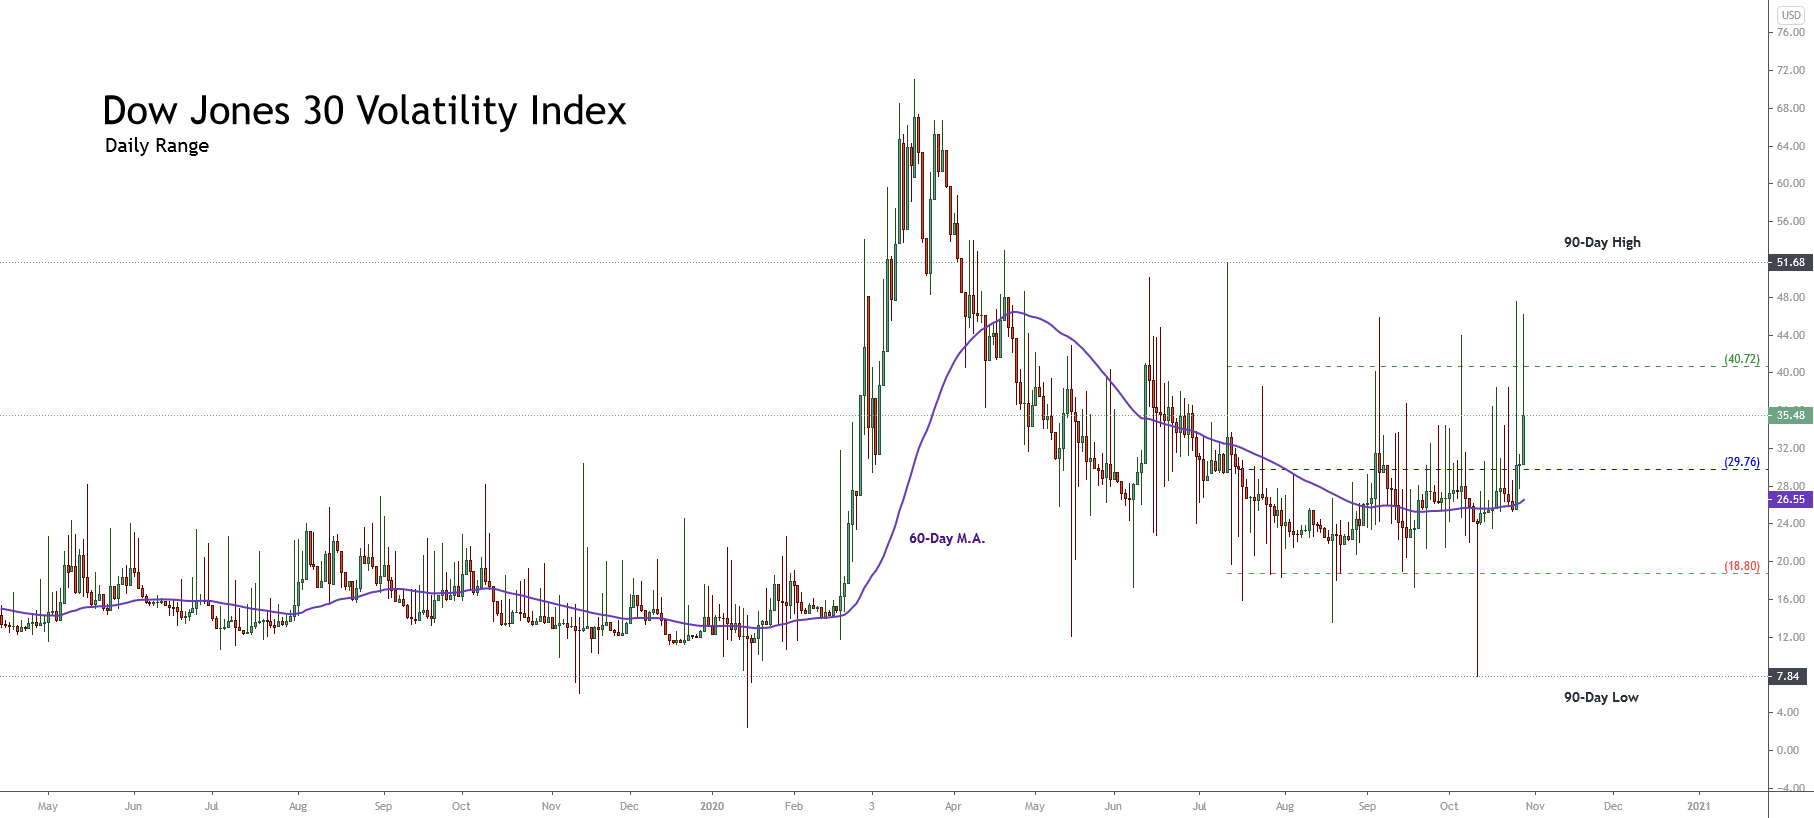
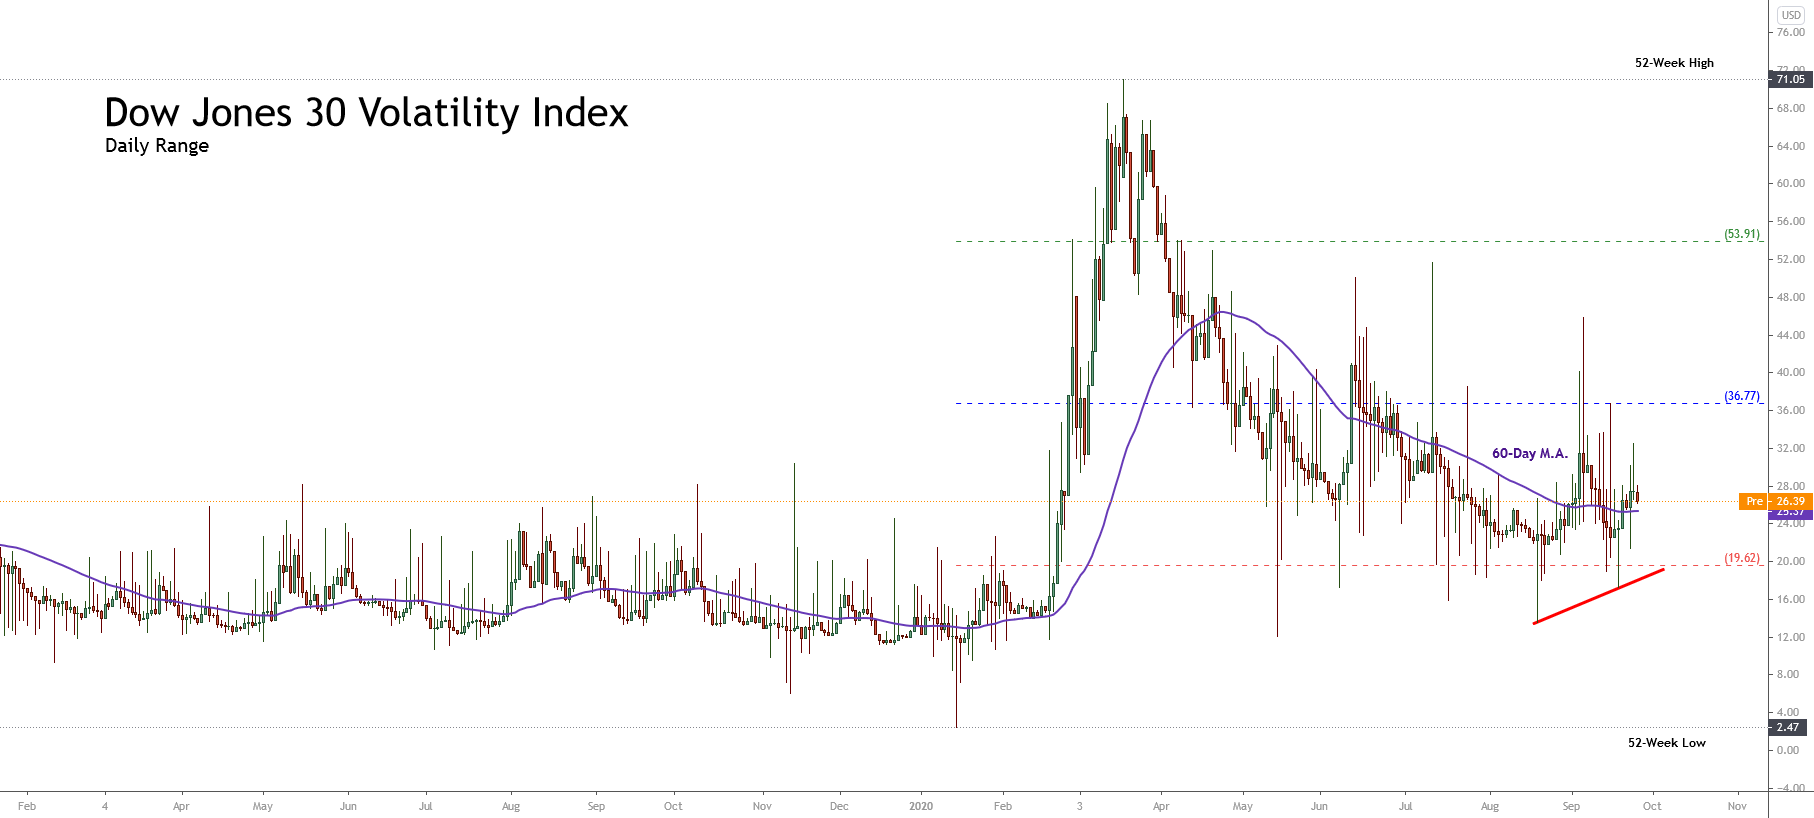
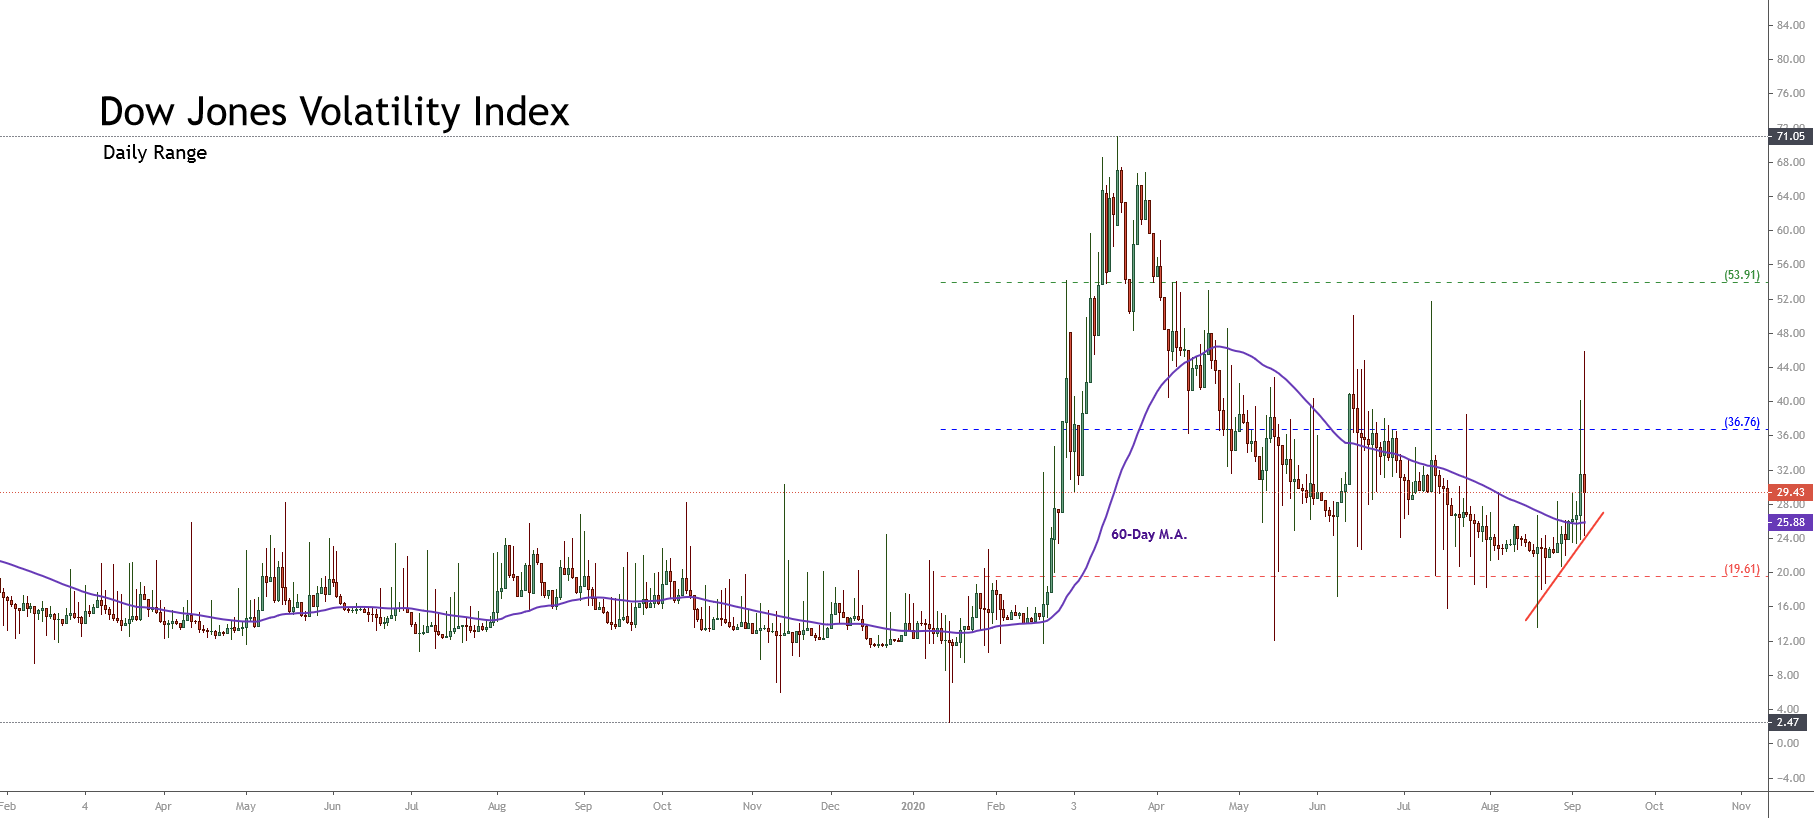
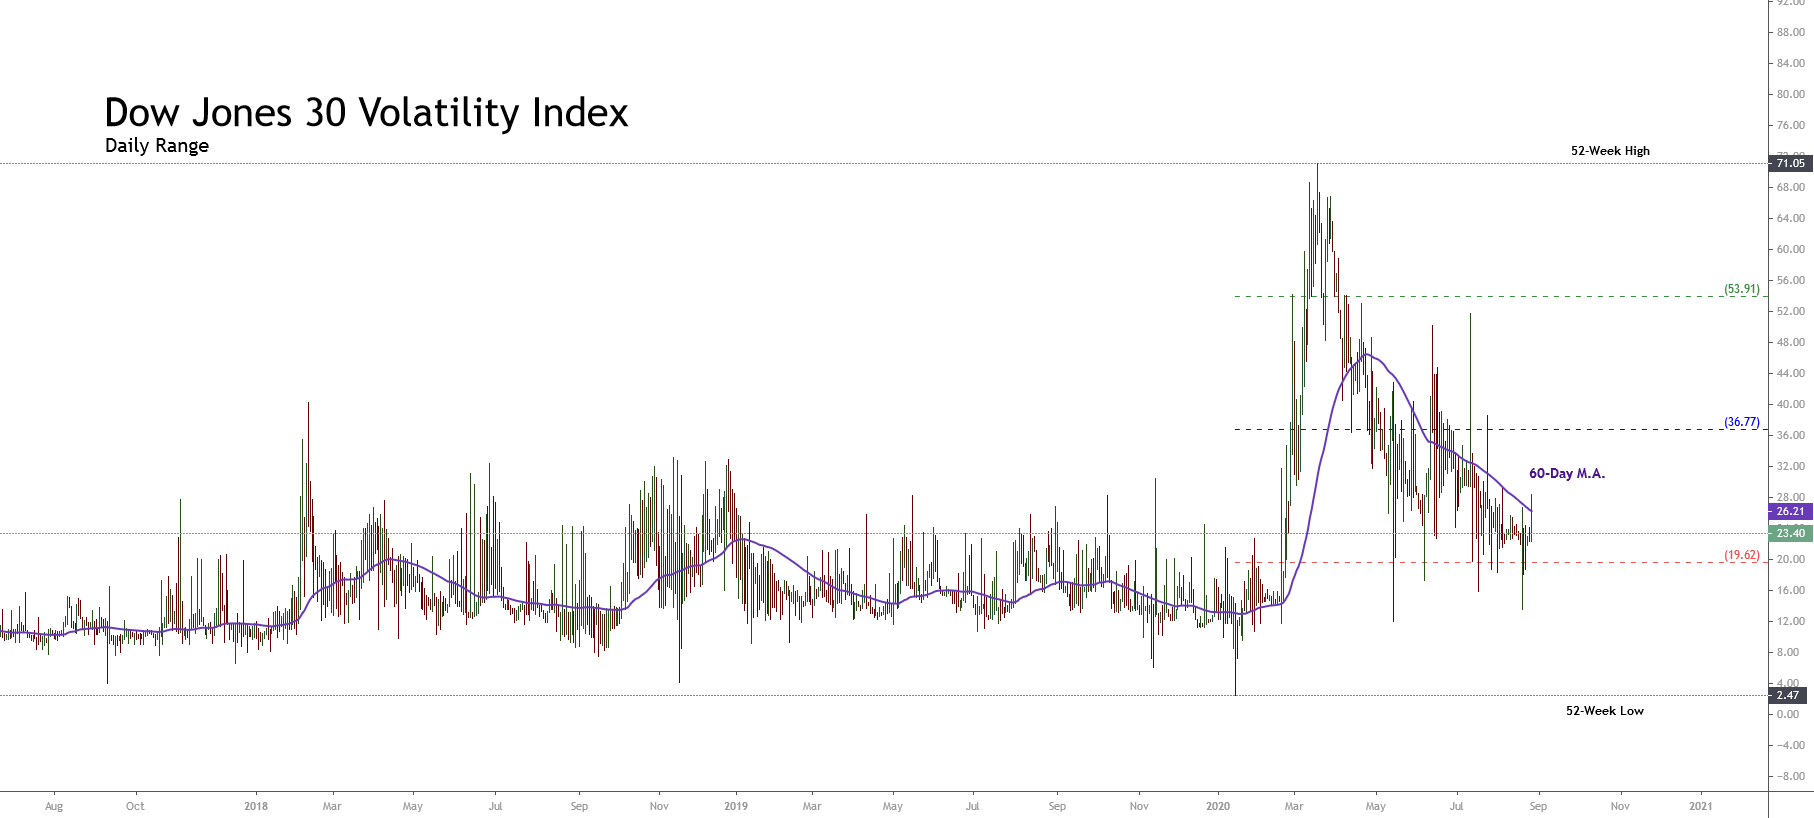
One thing is certain, there will be continued volatility in the financial markets as the fallout from the pandemic continues to cause turbulence and where recent data confirms higher unemployment and less consumer spending in the USA, which are more possible reasons for the fall in the index from its recent high, and worries about the change in government and policies. 

Categories
Forex Videos

This Is Whats Going To Kill The Dow Jones – Upcoming US Political Event!


Upcoming US political event could spell trouble for the Dow Jones Industrial Average Index

Thank you for joining this forex academy educational video.

On January the 5th, the Georgia runoff elections for the United States Senate could prove to be a turbulent affair for US stocks and, in particular, the Dow Jones industrial 30 average.

The Dow Jones industrial average index has had quite an incredible year from it’s high, shown here, of 29,500 in February to its crash of 18,500 during the initial wave of the pandemic to hit the USA in March, and on to a record-breaking high of 30,600 at the time of writing.  Most of the move higher can be attributed to the amount of stimulus which has been put into the US economy and where those dollars are finding their way into the stock market, and where investors are looking beyond the pandemic, where vaccines will help get the US economy back pre-pandemic levels of growth. This is also somewhat buoyed by the federal reserve’s stance on lower interest rates for longer, which also serves to inflate stock markets because corporations can access low-interest rate loans.

The Georgia runoffs are essentially on a knife-edge because they hold the potential to swing the balance of power in the 100 member US senate between the radical difference democrats and republicans. The November election left the republicans holding 50 senate seats and the democrats controlling 48. Only the two remaining seats in Georgia are undecided, and if Joe Biden’s party wins these seats, the balance of power will tilt towards the democrats.

While the US stock markets have largely ignored political events since the pandemic began, the upcoming Georgia elections cannot be ignored for the following reason:  Joe Biden has promised to reverse corporate tax cuts, which were introduced by the Trump administration in 2017.  This puts company earnings at risk.  And while the old style of earnings to share price ratio has largely been ignored by stock market investors during what can only be described as a shift in fundamental analysis concerning how the markets perceive corporate valuations, should Joe Biden win control of both chambers of Congress, he would be in a position to reverse these tax cuts and send a shudder through wall Street.

Investors will be looking to reposition their portfolios in January, as the new year and first quarter got underway, and there are lots of new data to take into consideration, including the ISM manufacturing and services for December, and weekly jobless benefit claims, to consider, plus the November trade deficit and of course the unemployment report for December, which all come out in the first week of January, with the possibility of causing turbulence in US stock markets.

With this political uncertainty and the fact that the Dow Jones is at an all-time historic high, it lends itself nicely for a pullback, at least until the above are all factored into the market. 

Categories
Crypto Videos

Stimulus Hope Is Driving Up The Dow Jones – Should You Buy Or Short it?


Stimulus hopes drive up the Dow Jones – where next? 

Thank you for joining this Forex Academy educational video

In this session, we will be looking at the Dow Jones 30 Industrial Index and looking for indications of the next likely move.

While the United States economy is still reeling from the ongoing Covid situation, which has as a country in its grip, investors are looking long-term, buoyed on by vaccine news and hopes of a speedy back to normal recovery once it has been rolled out to the general population. 

In reality, of course, this may still take over 12 months to implement. Therefore hopes of the recovery are fuelled by my hopes that the American government will continue to support individuals and companies via a Covid-19 relief aid stimulus to help unemployed and financial relief for other individuals and those who need it.

This has been stifled somewhat by the fact that the discussions between the democrats and republicans have not yet been able to agree on how much money the state should put up. Current estimations are that a $900 billion stimulus bill may include checks for $600 for eligible adults and their independents. 

Some Republicans have asked for hand-outs of $1,200 per individual and $2400 per couple, with $500 going to children, to support families through this critical time.

The plan is that the 900 billion stimulus package will be the first of two parts, with phase one considered as an emergency relief bill, and phase two will kick in during the early part of January 2021, once that has been agreed on.

It is talk of the stimulus package, which has been keeping the Dow Jones at record highs.

This is a daily chart of the Dow Jones 30 industrial index.  We can see that since March 2020, the general trend has been a bull trend to the upside, following on from the earlier crash as the pandemic took hold in early February. The technical line numbered 1 shows the general upward trend as hopes of a V-shaped recovery fuelled investor to buy the index.

More recently, talks of an emergency stimulus package, and especially during November where investors believed a deal was imminent, saw price action move higher from this average and particularly where we see the bullish bounce from the line where we see a steady rise up to the record-breaking 30,000 level at position A. 

Talks of the stimulus package went to and fro between the democrats and republicans, with concerns of the, will they or won’t they agree on a package and where price action moved lower to the trend line at position 2, while talks stalled, and where price action itself bounced this higher trend line, marked as 2, back up at position B C  and D in an overall bias squeeze to the upside, where price continued to flirt with 30,000 and eventually where there was a significant close and open above this key level.

In this 1-hour chart, we can see that price action is seeing resistance at around 30,300.

And by adding this support line, we now have rising wedge formation clearly evident, where price action is fading to the upside, with a potential break above the 30,300 level. Should this immanent covid relief bill be agreed upon, price action could punch higher and continue with potential for the 30,300 level to become a support line and a possible move higher by 200 or 300 points.

There is so much pressure on the American government right now to come up with an agreed amount of stimulus for those who need it that it is almost impossible that nothing will happen. This is what is driving the Dow Jones Index and other US indices higher at the moment.


Categories
Forex Market Analysis

Dow Jones Turns Bearish As the US Presidential Election Approaches

Overview

The Dow Jones Industrial Average holds its bearish bias expecting the US presidential election scheduled next November 03rd. Throughout this year, the Industrial Average has declined over 6% (YTD). Although the latest decline looks like a short-term top, the US leading benchmark could resume its advances.

Market Sentiment Overview

The Dow Jones Industrial Average (DJIA) accelerated its declines on Wednesday’s trading session, backed by the market participants’ expectations before the US presidential election scheduled next November 03rd.

The following daily chart exposes the short-term market movements of the Industrial Average. The figure shows the penetration below the psychological level of 27,035.1 pts, which indicates the Dow Jones penetrating the bearish sentiment zone.

Simultaneously, the price action reveals its consolidation below the 60-day weighted moving average, which confirms the bearish bias. On the other hand, the re-test of the previous low located at 26,541 pts increases the likelihood of further declines.

The next daily chart unveils the 90-day high-low range of the Dow Jones Volatility Index (VXD). The figure shows the advance of VXD in the bullish sentiment zone, which confirms the bearish sentiment observed in the Industrial Average, as an increasing (bullish) volatility is mostly associated with declining prices.

Therefore, considering both the Industrial Average as the Dow Jones Volatility Index, the short-term market sentiment bias for the DJ-30 remains on the bearish side. The likelihood of extended declines would drive the DJIA toward the extreme bearish sentiment zone.

Technical Analysis Outlook

The big picture of the Industrial Average reveals that the retracement experienced during the last two weeks belongs to the bullish sequence that began on March 23rd when the Dow started its recovery, following the massive mid-February sell-off.

The DJIA’s technical outlook under the Elliott Wave Theory is unveiled in the following log-scale daily chart. We can see that the primary bullish trend that began with March 23rd’s low located at 18,213.5 pts, which is currently in progress.

In the figure, we see DJIA’s price consolidating in a sideways formation. This stage began once the Industrial Average topped at 29,193.6 pts on September 03rd.

On the other hand, we should consider that the sideways formation moves above the 25,570.2 level, or 33% of the bullish sequence of the primary trend. Therefore, the upward trend remains intact right now, and the current correction represents a pause and not a deeper correction for the US benchmark.

The below 4-hour chart shows the Industrial Average under the Elliott Wave perspective, developing an incomplete flat pattern (3-3-5) of Minute degree labeled in black that looks incomplete.

Currently, Dow Jones completed its wave (iii) of Minuette degree labeled in blue, which belongs to wave ((c)) of Minute degree. This structural series that remains in progress moves inside the wave B or 4 of Minor degree labeled in green.

Considering that the flat pattern looks incomplete, the Industrial Average should see a new lower low, which would reveal a bullish divergence on the MACD oscillator confirming the progress on the fifth wave of Minuette degree. After this move, the Dow Jones should develop a wave C or 5 of Minor degree with an internal five-wave sequence.

Therefore, short-term, we may expect a limited decline, likely toward the 26,050 pts, from where Dow Jones could start to develop a new rally in five waves.

Categories
Forex Market

Covid-19 and Dow Jones: Market Collapse and Prospects

The coronavirus epidemic appeared in January 2020, but markets reacted with a collapse only at the end of February. Until then, the epidemic once widespread in China was considered local. But after the emergence of an outbreak in Italy and many other new cases in Europe, it ended the patience of traders. If we look at the context of a profound fall in production, and a break in economic ties and, Dow Jones lost more than 20% in just 3 weeks. Has the fund been reached yet? Is the coronavirus so terrible? What are the Dow Jones’ prospects for the future? Let’s try to answer the questions raised in this article.

Dow Jones Crash: Stock Market Crash Due to Coronavirus Panic

From February 21 to March 12, in just under 3 weeks, Dow Jones has lost more than 20%, plummeting from an all-time high of 29551-29219 to 23553. During the last week of February, the world market lost 5 trillion dollars. In capitalization, the US stock market lost 1.7 trillion US dollars. Financial Times rated the first week of panic as the worst since the 2008 crisis.

Dow Jones and Coronavirus: Overview of Events

Finally, an imminent coronavirus epidemic was discussed in January this year, when China began to record a truly dramatic increase in the number of people infected. The epidemic partially affected several countries in Asia, but US stock markets did not respond to this, and on February 18, Dow Jones updated its record high to 29,551. Investors felt that the epidemic was local, not dangerous, and would soon be taken under control.

Expectations for a quick solution to the epidemic were not met. On 21 February, the Italian authorities reported the first six cases, the following day there were 50. This was enough, and investors immediately withdrew their capital from all world markets for fear of the further spread of coronavirus. The mass-selling panic continued during the following week.

“Misfortunes never come alone.”

At the end of February, it was hoped that the would almost reach and the thaw would begin. At that time, according to WHO, the number of new cases recorded daily was decreasing, and markets took the news positively. In early March, Dow Jones even climbed a bit. And perhaps the upward movement could continue, were it not for the dispute between OPEC and Russia.

Another OPEC meeting was held from 4 to 6 March, where it was decided to extend the agreement ending on 1 April to reduce oil production. There is no clear justification for why Russia flatly refused to extend the agreement, but more events took place as follows:

Saudi Arabia, interested in maintaining the agreement, practically declared a price war. Saudi Aramco Corporation was instructed to offer customers record discounts (6-8 dollars per barrel). As of April 1, Riyadh will dramatically increase oil production from 9.6 million to 10, 11, and 12 million barrels per day.

There is information indicating that Russia will seek to remove US oil shale production from the market, as it ceases to be profitable when the price of oil is less than USD 40. There were also vague indications in the Russian media recently that the rouble should weaken slightly. In other words, this scenario was predictable.

On March 9, many quotes from several markets, including Dow Jones, showed another record decline. On that same day, the Dow Jones dropped 7.79% in just one day, reaching a minimum of 52 weeks. The most stable stocks were those of Walmart Inc (-0.06%), Virizon Communications Inc (-1.83%), Pfizer Inc (-3.60%). The shares of Dow Inc (-21.66%), Chevron Corp (-15.37%), Caterpillar Inc (-14.28%) fell more than all.

What Steps Should Investors Take Now?

The current situation with the expansion of coronavirus in Europe is still quite tense today. According to WHO statements, in Europe cases are increasing. Italy remains the country most affected at the moment. On March 10, the country registered around 1000 new cases of the disease and 168 deaths, the country is now under lock and key. Ukraine, Poland, the Czech Republic are entering quarantine. Cases of the disease have already been reported in Turkey, Georgia, Bolivia, Panama, and Jamaica. Analysts believe that in developing countries (e.g., CIS), statistics could be even sadder because, for various reasons, coronavirus cases can be diagnosed as regular flu or simply hidden.

But not everything is so bad. China has officially declared that the coronavirus epidemic is fading in the country. The growth rate of the disease in recent days is 0.023%, the number of new cases of coronavirus is 10.03, 74% of those infected have already recovered, 16 temporary hospitals have been closed.

Although WHO has described the outbreak of coronavirus as a pandemic, the organization admits that the common flu occurs every year and that between 40 and 45 million people are infected, 600,000-650,000 of them die from the flu or its complications. WHO fights with new types of viruses every year, however, this does not result in such a dramatic collapse of markets, panic, and quarantine.

Based on the above, there are certain unknowns:

Who will benefit from the coronavirus-fueled panic? Corporations lose billions, transport communications (logistics, tourism) are interrupted, production volume decreases. But, if the coronavirus mortality rate is 3.4% (WHO data), and the flu/pneumonia mortality rate is 7.1% (CDC data, USA), could the problem be exaggerated? Although statistical data can be skilfully manipulated, only the coronavirus can be compared with influenza or tuberculosis.

Is the coronavirus the most important reason for the Dow Jones accident? Was the pandemic just a trigger? Could it be the last straw in the US stock market that had been pushed extremely hard before?
The solution to these unknowns will give us a clue about the future of the global stock market, including Dow Jones.

This looks like this:

Optimistic: It took China two months to fight the epidemic. The coronavirus is at its peak in Europe, so the situation will be uncertain for at least a month. During this time, the Dow Jones can lose another 10% or more in a panic and drop to 2018 levels. Given the performance of the index in recent years, things are not so bad.

WHO officials point out that the epidemic in China may have begun to decline due to warming, as the virus is supposed to die at high temperatures. The world community should therefore begin to calm down as early as May. Meanwhile, Russia and Saudi Arabia should agree on oil prices (no one benefits from current oil prices), so another problem of geopolitical and trade uncertainty will be solved. The US shares that reached the bottom in May should roll back to historic highs again, amid optimism, the resumption of trading and economic activities, and increased business activity. Although the shares will barely cover the losses quickly, investors, having entered long positions at the lows, will be able to earn 15-20% from Dow Jones alone.

Pessimistic: Panic in the midst of the coronavirus pandemic will fade, yet it will be remembered for a long time. Despite the injection of cash from central banks, the global community will not quickly restore the previous pace of economic growth. That’s why stock markets will recover very slowly if they do. Dow Jones’ situation is even more complicated. Analysts predict that the US stock market is overheated. According to wave theory, a long-term crisis should now begin. And if at the end of February the recession could be called local, there is now a bearish trend. The bearish trend could be strengthened in the midst of the US presidential election this fall. At best, Dow Jones will shrink further and consolidate at the bottom until the end of the year. In the most tragic scenario, the situation in 2008 can be repeated.

Categories
Forex Market Analysis

Dow Jones Moves Under Bearish Signals

Overview

The Dow Jones Industrial Average is developing a descending sequence that could drive the price to new lower lows. This bearish context occurs in the middle of the US presidential elections campaign, which will take place on November 03rd.

Market Sentiment Overview

The United States benchmark, led by the Dow Jones index, appears to be preparing for the presidential elections on November 3.

The short-term market sentiment exposed in the following 8-hour chart illustrates the price shift below the 200-day weighted moving average, which has turned from support to the next short-term resistance to struggle with.

On the other hand, we observe the 90-day high and low range, where the Industrial Average Index has found support in the neutral zone at over the 26,700 pts, where it bounced, being traded slightly bullish during the last Friday 25th session. This context, added to the shifting movement of the price and against its 200-day moving average, leads us to suspect that the Dow Jones Index could see a further drop within the next few sessions.

Concerning the volatility associated with the Industrial Average, expressed by the Dow Jones Volatility Index (VXD) on its daily chart, we distinguish that the action consolidates above the 60-day moving average. Likewise, VXD shows an increasing sequence of short-term lows, which provides a chance of a new bullish movement of the VXD in the short term.

In consequence, the market context leads us to expect a potential bearish movement for the Industrial Average. However, this scenario still needs to be confirmed by the price action.

Technical Analysis Outlook

From a technical analysis perspective, the Dow Jones Index in its 4-hour chart is showing a descending sequence that began once the price found resistance at 29,193.6 pts on September 03rd. Once the Industrial Average found fresh sellers, the downward pressure drove the price to a retracement till the 26,541 level, where the leading US benchmark found support and began to bounce back to the current trading levels.

On the other hand, in the previous figure, we distinguish the progress of a head and shoulders pattern, which has its neckline at the level of 27,457.5. The bearish breakdown developed during the September 21st trading session, and its subsequent pullback confirmed the bearish signal in the Industrial Average. In this regard, according to the head and shoulder pattern definition, this trend reversal formation has a pending bearish target located at 25,724 pts.

Similarly, if the price confirms a new lower high under the previous peak at 28,370.8 pts, it would confirm a bearish continuation pattern identified as three descending peaks, which would support the bearish scenario for Dow Jones.

In conclusion, our short-term perspective is mainly bearish as long as the price remains below 28,370.8 pts, with a bearish target established at 25,724 pts. The invalidation of our bearish scenario will occur if the Industrial Average consolidates above 28,370.8 pts.


Categories
Forex Videos

Where Next for the Dow Jones US Elections In sight!

Where Next for the Dow Jones? US Elections in sight.


Thank you for joining this forex academy educational video. In this session, we will be looking at the Dow Jones 30 industrial average index.

In this chart, we can see price action going back to the 15th of July why where the index was at 24,659 and where it had since rallied to 27,889, which is quite staggering when you realize that’s the record high before the coronavirus was just above 29,000, and where the United States is still in the grip of the covid pandemic and where businesses are suffering badly and where unemployment is still at historic highs not seen since the second world war.

And yet the Dow Jones stock markets, one of the benchmark indices in the United States, is flying in the face of fundamental analysis, and indeed common sense, and is rallying to the upside almost at a record-breaking pace. Market analysts, traders, and leading names in the stock markets investing arena have been suggesting that the Dow Jones would collapse down to the levels we witnessed in march where the index was at 18,200: A total collapse from the high of a few weeks previously.

And while the index causes for a breather before the next push in either direction, traders will now be in to focus on the United States elections in a few week’s time, And where Republican Donald Trump is not doing well in the ratings due to his handling of the Covid virus within the USA, and where it was commonly believed that Donald trump’s policies on low taxation and less regulation, and a push for lower interest rates were of great benefit to American corporations, thus pushing the Dow Jones to the highs we saw before the virus pandemic. The US stock market loved Donald Trump. It is now believed that the Democrat opposition, Joe Biden, may sweep to a November election victory and that if this happens, many of Donald trump’s policies, including taxation, would be reversed.


Therefore, we should presume that if Joe Biden won the election and the democrats reversed Donald trump’s policies that the American stock market, including the Dow Jones 30 industrial average index, would suffer and where analysts predict a 20% fall on the basis that Biden reverse Trumps’ policies and would likely increase capital gains tax to as high as 39% for upper-income individuals, bearing in mind that it is the higher earners that tend to buy more stocks.

In times gone past when the biggest factor to determine the value of stocks was companies earnings, it would appear that this no longer matters, fundamentals have gone out of the window, and where if an incredibly disruptive and economically devastating pandemic cannot crush the Dow Jones industrial average, we should in fact not be at all surprised that not even an election defeat for Donald Trump will necessarily mean a collapse in the Dow Jones index. In fact, if the market is purely driven by trend, which it appears to be, we could see the previous highs breached. Sellers beware.


Categories
Forex Market Analysis

Dow Jones Declines Below an Ending Diagonal Pattern

Overview

The Dow Jones Industrial Average stopped its progress that started on the March 23rd’s low at 18,213.5 pts, from which it proceeded toward the 29,193.6 pts, reached on September 03rd. This movement made it recover its yearly losses that happened in the first quarter of 2020. The latest decline observed following the ending-diagonal breakdown leads us to warn about a likely bearish scenario.

Market Sentiment Overview

The Dow Jones Industrial Average stopped its advance from the mentioned recovery in our previous analysis. In our previous outlook, we commented about the divergence between the S&P 500 and the Industrial Average, which still did not reach a fresh record high as the S&P 500 did. As the following figure illustrates, the divergence observed between the two U.S. indices drives us to the conclusion that the last all-time high reached by the S&P 500 remains without confirmation by the Dow Jones. This situation carries us to expect the exhaustion of the current stock market recovery.


The next chart illustrates the Industrial Average in its daily timeframe. In the figure, we distinguish the market action moving on an extreme bullish sentiment zone, confirmed by its price action above the 60-day moving average. However, the latest sell-off negated the strike of the opening 2020 price easing near to 1.75% (YTD).

The breakdown observed in the Fear and Greed Index highlighted in yellow, signal the decline of the bullish sentiment prevailing during the previous stock market sessions. This reading adds to the context observed in the Dow Jones Volatility Index daily chart, which remains well in the bearish sentiment zone – above the 60-day moving average. This leads us to suspect that the recovery observed in the stock market is ending.

In consequence, from a market sentiment perspective, our position for the Dow Jones changes from bullish to neutral expecting the bullish continuation or bearish reversal confirmation.

Elliott Wave Outlook

Under the mid-term Elliott Wave perspective, the Industrial Average in its 4-hour chart reveals the completion on September 03rd of the fifth wave of Minuette degree labeled in blue, as the price topped at 29,193.6 pts., where Dow Jones found fresh sellers.

The last Dow Jones rally observed in the previous chart, developed in five waves, illustrates an ending diagonal pattern, which, after the price broke and closed below the line (ii)-((iv), dropped until the wave (iii) in blue. This movement leads us to expect further corrections in the U.S. stock market.

Simultaneously, the completion of the wave ((c)) of Minute degree in black and wave B of Minor degree in green points us to anticipate the development of a regular flat pattern, which follows a 3-3-5 structural sequence. In this context, Dow Jones might start to develop a new decline into five waves.

Finally, our central perspective for the Industrial Average remains neutral, expecting additional confirmation signals for the next movement. If the price action confirms a bearish continuation, the Dow Jones index could find support in 21,000 pts.

Categories
Forex Elliott Wave Forex Market Analysis

Dow Jones: Still no New Record High Confirmation

Overview

The Dow Jones Industrial Average continues its advances toward the green side. During this year, it is still easing 1.08% (YTD). The DJIA index, which groups to the 30 largest capitalized U.S. companies, move in the extreme bullish sentiment zone unveiling the probability of new record highs in the U.S. stock market. Likely, it could find resistance at the 30,000 pts as a psychological barrier confirming the all-time highs observed both S&P 500 and NASDAQ 100.

Market Sentiment Overview

During this year, the Dow Jones Industrial Average eases 1.08% (YTD), returning from the bear market to bull market side. The recovery experienced by the Industrial Average, carried it to jump from the lowest level of the year at 18,213.5 pts to 28,287 pts gaining over 55%. 

The following figure compares the advance of Dow Jones and the S&P 500 in its weekly timeframe. In these two charts, we observe that both indexes move in the extreme bullish sentiment zone. However, although surprising, the recovery observed in the U.S. stock market, the Industrial Average still doesn’t confirm the all-time high of the S&P 500, reached on the latest trading sessions

If we look at the Dow Jones’ volatility (VXD), it is running below the 60-day moving average, which confirms that the market sentiment continues being in favor of fresh upsides on the Industrial Average.

Finally, considering that both NASDAQ 100 and S&P 500 reached fresh all-time highs in the latest sessions, the Dow Jones should follow the same path in the coming trading sessions.

Elliott Wave Outlook

The mid-term outlook for the Industrial Average provided by the Elliott Wave Analysis reveals the bullish continuation of the incomplete wave B of Minor degree labeled in green, which could push it toward new all-time highs.

The next 4-hour chart illustrates the price running in an uptrend that began on March 23rd when the U.S. Blue Chip index found fresh buyers at 18,213.5 pts, developing a corrective structural sequence that remains incomplete.

Once the Industrial Average broke upward the (b)-(d) upper-line of the triangle drawn by the wave ((b)) of Minor degree, the price activated its progression as wave ((c)), which is characterized by the inclusion of five internal waves. 

Currently, Dow Jones continues its development in an incomplete wave (iii) of the Minuette degree labeled in blue. Simultaneously, the bullish trendline looks intact, which leads us to conclude that the uptrend remains sound, calling for more upsides in the following trading sessions.

Finally, considering that both the S&P 500 and NASDAQ 100 reached new record highs, we expect further upsides and record highs on Dow Jones. A potential target could be at 30,000 pts as this psychological barrier will be a natural profit-taking level.

Categories
Forex Videos

Where Next for The Dow Jones Industrial Average!


Where Next for The Dow Jones Industrial Average?

Where next for the day jones industrial average?
Thank you for joining the forex academy educational video. In today’s session, we will be looking at the dow jones industrial average, which is closely watched and considered to be the main united states benchmark indices.
It is price-weighted and tracks the performance of 30 of America’s largest companies, which are mostly listed on the New York stock exchange.


The Dow Jones index reached a record high of over 29,000 in February, before tanking to just above 18,000 in march during the worst of the Covid pandemic in the United States. And then rallied back up to 27,500 in June while the United States was still severely impacted by the outbreak of the virus. The amazing recovery was largely driven. I hope that the pandemic would soon be over and that a recovery would quickly happen within the United States with regard to the economy getting back to normal. The Fed was calling this a V-shaped recovery. Straight down and then straight up. However, this has not exactly transpired, and although the federal reserve has implemented monetary policies to prop up their ailing economy and help those individuals who have been impacted, including support for companies, all of this is just adding to America’s debt burden. The typical analysis of the stock market being driven up by growth is, therefore, flying in the face of the fundamentals.
And while every single good news regarding vaccines has tended to keep the Dow Jones index propped up, almost artificially, another aspect which has been holding it up to levels above 26,000 points and more recently a pop above 27,000 points has been the expectation that tech stocks would perform very well during this time. This has been backed up by strong performances from companies such as Microsoft and apple Intel NVIDIA and Amazon, which are listed on the alternative index, the National Association of Securities Dealers Automated Quotations, or Nasdaq, of which there are two variant indices; the 100 and the composite.


Worryingly Wall Street closed in the red, which was largely triggered by buy tech stocks falling potentially bursting the bubble that the American economy will be driven higher by such stocks leading to a v-shaped recovery.
Even more alarming is the continuing spat between China and the United States, which could lead to tariffs being implemented on either side and potential sanctions. Any breakdown in trade between the two nations, especially China buying from the United States at the moment, would also impact on the so-called v-shaped recovery. And, of course, America just does not seem to be getting a handle on the number of cases of Covey, which are escalating in some States.
The pullback from 27,000 points on the Dow to the current level of 26,470, at the time of writing, and a simultaneous drop on the s&p 500 of 20 points and a shed of 98 points on the NASDAQ on Friday the 24th July, has set alarm bells ringing with investors and traders who have been concerned that stock markets in the United States are overvalued and about to crash for a second time since March.

Categories
Forex Market Analysis

Dow Jones – Long-Term Technical Overview

This year, The Dow Jones Industrial Average performance went down more than 36% during the first quarter collapse that dragged to the global stock market. Although the recovery experienced by the Industrial Average after March 23th keeps its performance on the negative side, the DJ-30 index could still reach a new all-time high.

Market Sentiment Overview

During the first quarter of 2020, the Coronavirus spread attained the status of a global pandemic, which triggered an economic crisis, originated from a worldwide lockdown. The economic context took down the stock markets. In particular, the U.S. stock market led the Industrial Average to plummet until the 18,213.5 pts, its worst level since November 2016. 

Once Dow Jones found support in its lowest level of the year, after losing over 36%, the Industrial Average began to recover partially from of its losses, advancing near 49% from its March’s low to date.

Under this context, the upper figure illustrates the Dow Jones moving in the 52-week high and low range’s strong bullish sentiment zone. At the same time, we distinguish its price moving above the 26-week moving average, which leads us to anticipate more advances in the short-term.

On the other hand, the Institutional Net Positions (green curve) informed in the latest CFTC report unveils that the speculative bull traders increased their positioning on the long side. However, the institutional sentiment remains on the bearish side.

In summary, the short-term sentiment remains on the long side. In this context, a potential recovery could make it advance toward the 28,595.2 pts, which corresponds to the opening price of 2020. On the other hand, if the Dow Jones Industrial Average develops a new bearish movement, the next key supports are located at 26,749.9 pts and 23,904.4 pts.

Elliott Wave Outlook

Under an Elliott Wave perspective, the big picture of the Dow Jones Industrial Average reveals its advance on an incomplete fourth wave of Primary degree identified in black.

The current bull market began in early March 2009, when the Industrial Average found fresh buyers at 6,466.6 pts. In the next figure, we distinguish that the third wave corresponds to an extended movement, which ended in early February when the Blue Chip U.S. stock market index found resistance at 29,595.3 pts.

Currently, the Dow Jones index advances in its fourth wave of Primary degree, which progress on its wave (B) of Intermediate degree identified in blue. On the other hand, we noticed that the second wave (identified in black on the left of the chart) developed a simple correction in a brief lapse of time. In this context, and considering the alternation principle, the fourth wave should be a complex correction that should take longer than the second wave,  for instance, in the form of a triangle formation, or a double three pattern. After this corrective wave formation, the price action should continue the bullish trend developing a fifth wave of Primary degree with a potential target at the psychological barrier of 30,000 pts.

Finally, with the completion of the five-wave upward sequence of Primary degree, the Industrial Average would complete a motive wave of Cycle degree. Hence, the end of the current bull market will give way to a downward corrective sequence in three waves of Primary degree.


Categories
Forex Videos

The Dow Jones Bull Trap! Don’t Get Caught Buyers!

Dow Jones Index – Bull Trap

A bull trap is a misleading signal which tells financial traders that an asset, which has recently fallen, has reversed and is currently heading upwards, when in fact, the asset will continue to decline. Thus trapping buyers who went long, often at the top of the rebound, only to go on to suffer losses when the asset crashes.
We may well find ourselves in such a situation with the Dow Jones Index currently.


This is a daily chart of the Dow Jones index, and we can see that after a record-breaking run during February 2020, when the American economy was flying high, it crashed to a low of 18.200 just a few weeks later after the outbreak of Covid-19 as the US shut down its economy to protect citizens. This is the first time their economy has been closed down by Government consent.

The Federal Reserve threw money at the economy in the form of reducing interest rates and massive rounds of financial relief packages worth over $3 trillion, so far, and yet still with the majority of the economy flatlining, the Dow Jones Index rallied to a recent high of 24.900. This was effectively a massive bull run during a slump. It caught a lot of investors off guard, many who were selling stocks and shares seem to have sold out too soon during the first crash down to 18.200. But will those investors who started buying again after that low now suffer as the index falls lower, or will we continue to see momentum to the upside?

The issue for investors, as the Dow sits at 23.650 level, is that Banks are not paying dividends to investors this year as they try to shore up losses caused by the pandemic. This makes bank stock highly unattractive to traditional investors who would previously buy such stocks while accepting the risk of a potential fall in stock value while receiving dividend payments. They were happy to ride out any financial storms while waiting for better times ahead after the economy recovers and thus a return in the share price.
However, this crisis is not the same as the financial crisis in 2008, where investors such as Warren Buffet piled in through his investment vehicle, Berkshire Hathaway, to pick the stock up cheaply looking for long term growth. Boy, did he do well when the economy went on to surge higher?

However, Berkshire Hathaway has suffered heavy losses in this current crash, having lost an estimated $50 billion, and Mr. Buffet claims to have made a mistake in buying airline stocks and has just sold 84% of his stake in Goldman Sachs, the darling of the Wall Street investment banks. Could the writing be on the wall for US stocks now? He said that while the trains had come off the tracks in 2008, they are currently in the sidings in this event.

So, with over 20 million currently unemployed, GDP at -4.8% for March, manufacturing down, Government debt growing, and with 1.5 million cases of Covid-19 and almost 90 thousand poor souls having lost their lives, what on earth seems so attractive about buying US stocks right now?
The simple truth is that there are more buyers than sellers right now, many investors believing that the economy will bounce back quickly after similar health crises, such as Ebola, Sars Bird Flu, and Zika, where there were crashes in stocks but where they quickly recovered. And also where firms and

executives of those firms have bought their own stock on the dip lower. Some economists believe there will be a V-shaped recovery: a quick fall and a quick recovery. This sort of talk causes F.O.M.O or fear of missing out, a very big reason why we see such rallies, as they pile in buying up stock believing that the worst is over.


This is the number one reason that stocks are getting bought while the news is getting worse. But the elephant in the room is Covid-19 is still an unknown disease and the moment markets hear of second waves they will drop stocks like hot potatoes. There will highly come a time, very shortly, which will be the straw that broke the camel’s back, bringing the current bull run to a crashing end. And that will confirm what we see as a bull trap.

Categories
Forex Market Analysis

US Trade Balance Deficit Reaches the Highest Level Since December 2008

Hot Topics:

  • US Trade Balance deficit reaches the highest level since December 2008.
  • PMI Markit Composite of the Eurozone shows signs of a slowdown.
  • PMI UK Services falls to the lowest value since 2016.
  • Yen fails in its attempt to approach the 108.
  • Aussie developing the second leg.
  • Loonie moves sideways while waiting for the employment data.
  • Dow Jones closes bearish on new tariffs to China.
  • Crude Oil performs a pullback towards the $64 level.

US Trade Balance deficit reaches the highest level since December 2008.

February 2018 Trade Balance, has reached its highest level since December 2008, as indicated by the Department of Commerce. The deficit in goods and services for the year to date has increased by 22.7% ($ 21.1 billion) compared to the same period of 2017. Exports, meanwhile, have increased 5.9% ($ 22.4 billion) and imports have risen 9.1% ($ 43.6 billion).

On the technical side, the Dollar Index has reached the control area we mentioned in the last Daily Update. Now we have to wait for a confirmation of the reversal zone to look for continuity in the bearish positions against the dollar.


PMI Markit Composite of the Eurozone shows signs of a slowdown.

The Purchasing Managers’ Index (PMI) published by the agency Markit Economics, has reported a sharp fall in March, reaching 55.2 points, below February’s  57.1 pts. This lower PMI Index level is a sign of deceleration in new orders growth. This situation may be the result of a combination between the consequences of inclement weather in some regions of northern Europe and a limitation in the capacities of the supply-chain to meet the number of orders that have been accomplished in previous periods. Despite these pessimistic signals, as reported by the latest Daily Update, the Euro has drilled 1.2240 control support, at which we began to assess potential purchases that could take us to levels close to 1.235.


PMI UK Services falls to the lowest value since 2016.

The Service Purchasing Managers’ Index has sunk to its lowest registered value since 2016, reaching 51.7 pts compared to the 54.5 pts reported in March. This index value is worse than its quarterly moving average of 53.07 pts. As a result of this data, the cable has perforated the psychological support of 1.40, reaching 1.3965. This break-down has activated a Head-Shoulders pattern, which level of invalidation is above the 1.42 level. However, our long-term vision is in favour of long positions of the pound due to the weakness expected in the Dollar Index.

Yen fails in its attempt to approach the 108.

The weakness of the dollar has caused the yen to fail in its attempt for the USD-JPY to reach 108. In the midst of trade tension between the United States and China over tariffs, the yen exceeded 107, the key resistance that we were reporting in the last Daily Update reaching 107.44. The Japanese currency is developing a bearish leg to 107.01, a level that could act as support in the future. In today’s session, in where the US employment levels will be announced, we expect it to build enough volatility to validate if the pair manages to overcome the long-term resistance at 108.


Aussie developing the second leg.

The oceanic currency is developing a corrective structure that began at the 1.8135 high level, starting in January. The price is currently approaching a long-term bullish trend-line, and the bearish guidelines of the current formation give us a potential reversal zone between 0.7620 and 0.7573, the invalidation level is below 0.7501.


Loonie lateralizes while waiting for the employment data.

The Canadian dollar is consolidating in the range of 1.2745 – 1.28 pending the employment data from the United States and Canada that will be announced in the last trading session of the week. Our view is that the USD-CAD could make a limited bearish movement until 1.2715 to begin a bullish move as a potential second shoulder. Our long-term outlook for the pair continues to be bearish due to the inverse correlation with crude oil.


Dow Jones closes bearish for new tariffs to China.

The escalation of volatility due to tariffs between the United States and China continues. During this Thursday, President Trump has instructed the Trade Representative to consider the application of $100 billion in additional tariffs against China. In a statement, Trump said: “In light of China’s unfair retaliation, I have instructed the USTR to consider whether $100 billion of additional tariffs would be appropriate under section 301 and if so, to identify the products upon which to impose such tariffs.” Once this statement was published, the Dow Jones index that started the bullish session collapsed more than 400 points testing 24,037 points. Our vision is a scenario in which the Dow Jones could perform a corrective process in the form of A-B-C, as long as the price does not close below 23,330 pts, we will maintain the view of bullish positions.


Crude Oil performs a pullback towards the $64.

Crude oil has retreated to the neckline of the Head-Shoulder pattern at $64.1 that has been activated with a profit target at $61.8. The falls could reach even $61.44, a level that could coincide with the base of the long-term uptrend line. The invalidation level of the long-term bullish scenario is $60.2.

©Forex.Academy