Categories
Forex Videos

The US Stock Market Bubble Is About To Burst – Here’s Why You Should GTFO!

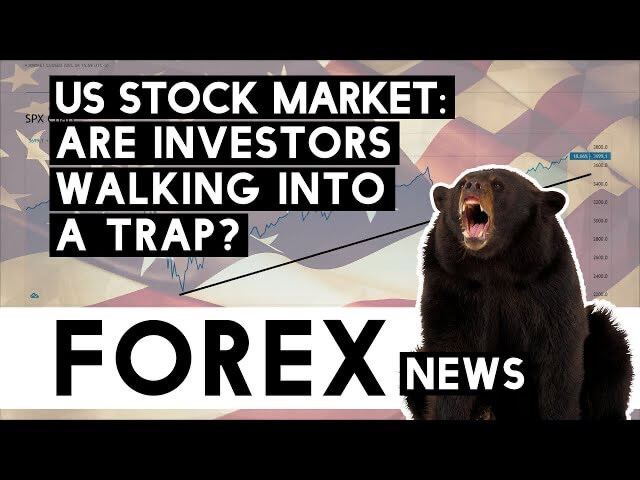
US stock market: Are investors walking into a trap?

Thank you for joining this forex academy educational video.

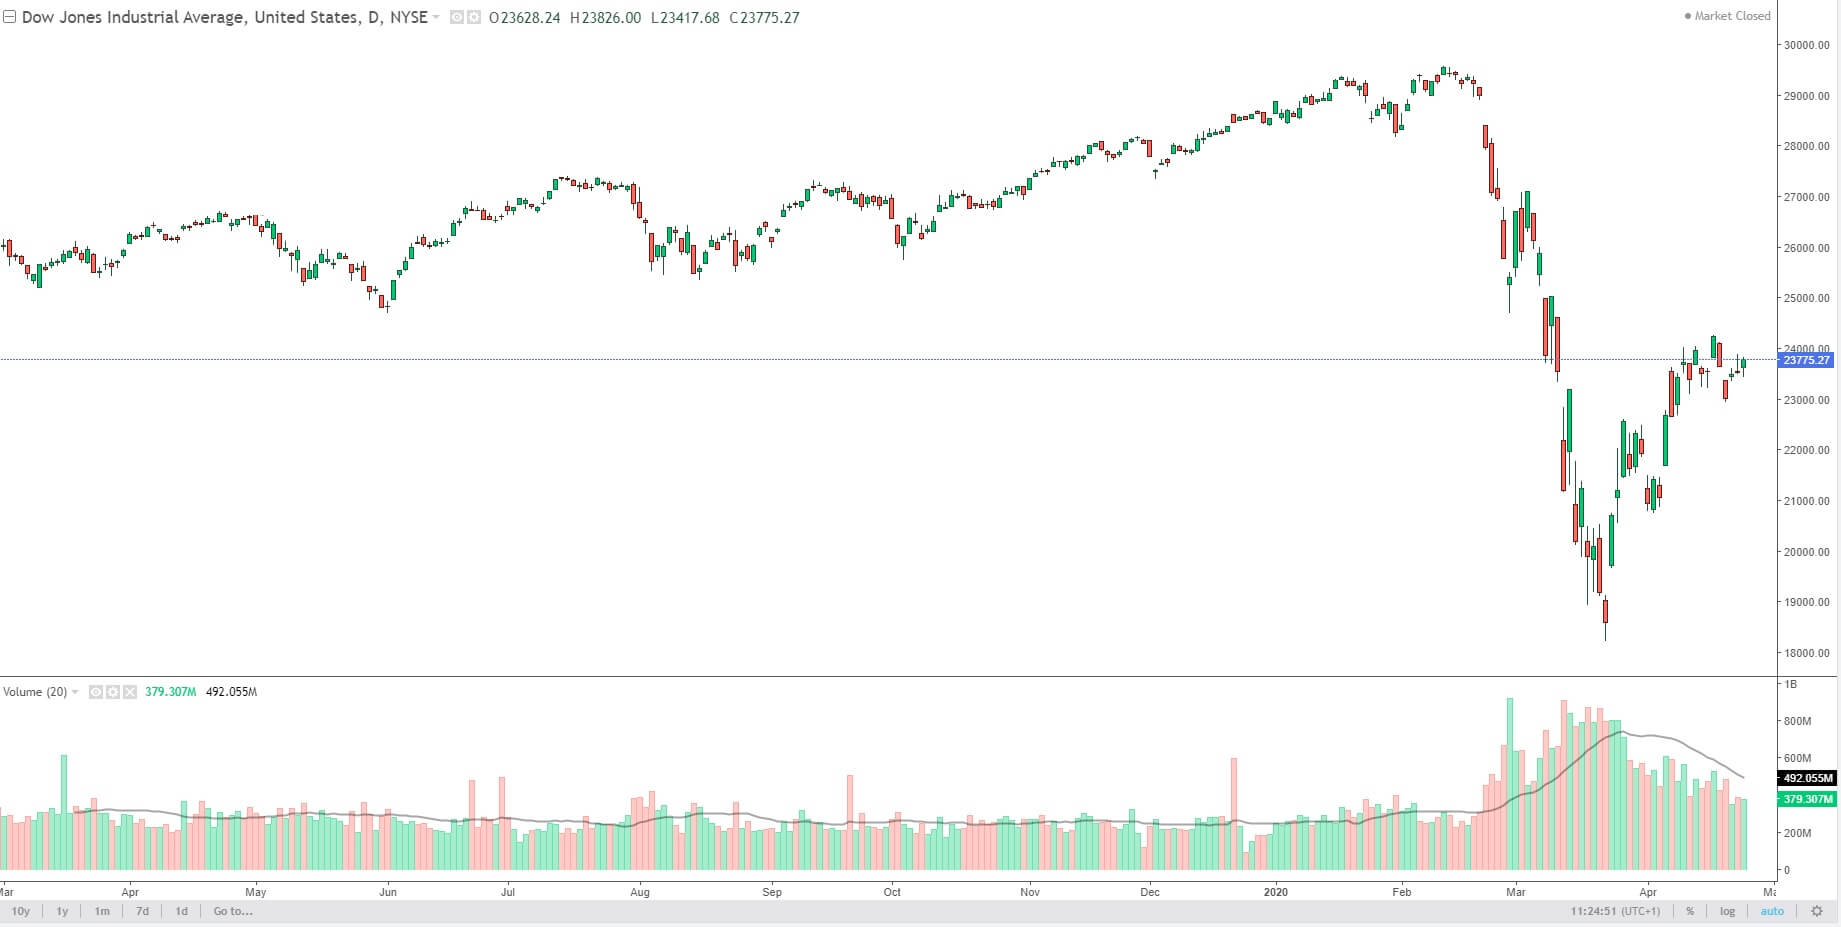
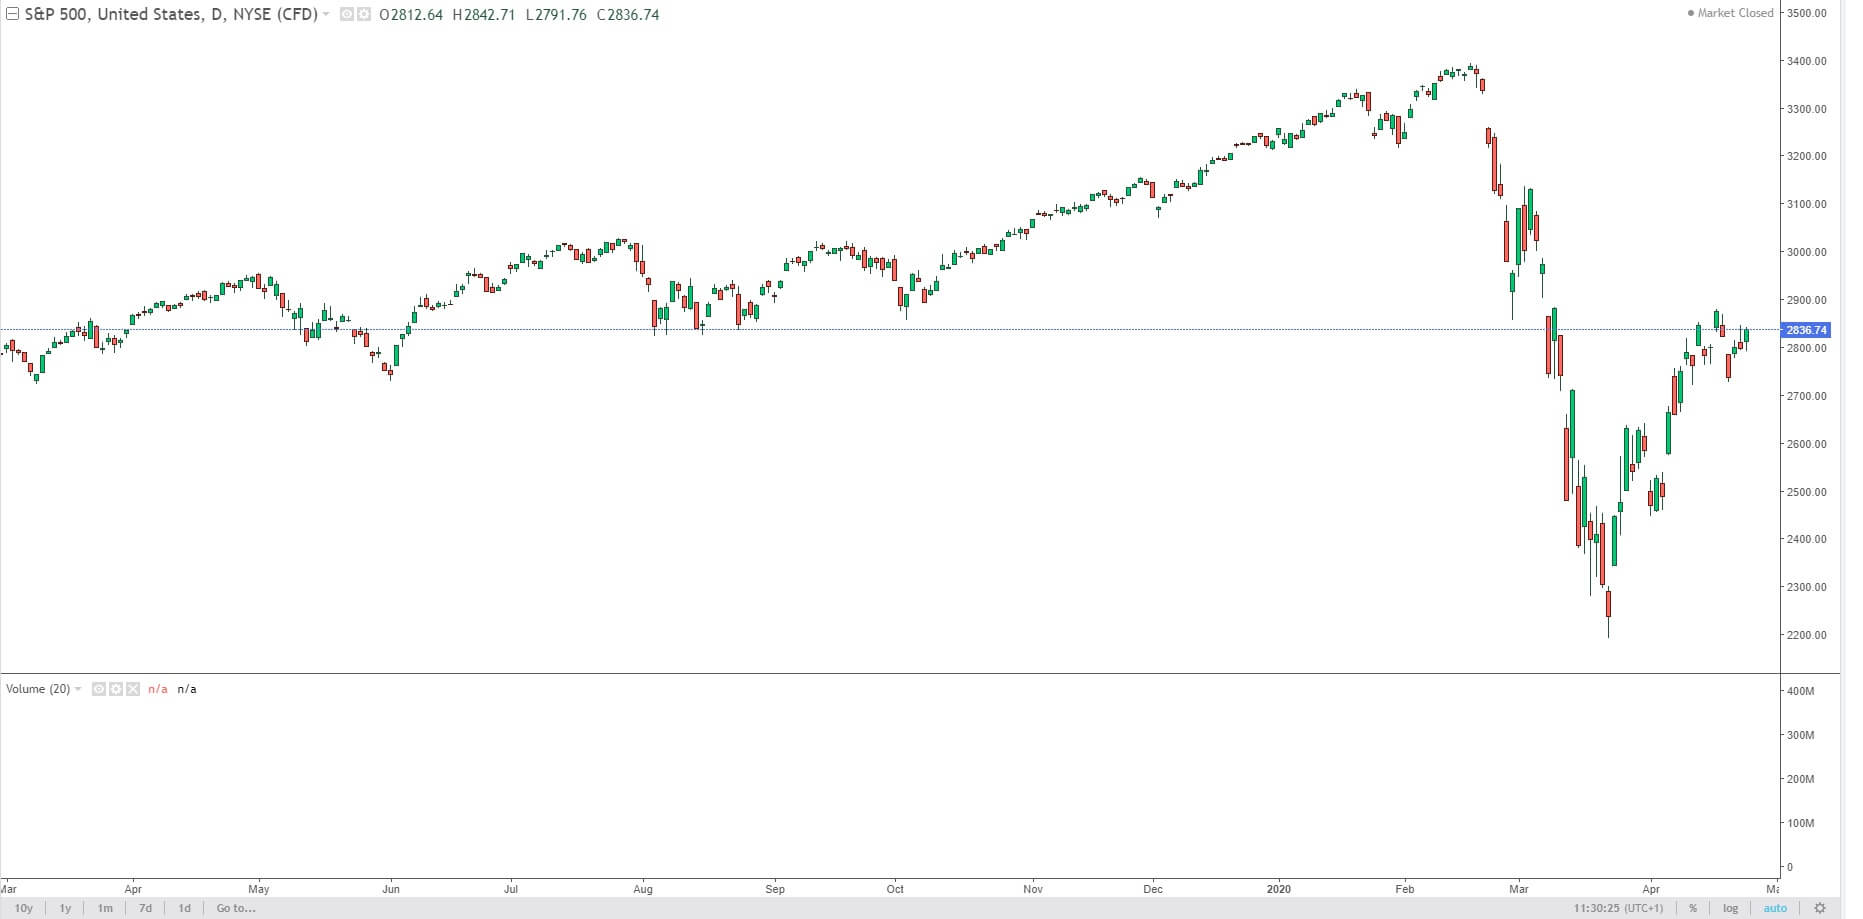
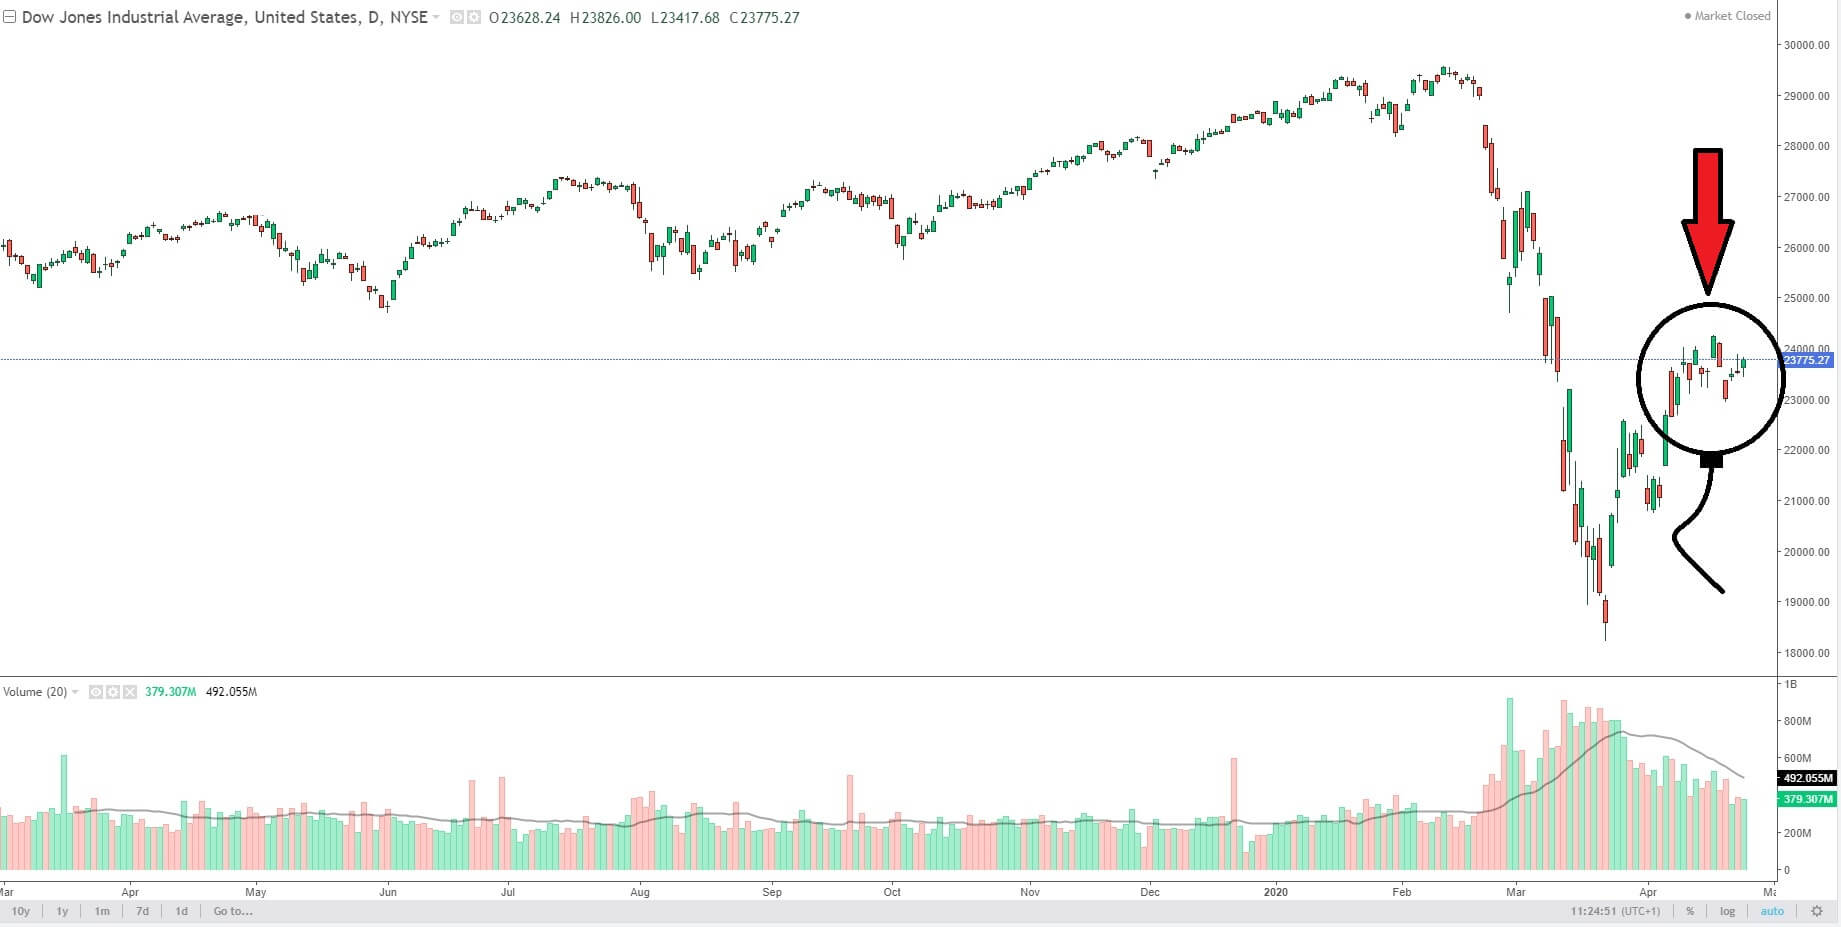
In this session, we will be looking at US stock markets, which have rocketed to historic highs, even though the United States economy is in the grip of the Coronavirus.

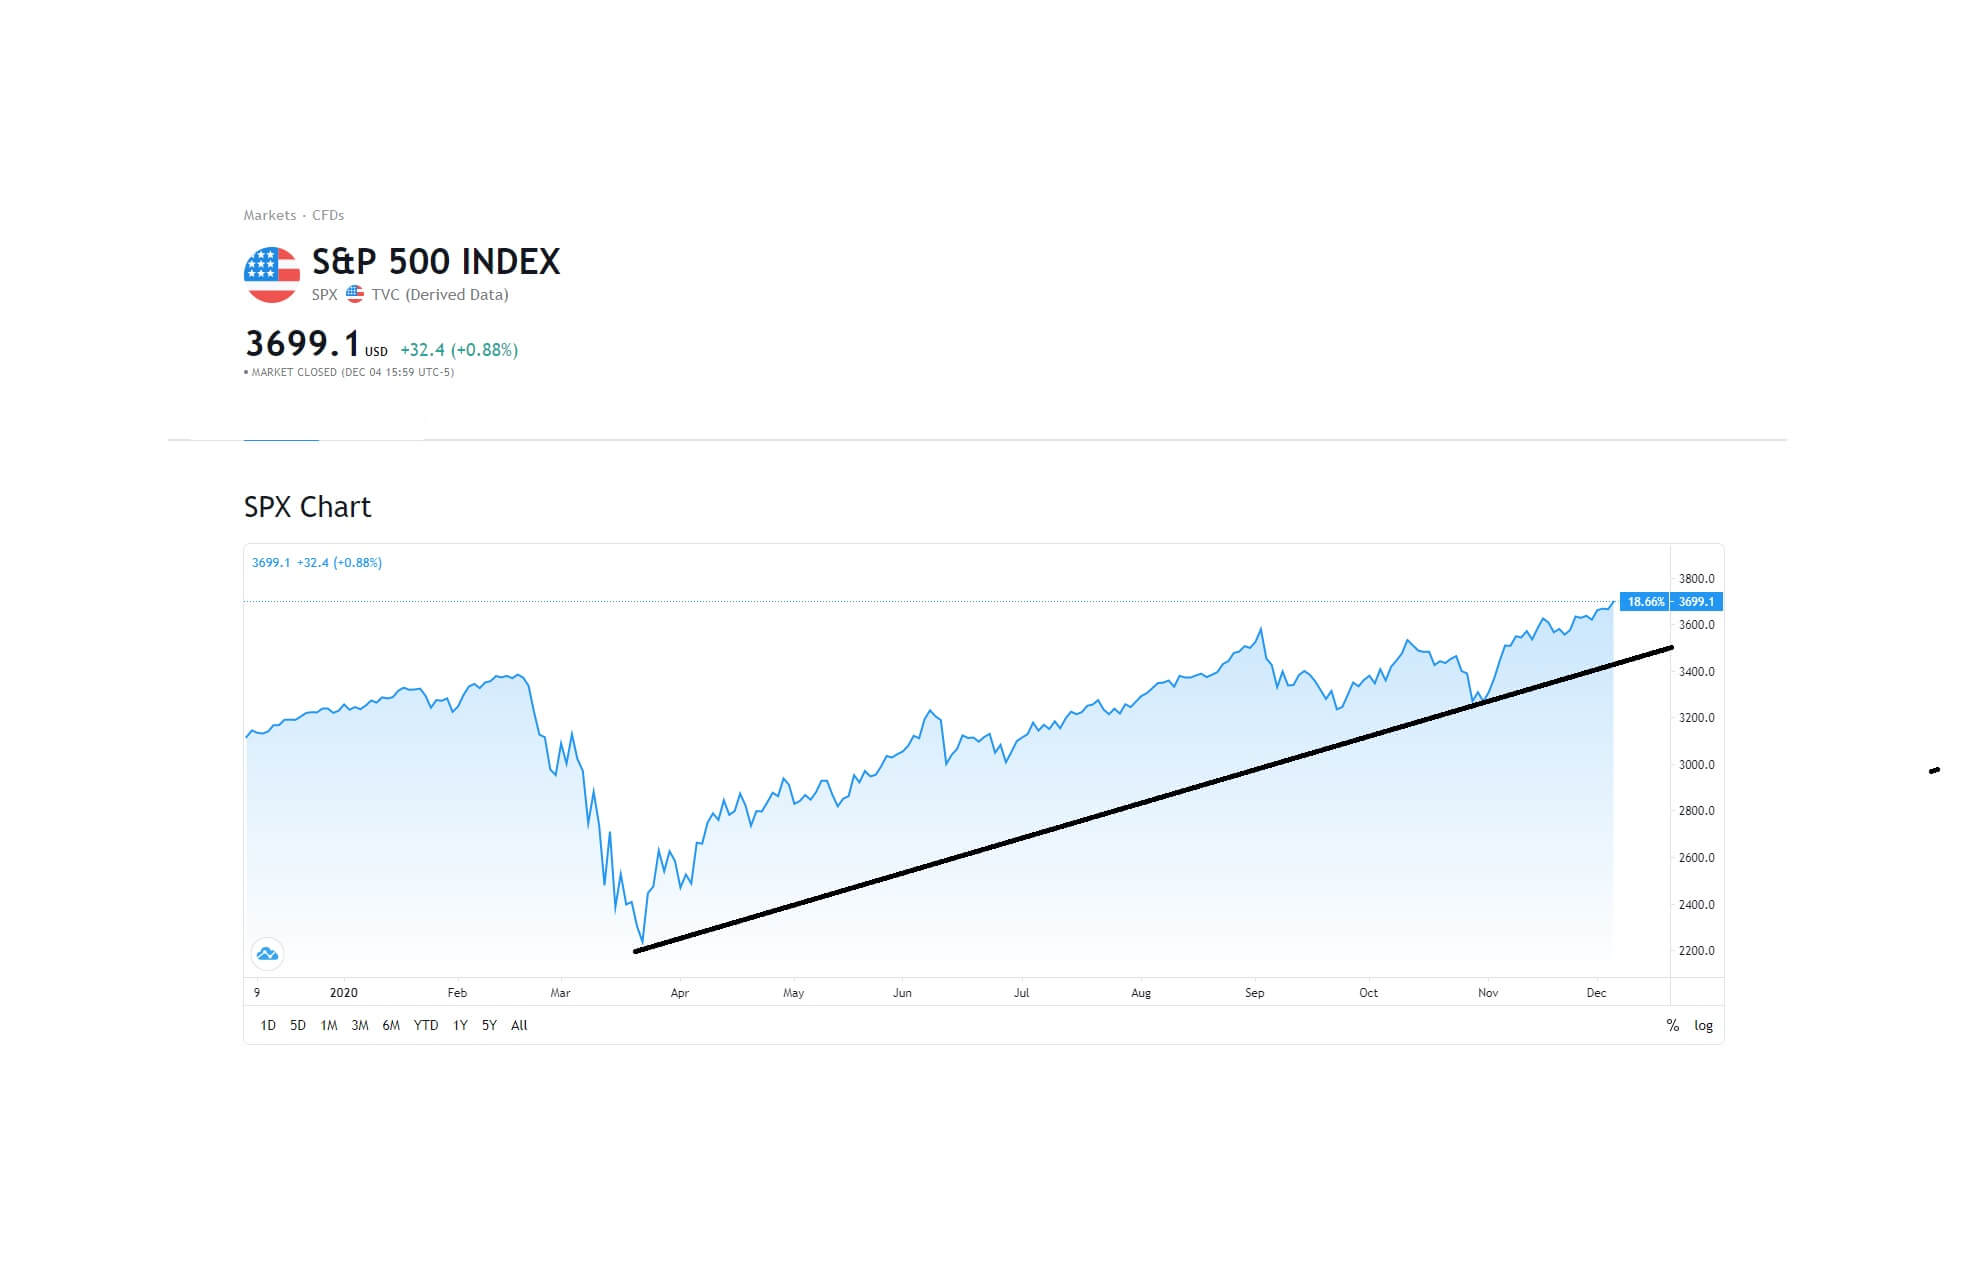
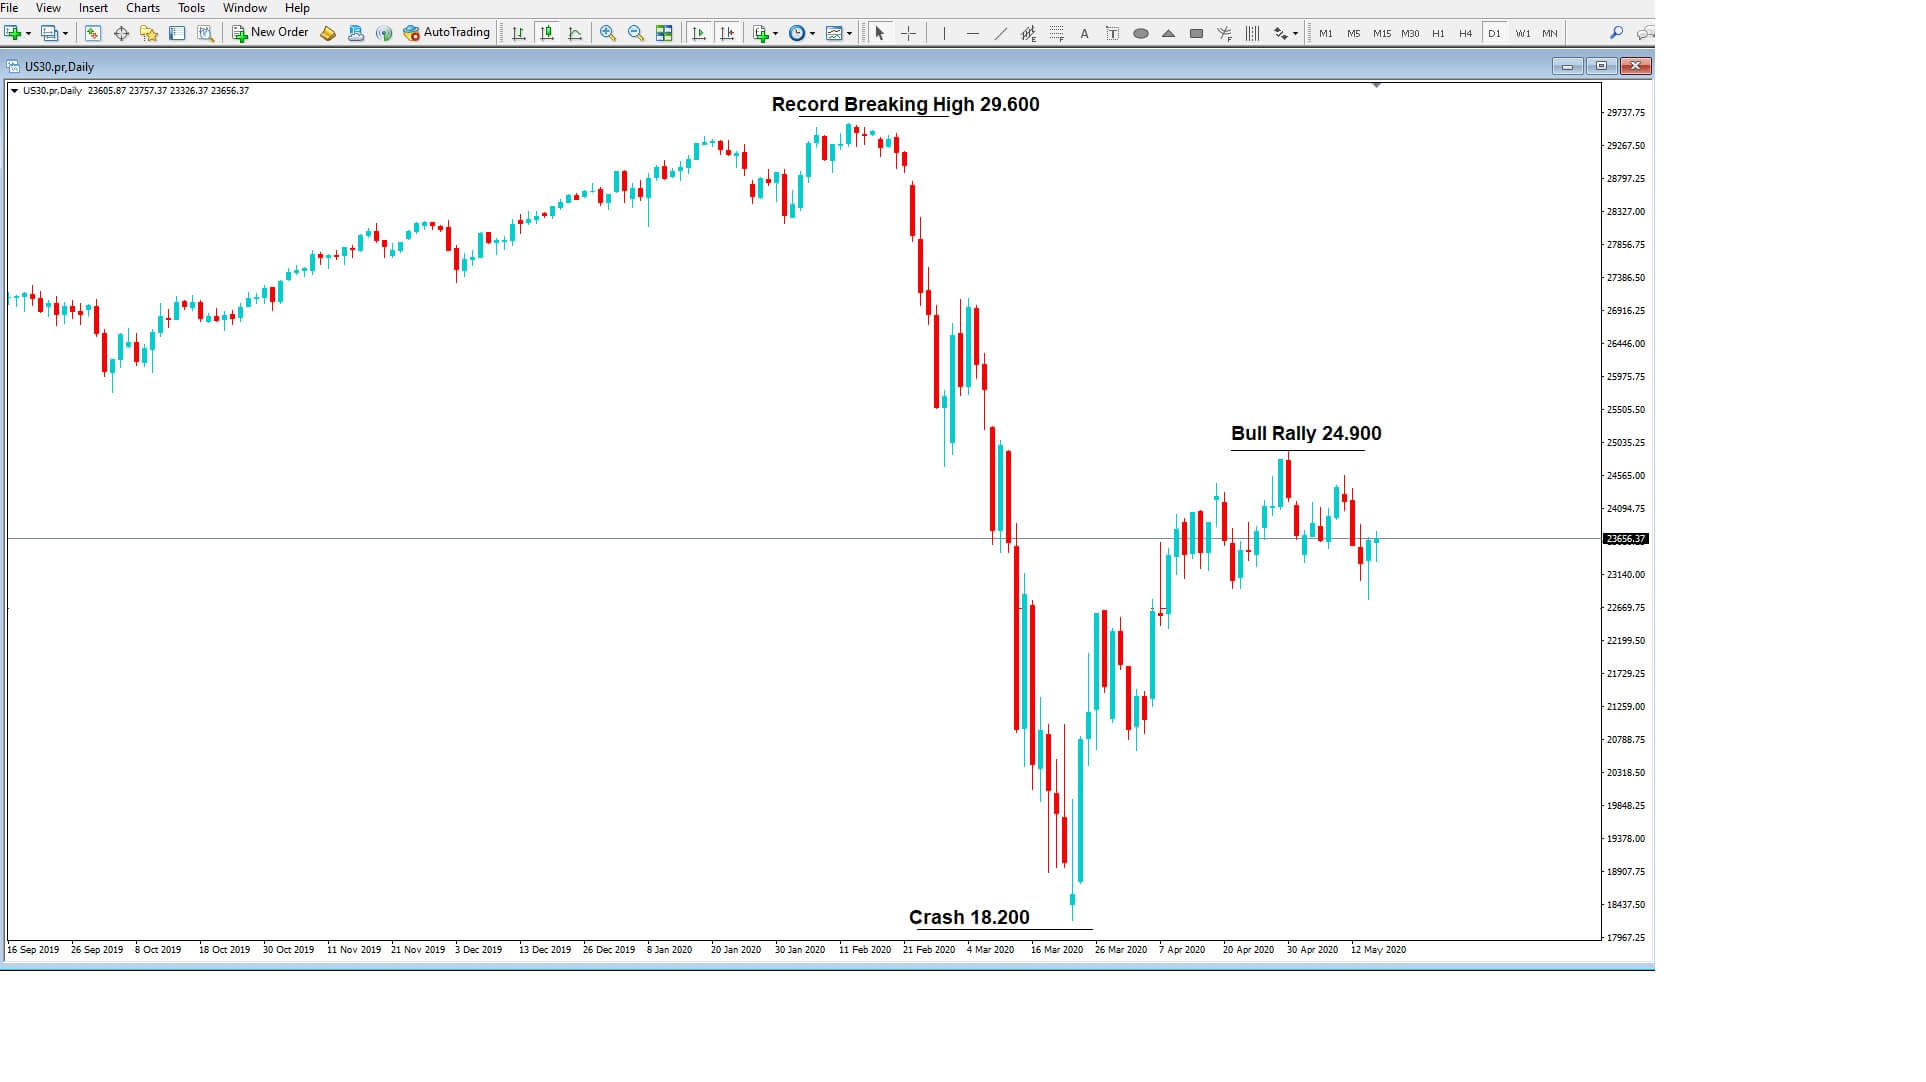
On Friday the 4th December, just post the non-farm payroll numbers, the S&P 500 index reached an all-time record high…

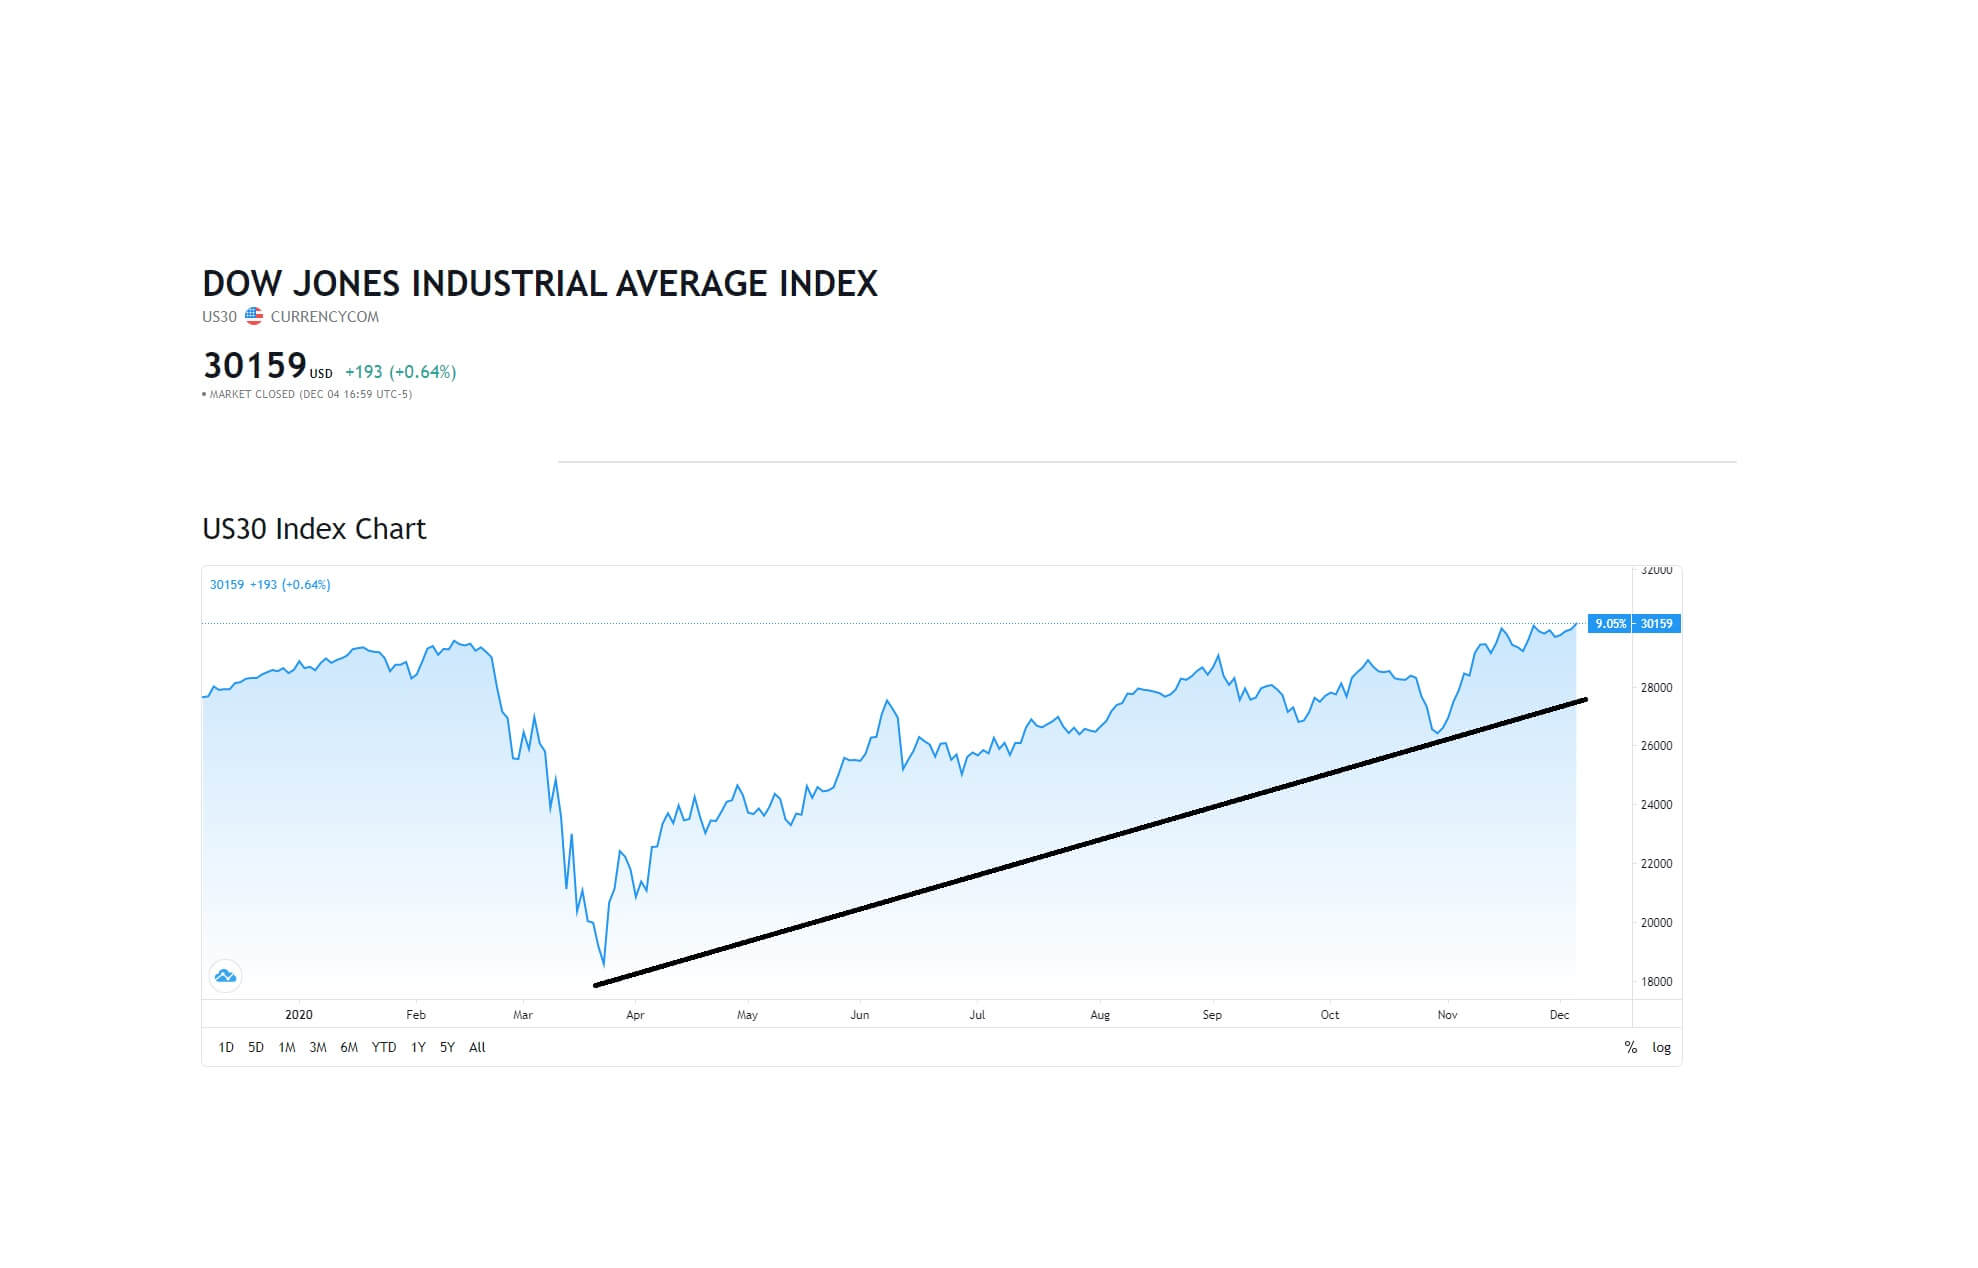
….this was also the case for the DOW Jones 30 industrial average…….
….the NASDAQ Composite index followed suit …….
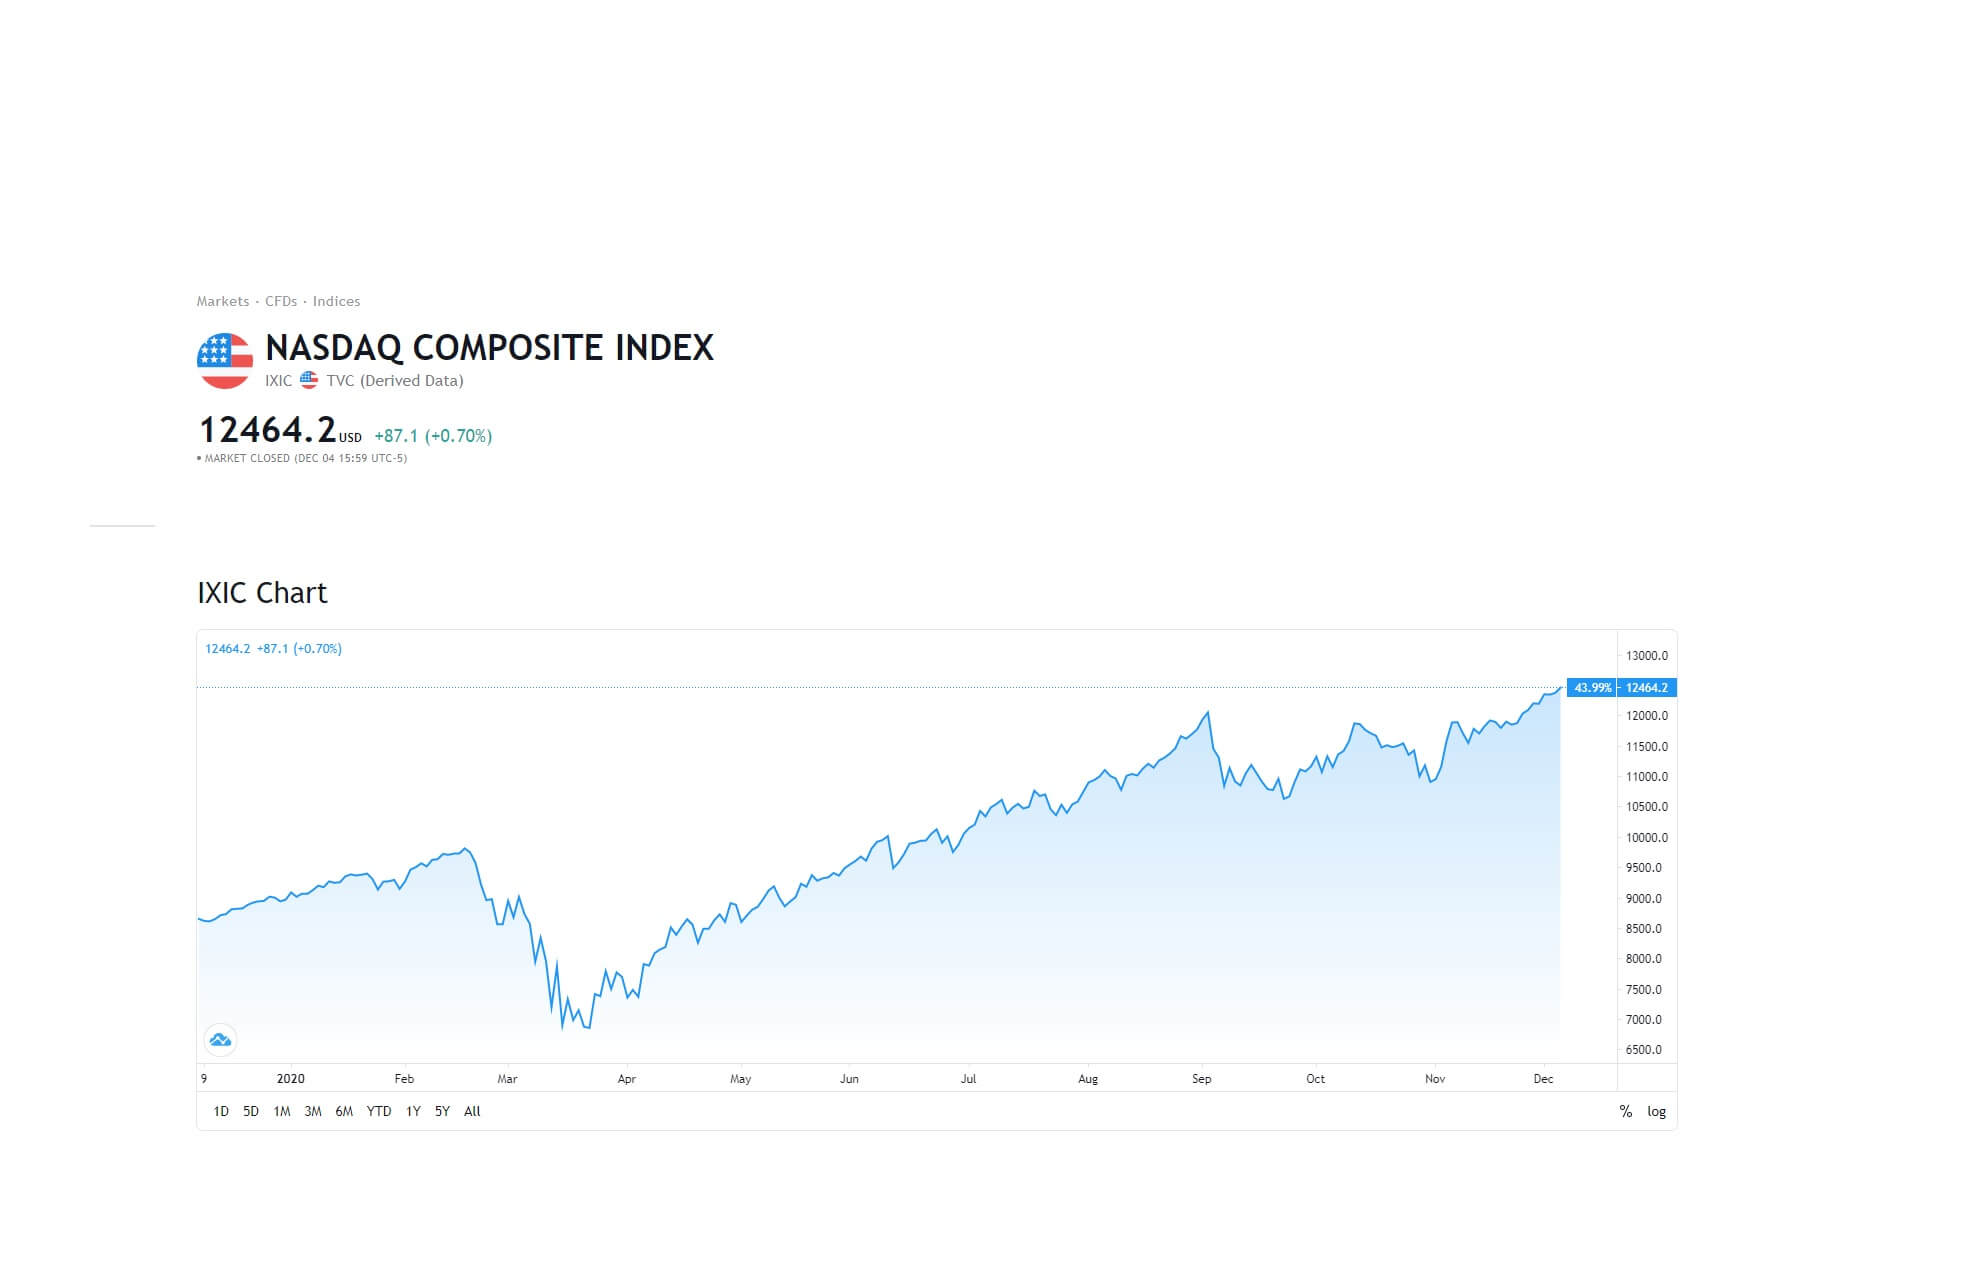
….and so did the Barons 400 index


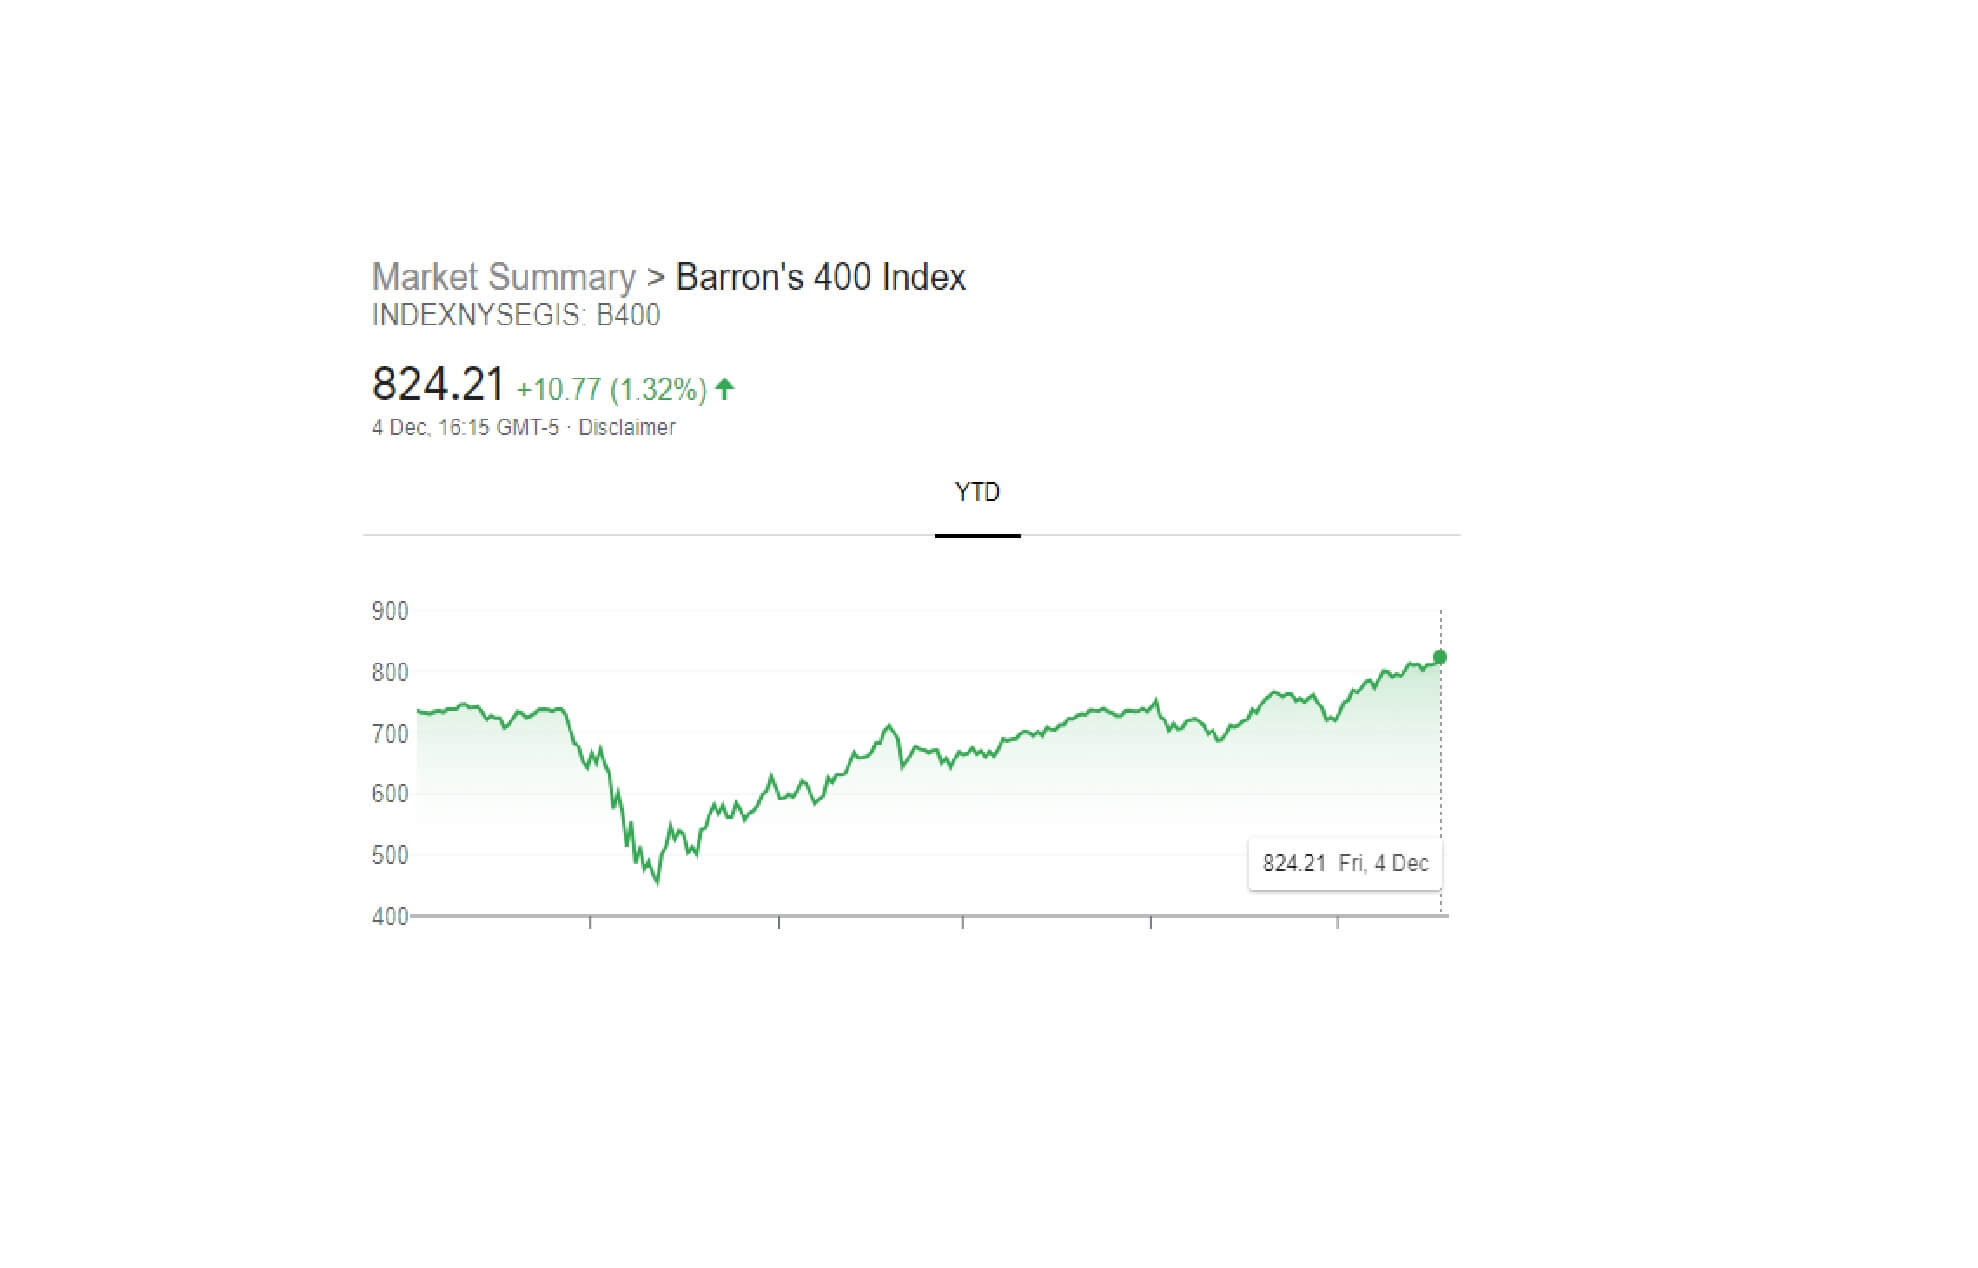
For all of these indices to simultaneously hit fresh all-time record highs is a very rare occurrence. It shows that investor sentiment is extremely high, potentially buoyed by a forthcoming and greatly anticipated next round for the Covid stimulus bill, if and when the democrats and republicans can reach an agreement on the size, currently estimated at $900 billion. The markets are also confident that the federal reserve is doing a good job in propping up the ailing American economy and sticking to a policy of low-interest rates for at least the next 2 years, which has typically corresponded with higher investment in stocks and shares, historically speaking.
Investors will look at the fed’s response to the crisis as a kind of insurance policy, that behind the scenes, the federal reserve will not allow the stock market to crash.

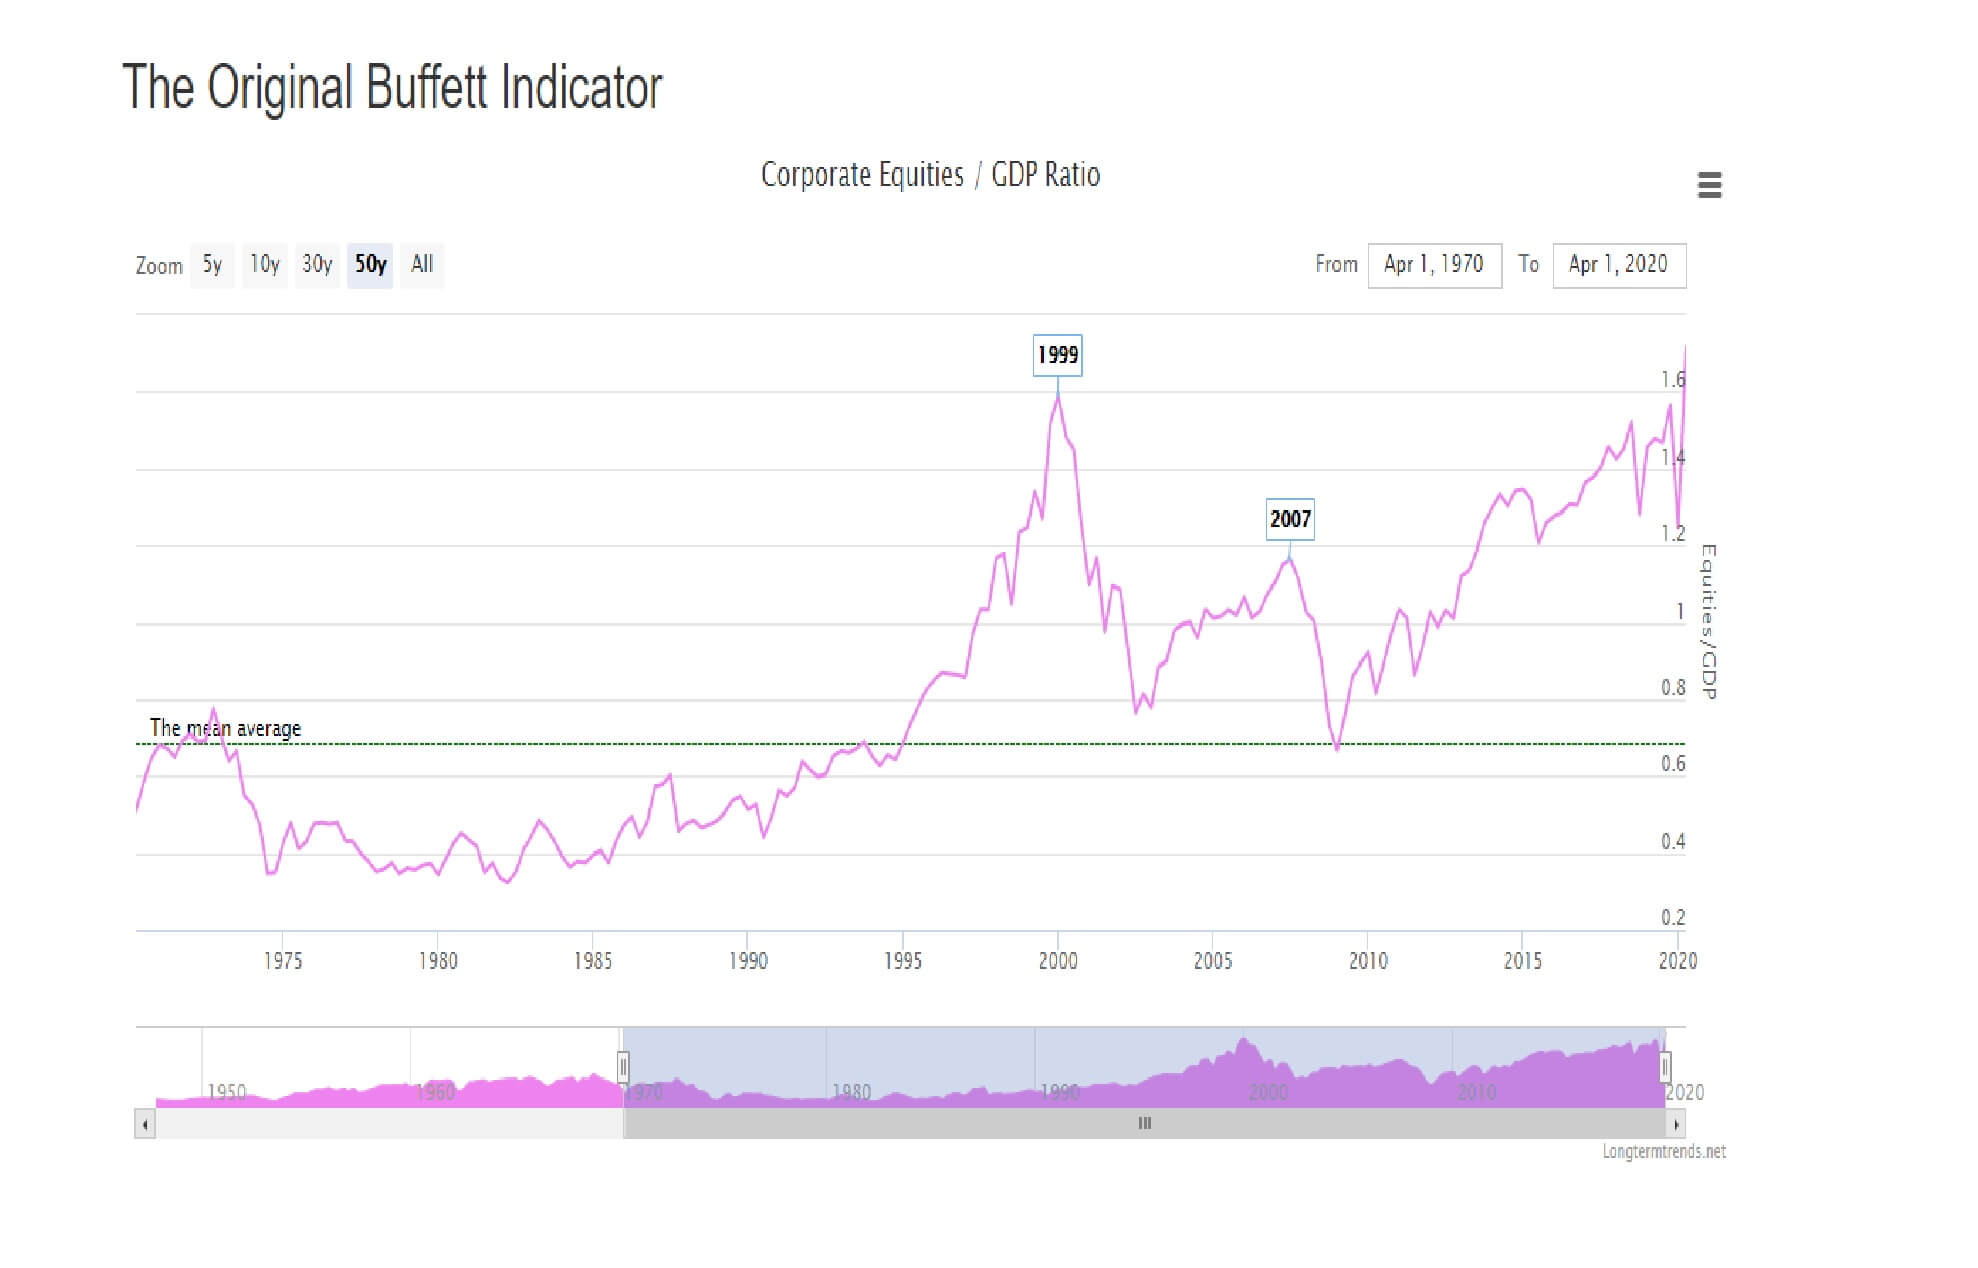
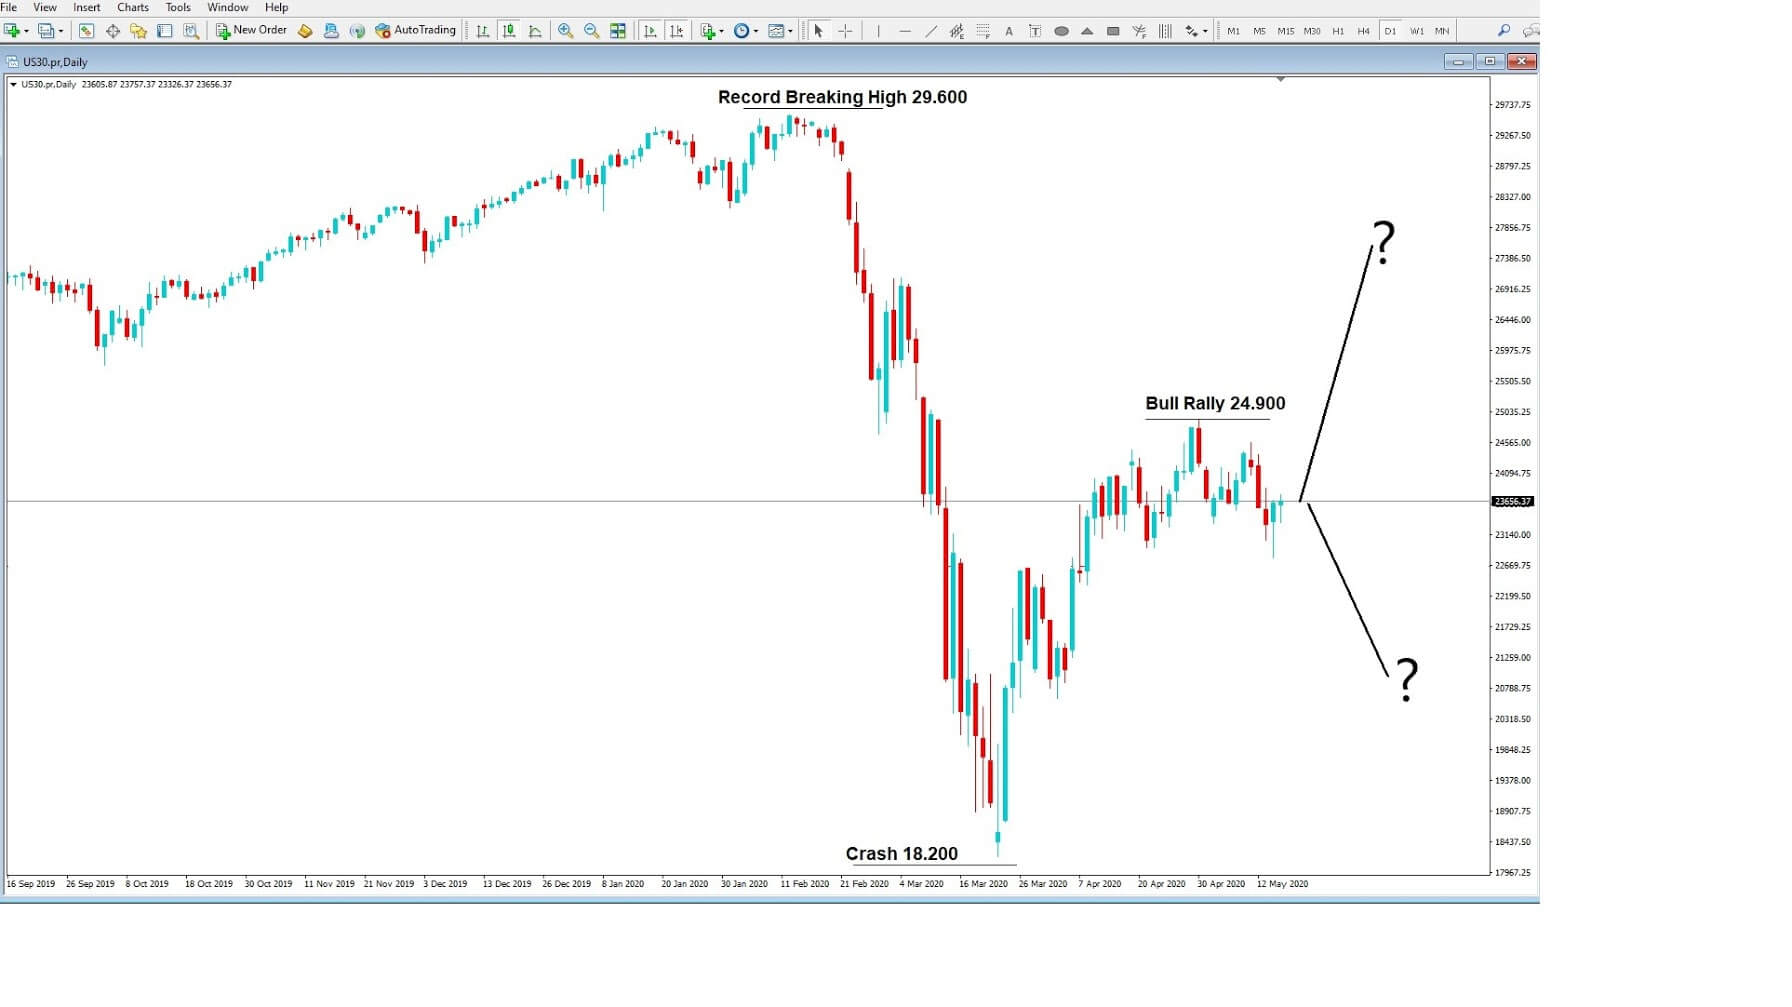
However, analysts who follow the Buffett indicator, which is the original measure for US market capitalisation, point out that since 1947 earnings per share have grown at around 6.21% annually, while the economy has expanded by 6.47% annually. This premise that the market capitalisation ratio to gross domestic product is based on the economy driven roughly 70% by consumption, where individuals must earn in order to buy products. And that consumption is where corporations earn their revenues, and ultimately this is where their profits come from.

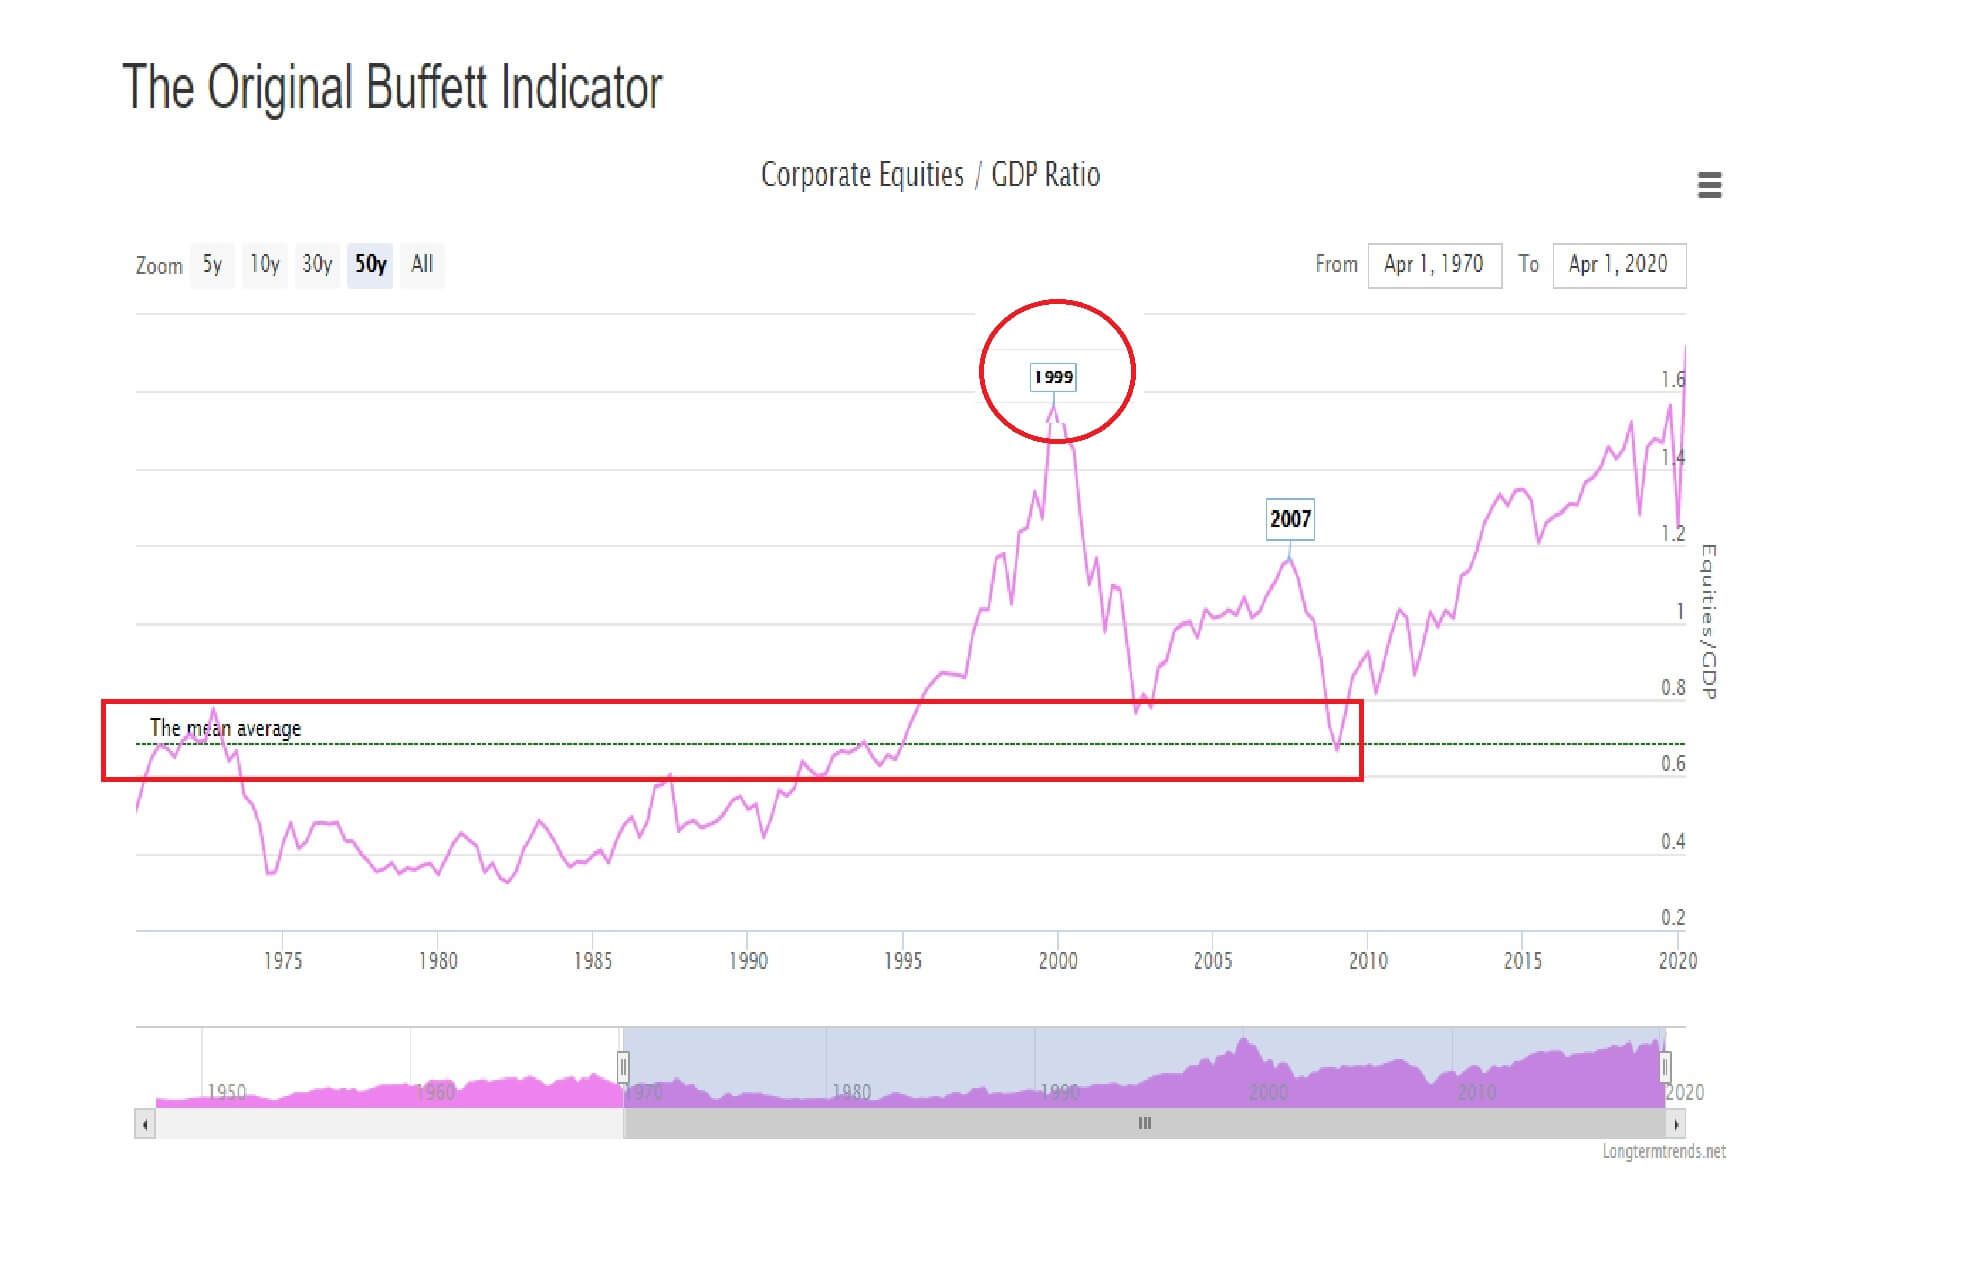
The Buffett indicator shows that the mean average of around 0.7 has been closely adhered to since the 1950s, and the last time it broke away to the upside was in 1999, when speculators were investing heavily in Dot-Com companies, and where this led to the market crash in March 2000, and where we see that around this time the indicator pulls back to the mean average. Analysts at Deutsche Bank also point out that the recent run in US stocks has taken the market shift above the ratio of price to earnings above the level seen just before the 1929 stock market crash.


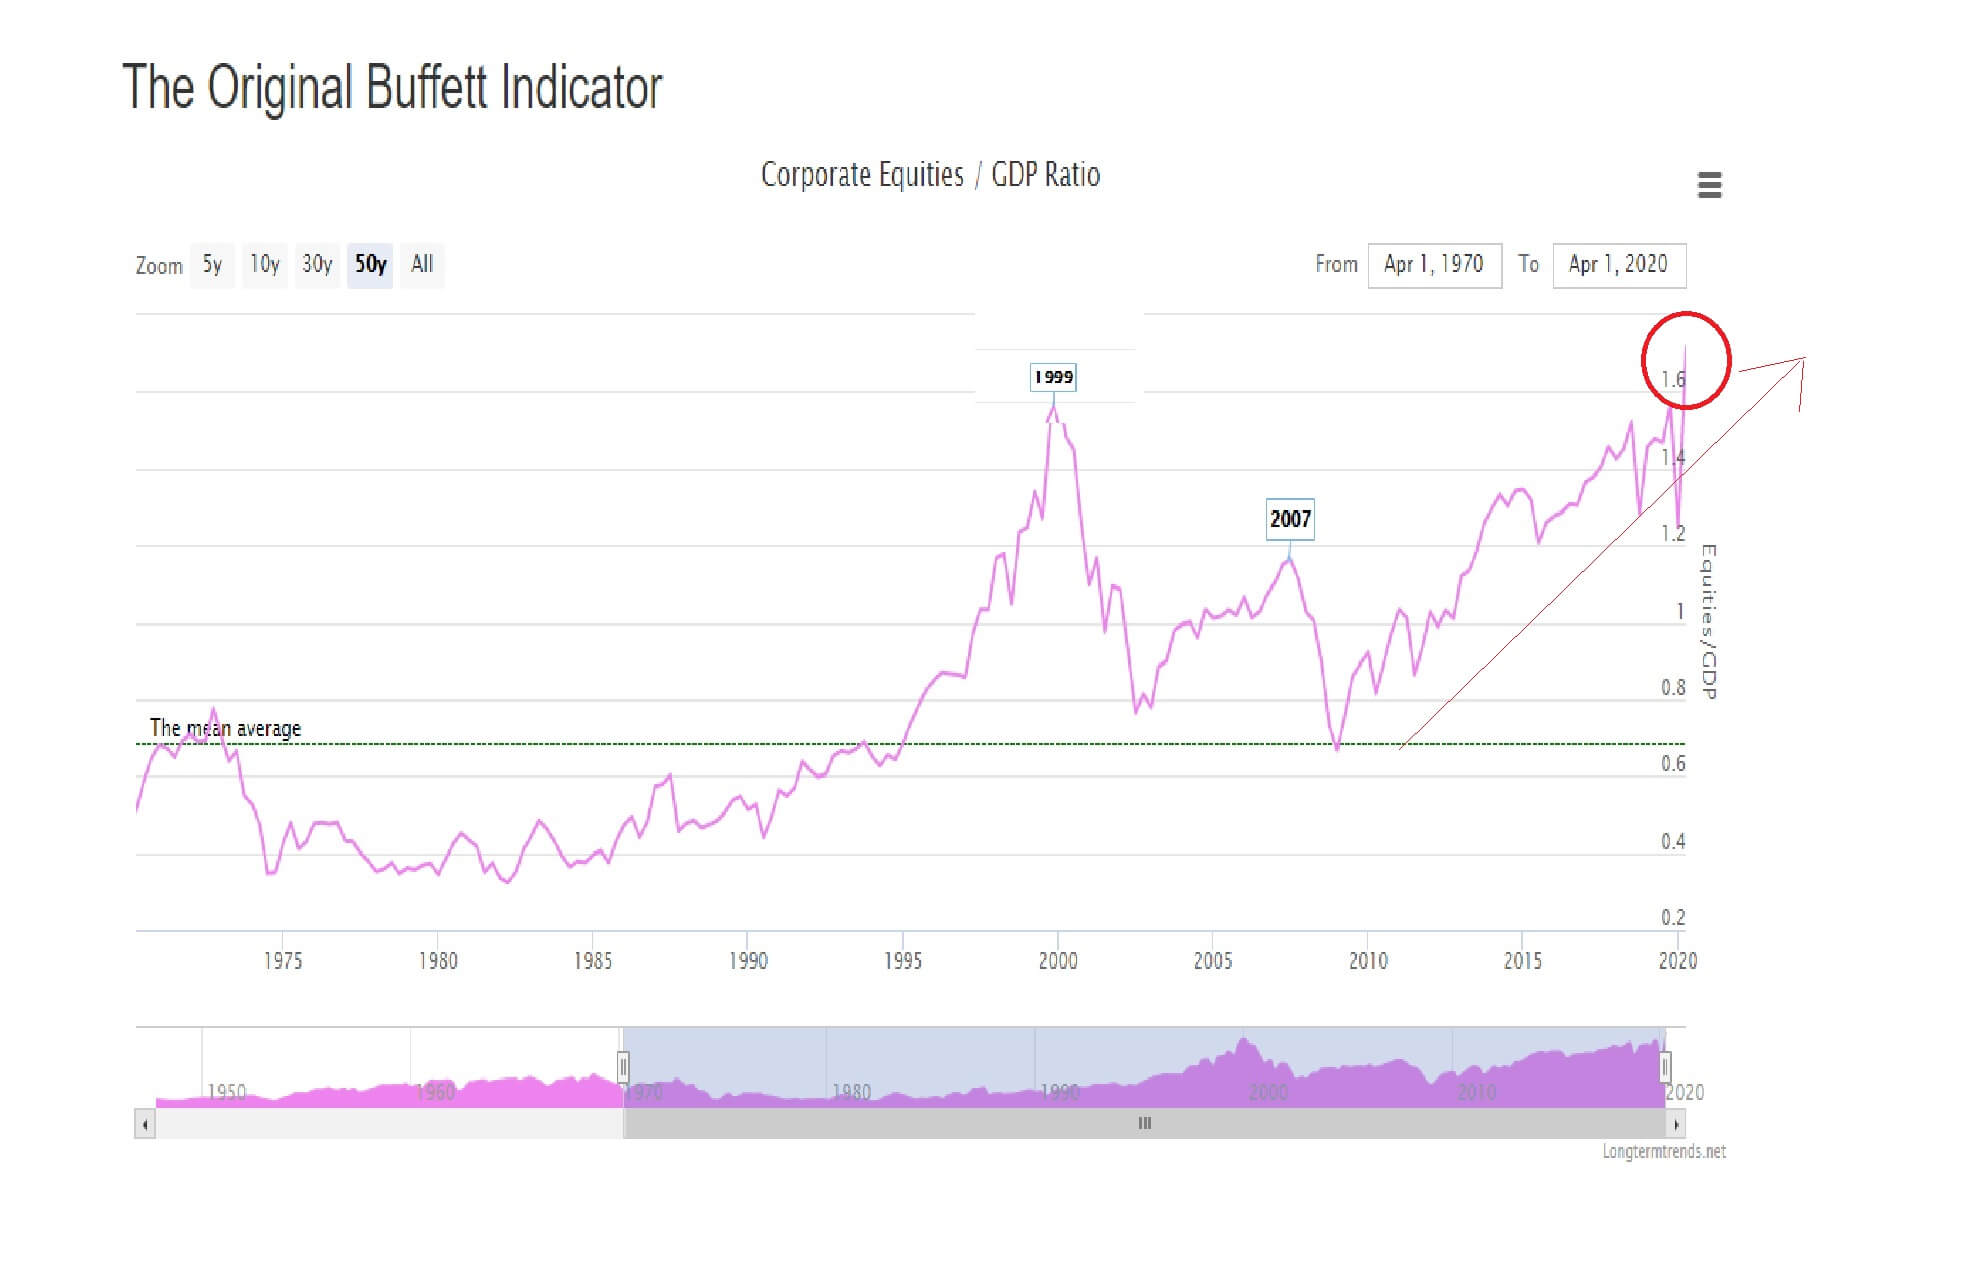
And here we see that the currents levels on the indicator are again highly inflated to a record high on the graph above the mean average at around 1.7.
…….
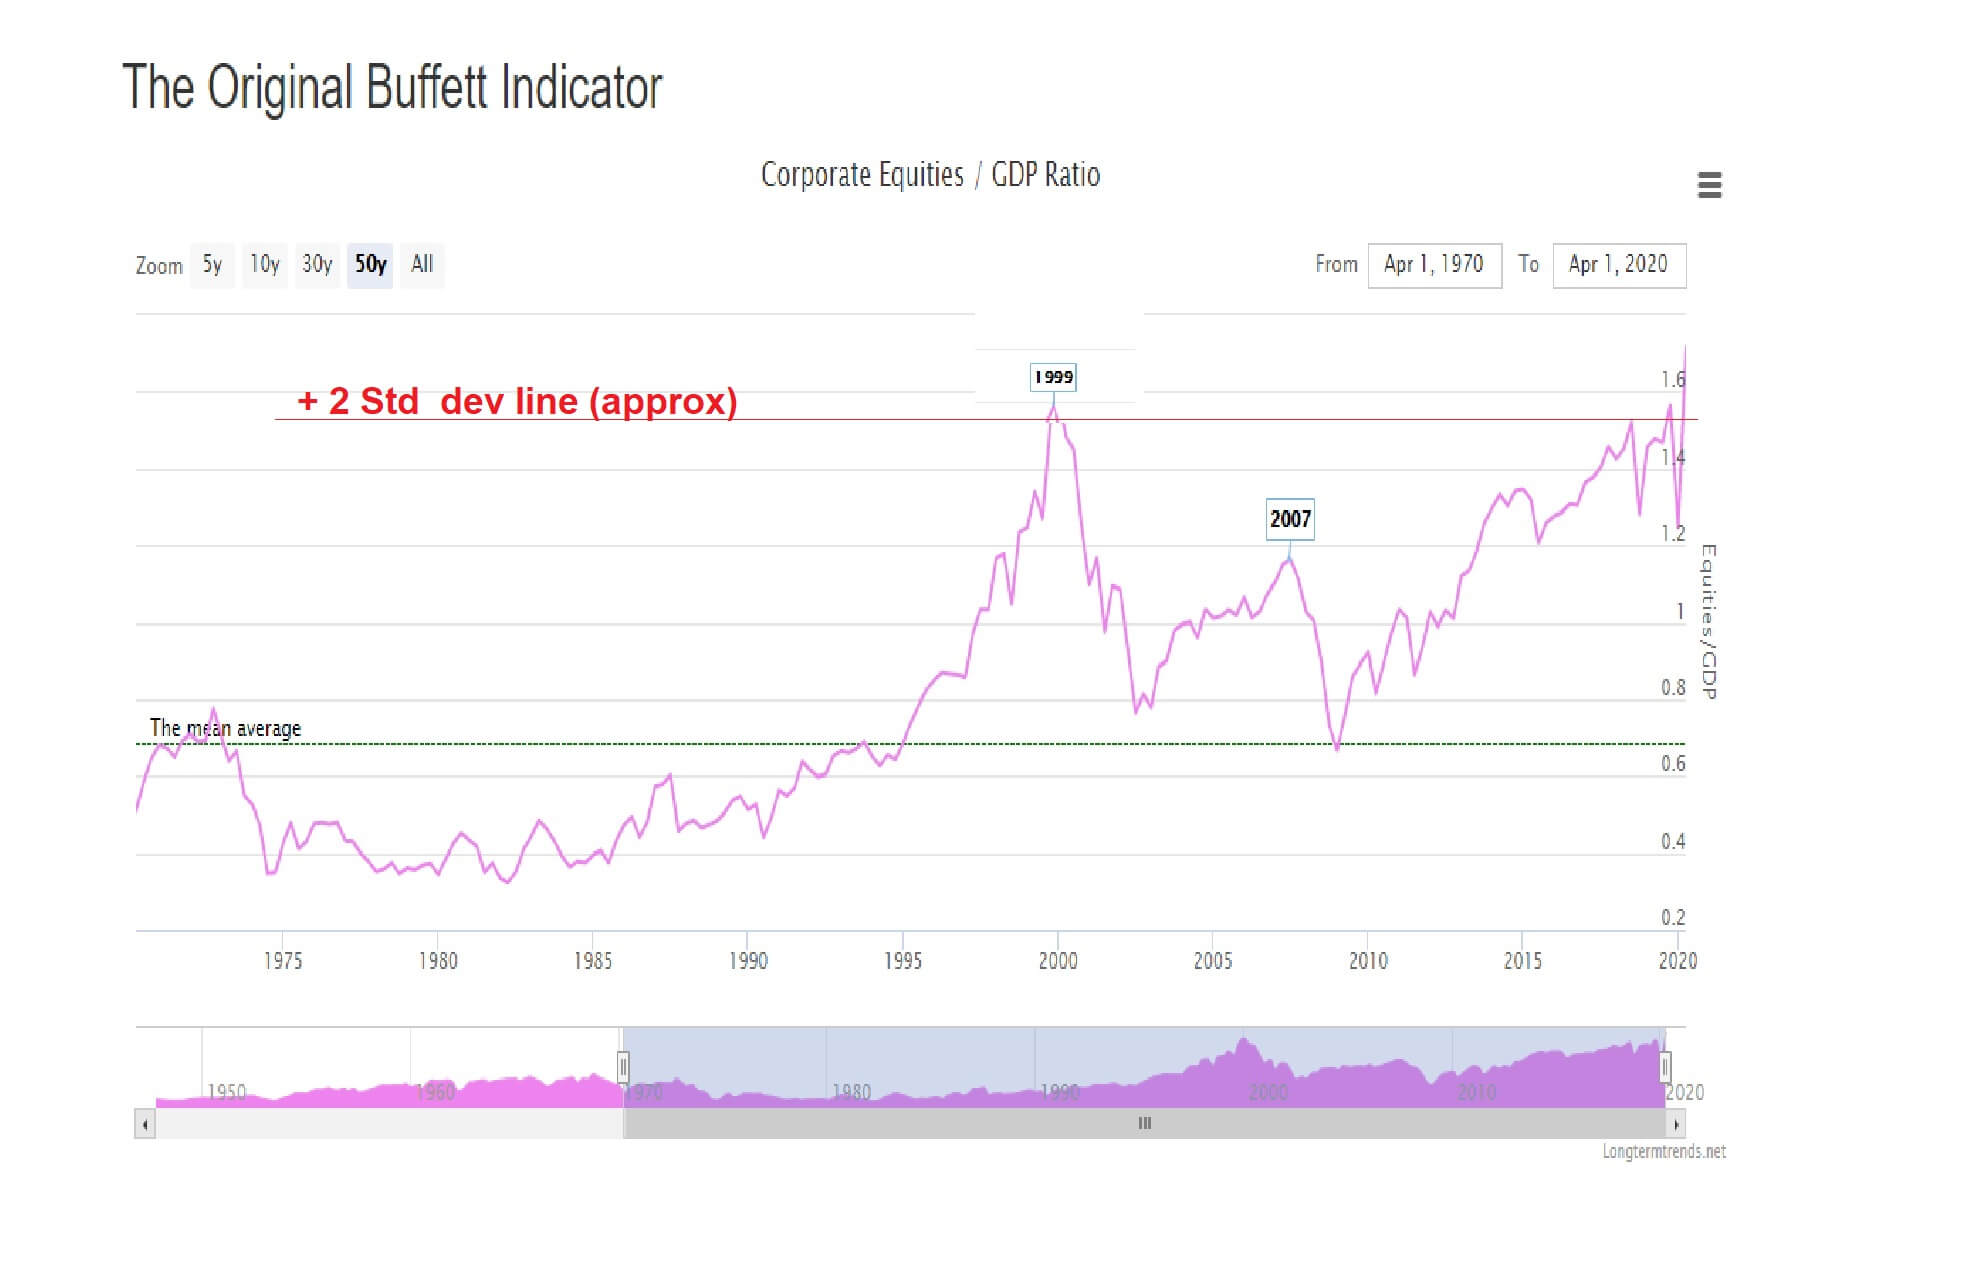
……and coincides with being above 2 standard deviations of the average range, which is an extremely rare occurrence.
And yet with the American economy still suffering from the pandemic, American corporations profit ratios are not reflective of consumer consumption, rather this time we have the Federal Reserve and US government stimulation packages which are churning out dollars into the market, and where investors are using much of those funds to push up the level of stocks due to FOMO, or fear of missing out. and where are the traditional corporate valuation matrix simply do not apply to certain stocks anymore.
Fear of a recurrence of the dot-com bubble correction, where investors ignored earnings per share valuations – many of these Dot-com firms were not making any profit at all – is another reason why we might potentially be looking at the top for stocks. Also, a fairly simple one; many of the favourites for investors, such as Amazon, Apple, and Tesla, for example, are not cheap anymore. This means that investors will be looking at cheaper stocks with growth potential, while others which are too expensive and are seen as potentially overbought. And in an economy which may not see growth return to any kind of normality for years, it adds weight to the thorny issue that the Dow Jones 30 industrial average – home to the top 30 most expensive stocks in the USA – and which is considered as a benchmark of the health of the US economy, may find buyers to be thin on the ground now, in which case a correction could be not too far away, based on everything set out in our assessment today.

Categories
Forex Market

Buy Now Because It´s ALL Cheap!

“Buy now because it’s ALL cheap!” This is a sentence we have heard hundreds of times and it must be said that the basis is correct. In the markets, you should buy when a stock is cheap and sell when it is expensive, Easy? Yes, but not simple.

Many small investors with little travel on the stock market think as follows:

Stock A a year ago was worth $20, today it’s worth $10. The small investor hastens to attribute this fall in price to the crisis, to the slump of the sector, to the inability of others to see the bullish potential of that multinational, etc… But there’s one thing you don’t take into account, why was that action worth $20 a year ago? It is not because of the crisis, the crisis is a consequence of the reason why it was worth 20$ the previous year, the real reason is a bubble, speculation, or price inflated by a false feeling of growth and well-being, call it what you want.

But well, the small investor is on the sidelines of all this and will make a lethal second step, the world’s biggest stock market fallacy will say:

“Man, a company this big and solid will sooner or later be worth $20 again.”

We could find a few thousand graphics with prices that have been quietly 3 or 4 years that have not been touched and may never touch again. Never fall into this fallacy, prices need not return to the levels of a few years ago, and if they do inflation and opportunity cost will have eaten away your investment in an overwhelming way.

To give you an example I propose a TEST:

Company X is listed at $300, 5 months later it is listed at $100:

  1. a) Buy shares because 100$ is cheap because it is three times cheaper!!
  2. b) Do not act because the stock has lost 66.6% of its value.

Company X is now listed at $50, what do you do?

  1. a) I buy shares because now company X is 6 times cheaper than before and clear, sooner or later we will be back to 300$ or more. I have also read some very positive news for the sector and an article where they leave this company as the one with the greatest potential.
  2. b) You are still on the sidelines, although everywhere you read that this action is a real bargain, Who would be the fool who would not buy at such a low price?

The action keeps cutting prices and now it’s only worth 5$ (Maybe I’m already exaggerating, right?)

  1. a) Man, at 5$, if before it was worth 300$ this is a safe investment, the day that this goes up I will retire directly.
  2. b) There is no sign of the price that the stock wants to go up and even knowing that the stock now “only” is worth 5$ you decide not to buy and let your friends laugh at your poor eyesight to invest in “safe securities”.

Finally, the share price is $1 What do you do now?

  1. a) You laugh and think “But how exaggerated, how will it cost $1 a share that was trading at $300?” “If this is like saying that Google quotes $1!”
  2. b) You’re still on the sidelines, we don’t have anything to buy even though the value has been devalued by 99.9% of the initial value and it looks like it can’t be worse.

Well, gentlemen, the story ends with quotes in the area of $0.2 or what’s the same, the price of 4 chewing gum per share.

Any one of you who has opted for option A in any of the cases would be almost bankrupt right now. Imagine the friend who bought 10000 shares at 1$ (10000Acc * 0.2$= 2000$). It has lost 80% of the money, nobody can stand a loss of this size, and surely in the 50-60% of losses, most of us would be out of the market complaining about the crisis, the governments, and the manipulation of the market.

I’m no longer talking about who bought for $100 or $50 by making a “long-term investment,” you can imagine that he will never see his money again. Well, maybe I was a little over the top when I said that the price could drop from $300 to 20 cents, something like this would never happen on the market… Would it? Remember, always use a system with technical foundations and operate with knowledge, never open an operation if you do not have clear where to place your Stop Loss.

Categories
Forex Videos

The Dow Jones Bull Trap! Don’t Get Caught Buyers!

Dow Jones Index – Bull Trap

A bull trap is a misleading signal which tells financial traders that an asset, which has recently fallen, has reversed and is currently heading upwards, when in fact, the asset will continue to decline. Thus trapping buyers who went long, often at the top of the rebound, only to go on to suffer losses when the asset crashes.
We may well find ourselves in such a situation with the Dow Jones Index currently.


This is a daily chart of the Dow Jones index, and we can see that after a record-breaking run during February 2020, when the American economy was flying high, it crashed to a low of 18.200 just a few weeks later after the outbreak of Covid-19 as the US shut down its economy to protect citizens. This is the first time their economy has been closed down by Government consent.

The Federal Reserve threw money at the economy in the form of reducing interest rates and massive rounds of financial relief packages worth over $3 trillion, so far, and yet still with the majority of the economy flatlining, the Dow Jones Index rallied to a recent high of 24.900. This was effectively a massive bull run during a slump. It caught a lot of investors off guard, many who were selling stocks and shares seem to have sold out too soon during the first crash down to 18.200. But will those investors who started buying again after that low now suffer as the index falls lower, or will we continue to see momentum to the upside?

The issue for investors, as the Dow sits at 23.650 level, is that Banks are not paying dividends to investors this year as they try to shore up losses caused by the pandemic. This makes bank stock highly unattractive to traditional investors who would previously buy such stocks while accepting the risk of a potential fall in stock value while receiving dividend payments. They were happy to ride out any financial storms while waiting for better times ahead after the economy recovers and thus a return in the share price.
However, this crisis is not the same as the financial crisis in 2008, where investors such as Warren Buffet piled in through his investment vehicle, Berkshire Hathaway, to pick the stock up cheaply looking for long term growth. Boy, did he do well when the economy went on to surge higher?

However, Berkshire Hathaway has suffered heavy losses in this current crash, having lost an estimated $50 billion, and Mr. Buffet claims to have made a mistake in buying airline stocks and has just sold 84% of his stake in Goldman Sachs, the darling of the Wall Street investment banks. Could the writing be on the wall for US stocks now? He said that while the trains had come off the tracks in 2008, they are currently in the sidings in this event.

So, with over 20 million currently unemployed, GDP at -4.8% for March, manufacturing down, Government debt growing, and with 1.5 million cases of Covid-19 and almost 90 thousand poor souls having lost their lives, what on earth seems so attractive about buying US stocks right now?
The simple truth is that there are more buyers than sellers right now, many investors believing that the economy will bounce back quickly after similar health crises, such as Ebola, Sars Bird Flu, and Zika, where there were crashes in stocks but where they quickly recovered. And also where firms and

executives of those firms have bought their own stock on the dip lower. Some economists believe there will be a V-shaped recovery: a quick fall and a quick recovery. This sort of talk causes F.O.M.O or fear of missing out, a very big reason why we see such rallies, as they pile in buying up stock believing that the worst is over.


This is the number one reason that stocks are getting bought while the news is getting worse. But the elephant in the room is Covid-19 is still an unknown disease and the moment markets hear of second waves they will drop stocks like hot potatoes. There will highly come a time, very shortly, which will be the straw that broke the camel’s back, bringing the current bull run to a crashing end. And that will confirm what we see as a bull trap.

Categories
Forex Videos

The Stock market Bubble Is Real! Is It Time To Pull The Plug?

Are Stocks In A Helium Bubble?

During the fall of the Roman Empire, Romans of wealth, including high-level soldiers, melted down silver Roman coins because they could see the end of the empire coming. They were effectively converting out of cash and into a precious metal. They knew the value of silver, no matter what.

A few months ago, when the Covid-19 virus started to take hold in China and especially when it hit Italy, sharp investors bailed out of stock markets and converted their investments into US treasury bills and also cash. INSERT B: Shortly afterwards the main Stock indices crashed with the biggest hit to the Dow Jones 30, which tanked from above 29.000 to 18.200 at its low point. The Federal Reserve, along with other major Western governments, acted quickly and reduced interest rates and pumped as much money as possible into economies to try and limit the damage, where the majority of the world was in a state of lockdown, and all but essential business were closed. The global economy was flatlining, going into recession, and is currently facing the biggest economic disaster which this world has ever known.


And yet, in the last few weeks global indices, especially the Dow Jones, INSERT 1 S&P 500, the INSERT 2 German Dax and INSERT 3 the FTSE INSERT 4 have rebounded off of their lows and incredibly are in what can only be termed as a bull run. With no end in sight to the Covered-19 crisis and no cure on the horizon, and where economic production and gross domestic product are tanking, how can stock indices be riding on a high?

This can be down to a couple of reasons, f o m o: Fear of missing out, where investors are diving back and picking up what they see as cheap stocks under the old adage; buy at the bottom and sell at the top, and where Executives have also picked up stock in their own firms. Another reason can be put down to automatic trading algorithms which simply have no rationale when it comes to fundamentals, they have no empathy with people that are affected by this disease, they have no consideration of flatlining economies and negative GDP’s, they are simply programmed to buy and sell on whatever technical trading criteria the programmer sets.

The upshot is that a bubble has been created in these indices, where artificially inflated stocks are floating well above where they should be, in some kind of helium bubble. And we all know what happens to bubbles: they burst.
Stock markets, and the companies which are contained within, grow on consumer demand and while consumers are currently buying their necessities like food, medicine, electricity, gas; the basics, in other words, they certainly are not buying luxury items including cars, holidays abroad including airline flights, on cruise liners, or requiring hotels. And they are not going out to restaurants or cinemas, and they are not buying petrol for their cars because most of them are in lockdown. They aren’t moving house, and the financial services sector, in terms of lawyers and mortgage underwriters, are affected. And of course, all of this has a knock-on effect on those companies, which means they cannot grow, and which means that essentially their stock value should be crashing through the floor. And yet here we are in a bull run.

There is an old adage: the writing is on the wall, and when oil prices crashed this week and turned negative for the first time in history, it sent a chill through the spines of investors that told them that the financial markets were on borrowed time. While the oil market crash was said to be on a technicality, due to a futures contract for May which established that there was insufficient oil storage capacity, which sent oil prices to minus $40 Per barrel for West Texas Intermediate, and where we have seen a slight rebound in June contract prices, what do you think is going to happen when this maturity comes up.

There will still be an oversupply of oil in a marketplace that doesn’t need it because it’s in lockdown, there will still be a lack of storage capacity in a purpose-built facility such as Cushing, Oklahoma and around the world, so expect more jitters there. And of course, the longer the Covid-19 virus continues, the more likely that the stock market bull run is going to end with a flash bang wallop.
And of course, because all of the financial markets are so closely interconnected, we can only expect extreme volatility to spill over into the foreign exchange market.

Categories
Crypto Videos

Trading Stocks & Forex vs Trading Cryptocurrencies – what Is Best For The Every Day Trader


Trading stocks and FOREX vs. trading cryptocurrencies

Many people are wondering if trading cryptocurrencies can match trading stocks or FOREX in terms of profit potential. Many factors affect traders’ choice on which market to trade. Whether it is the liquidity of the market, volatility, or simply the ease of access to the profit-making trade, everything, and anything can influence that decision. We can certainly point out a few factors that differentiate stocks or FOREX to cryptocurrency trading.

Ease of access

When it comes to trading, the ability to start the process fast and without any issues should be a priority. When it comes to stocks and FOREX trading, trading software is expensive and requires a lot of paperwork and time. It is also demanding in terms of computer performance. On the other hand, cryptocurrency exchanges and trading platforms offer a quick and painless registration process as well as the ability to trade from any device in most cases.


Stockbrokers also have a day-trading rule, which requires accounts to have more than $25,000 balance in order to day trade. This rule is called “pattern day trading rule” and is created by FINRA (Financial industry regulatory authority) to stop people from day trading stocks with no intention of supporting the companies or investing into their stocks for the longer term. This makes the barrier to enter the “playing field” when it comes to trading stocks much higher.

Volatility

Volatility is the single most important indicator when deciding whether something is tradable or not. It signifies the price oscillation of the tradable asset. The more volatile the asset is, the more profit potential it has. It is safe to say that cryptocurrencies are far more volatile than stocks or FOREX, and still have enough volume for traders to avoid any form of slippage. Markets like FOREX or the big stock indexes are safer, but also much slower.
We can compare the NYSE FANG+ index, which consists of the biggest tech companies: Facebook, Amazon, Netflix, Google, Alibaba, Baidu, Nvidia, Tesla, and Twitter. This stock index has returned a total of 21.65% annualized total return, starting from September 19, 2014, until October 31, 2019. It has outperformed the NASDAQ-100 index and S&P500 index by a large margin. Still, when compared to the return Bitcoin has made from September of 2014, it is not even close.


Market liquidity and market depth

Bitcoin and the cryptocurrency market have a decent market size, but not close to anything like FOREX. FOREX is by far the biggest tradable market in the world. It trades 5.3 trillion dollars each day. However, even though the cryptocurrency market is a lot smaller, it has no liquidity issues. Both markets are liquid, and the market depth is good enough, so the traders do not have to worry about their orders not being filled, or any form of slippage. As far as liquidity goes, any market liquidity that does not allow for slippage and sudden non-fluid jumps in price are good enough for trading.

Institutional involvement

Institutions are trading every form of asset and commodity they can earn money on. However, the cryptocurrency market is still young and fairly free of institutional manipulation. There is no denying that institutions manipulate the order books and use the latest software and the best technology to create a trading “edge.” This makes trading traditional assets extremely hard. FOREX is especially filled with algorithmic robot-trading and market manipulation (to a degree), which destroys all profit potential traders should have. According to data gathered by Morton Glantz and Robert Kissell, the percentage of algorithmic trading in FOREX is ranging from 85% to 90%. On the other hand, algorithmic trading in cryptocurrencies is minuscule compared to the numbers FOREX shows. Competing with machines that are analyzing as well as entering/exiting positions faster than any human can be extremely hard.


Regulation

When compared to FOREX and stock trading, cryptocurrency markets are less regulated. This gives many platforms a chance to rise and try to offer the best options for the traders, as it is much easier to create a cryptocurrency trading platform than a FOREX brokerage firm. However, quantity does not mean quality. Only a few exchanges are offering innovative and good options to their customers. Most trading platforms offer crypto traders 100x leverage on their traders, among other options, making it much easier to start with less money and profit more from small movements in price.

Uptime

Quite simply, cryptocurrency trading is available every minute, hour, and every day. There is no downtime, not even for holidays. FOREX markets, on the other hand, are not tradable on weekends, while stock markets have trading hours each day. Why should a trader lose two trading days a week in case of FOREX, or even more when it comes to stocks? Most retail traders are trading only part-time, and this gives them the option to be more involved in trading, as the markets are available and tradable at all times.

Conclusion

Every trader needs to decide how much risk he or she can handle. Trading cryptocurrencies is a bit riskier but brings massive profit potential. On the other hand, investing in stock indexes or FOREX can bring constant minute profits over a longer period.

Categories
Forex Market Analysis

DAILY ABSTRACT – 16th February 2018

Hot Topics:

  • JPY – USDJPY decorrelated with Nikkei Index.
  • DOW – Dow Jones again exceeds 25,000 pts.
  • STOCKS – Netflix incorporates Ryan Murphy into their team.


MAIN CURRENCIES DAILY PERFORMANCE.


JPY – USD-JPY decorrelated with Nikkei Index.

The Yen <JPY> had the best performance against the Greenback <USD> in the day, advancing 0.78%, while the USD Dollar Index has fallen 0.47%. However, this week the Nikkei 225 <JPN225> has developed a lateralisation structure while most indices advanced, recovering losses last week. On the other hand, the USDJPY has continued to fall for the fourth consecutive session.

Our view of this divergence in the correlation between the Nikkei Index and the USDJPY is that it should be eliminated again by converging the correlation between both instruments in favour of the trend that indexes are presenting at a general level.


MAIN INDICES DAILY PERFORMANCE


DOW – Dow Jones again exceeds 25,000 pts.

The industrial index Dow Jones 30 <US30> has escalated and exceeded the psychological level of 25,000 pts, climbing to 25,258 pts (1.50%) in its fifth session of gains. The Nasdaq 100 <NAS100> technological index, meanwhile, has exceeded last week’s losses, advancing over 2 percent on the session.

In the technical scenario, we continue to see a bullish continuation, the levels to be controlled as resistance are 25,539.9 and 26,138.7 pts.


US STOCKS DAILY PERFORMANCE


STOCKS – Netflix incorporates Ryan Murphy into their team.

The online broadcast company announced on Tuesday night that it will incorporate producer Ryan Murphy to produce new series and original Netflix films. The agreement with the producer who currently works with 20th Century Fox has a cost $300 million, according to two people who know about the agreement. According to Ted Sarandos, the Netflix head of content, “Murphy has influenced the world’s cultural spirit, has reinvented genres and changed the course of television history.”

In the technical side, Netflix <NFLX> climbed 4.62%, bringing it close to historical highs, Goldman Sachs <GS> on January 23 updated its buy recommendation with a target of $250 to $315. If NFLX breaks above the resistance level of $286.81, the next resistance level is $300 as a psychological level. If it does not fall and consolidate below $236, we only consider bullish positions.