Categories
Forex Videos

The Dow Jones Bull Trap! Don’t Get Caught Buyers!

Dow Jones Index – Bull Trap

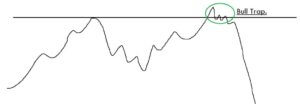
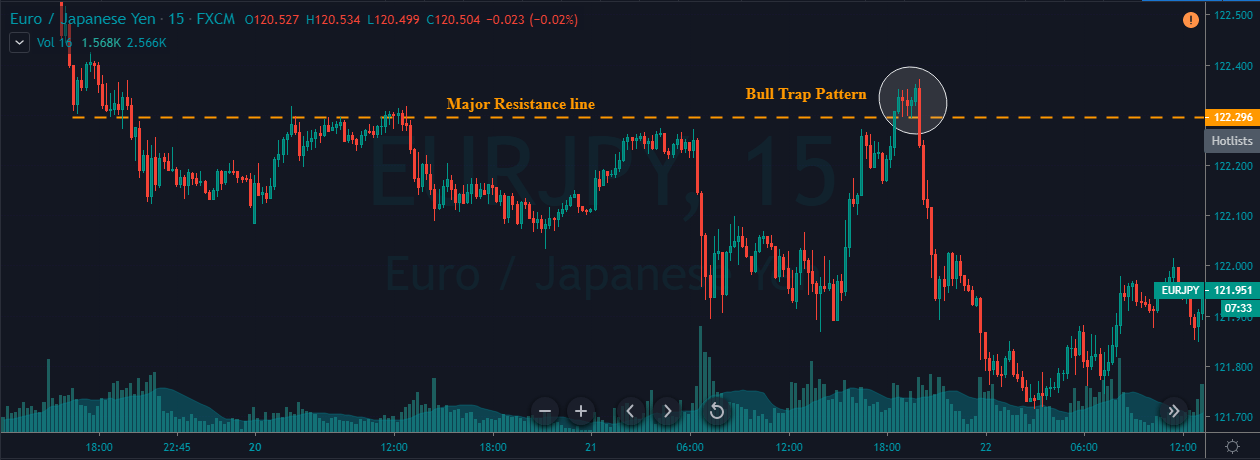
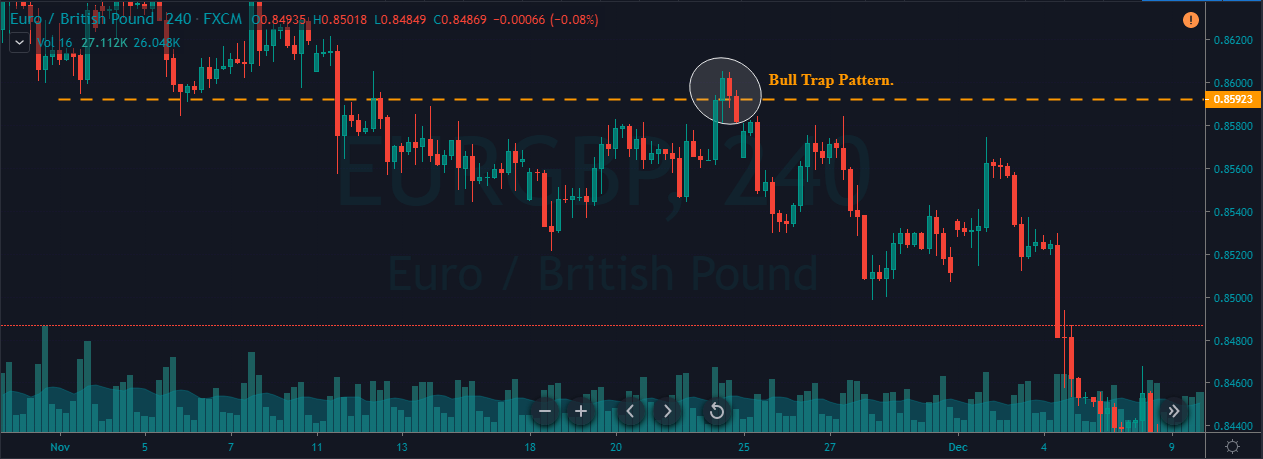
A bull trap is a misleading signal which tells financial traders that an asset, which has recently fallen, has reversed and is currently heading upwards, when in fact, the asset will continue to decline. Thus trapping buyers who went long, often at the top of the rebound, only to go on to suffer losses when the asset crashes.
We may well find ourselves in such a situation with the Dow Jones Index currently.


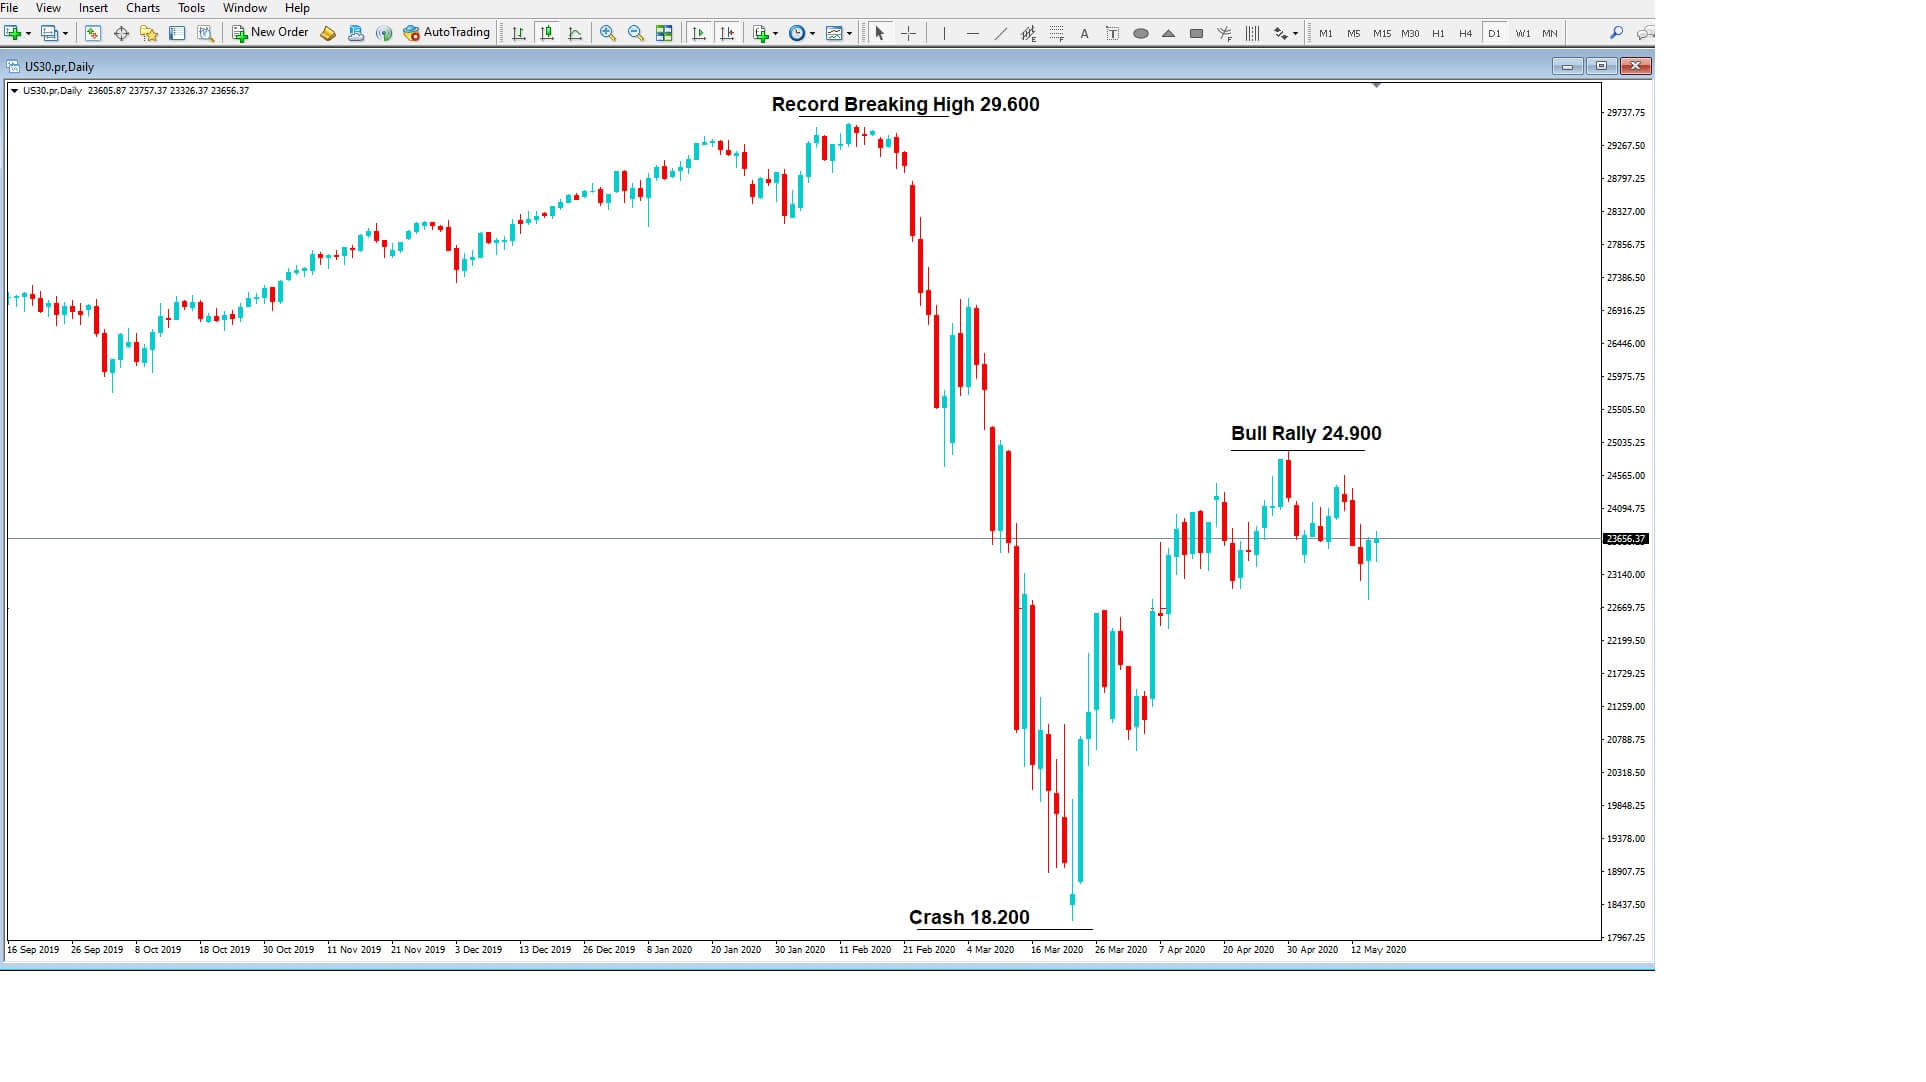
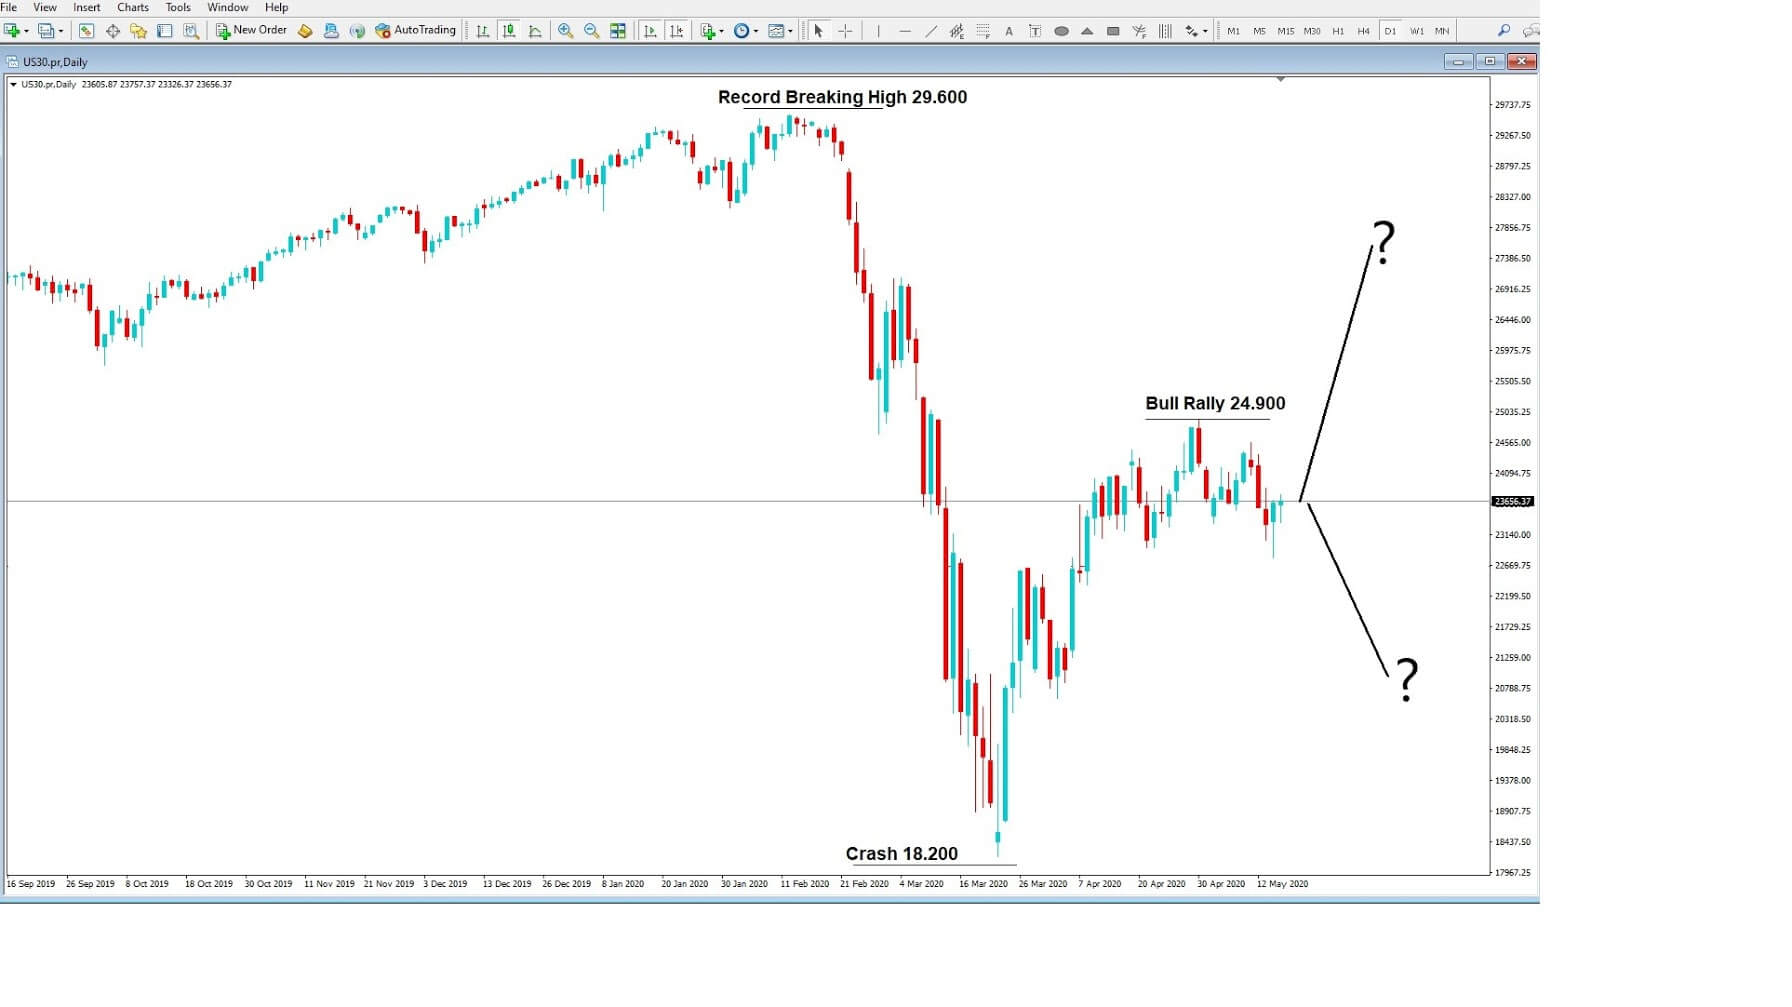
This is a daily chart of the Dow Jones index, and we can see that after a record-breaking run during February 2020, when the American economy was flying high, it crashed to a low of 18.200 just a few weeks later after the outbreak of Covid-19 as the US shut down its economy to protect citizens. This is the first time their economy has been closed down by Government consent.

The Federal Reserve threw money at the economy in the form of reducing interest rates and massive rounds of financial relief packages worth over $3 trillion, so far, and yet still with the majority of the economy flatlining, the Dow Jones Index rallied to a recent high of 24.900. This was effectively a massive bull run during a slump. It caught a lot of investors off guard, many who were selling stocks and shares seem to have sold out too soon during the first crash down to 18.200. But will those investors who started buying again after that low now suffer as the index falls lower, or will we continue to see momentum to the upside?

The issue for investors, as the Dow sits at 23.650 level, is that Banks are not paying dividends to investors this year as they try to shore up losses caused by the pandemic. This makes bank stock highly unattractive to traditional investors who would previously buy such stocks while accepting the risk of a potential fall in stock value while receiving dividend payments. They were happy to ride out any financial storms while waiting for better times ahead after the economy recovers and thus a return in the share price.
However, this crisis is not the same as the financial crisis in 2008, where investors such as Warren Buffet piled in through his investment vehicle, Berkshire Hathaway, to pick the stock up cheaply looking for long term growth. Boy, did he do well when the economy went on to surge higher?

However, Berkshire Hathaway has suffered heavy losses in this current crash, having lost an estimated $50 billion, and Mr. Buffet claims to have made a mistake in buying airline stocks and has just sold 84% of his stake in Goldman Sachs, the darling of the Wall Street investment banks. Could the writing be on the wall for US stocks now? He said that while the trains had come off the tracks in 2008, they are currently in the sidings in this event.

So, with over 20 million currently unemployed, GDP at -4.8% for March, manufacturing down, Government debt growing, and with 1.5 million cases of Covid-19 and almost 90 thousand poor souls having lost their lives, what on earth seems so attractive about buying US stocks right now?
The simple truth is that there are more buyers than sellers right now, many investors believing that the economy will bounce back quickly after similar health crises, such as Ebola, Sars Bird Flu, and Zika, where there were crashes in stocks but where they quickly recovered. And also where firms and

executives of those firms have bought their own stock on the dip lower. Some economists believe there will be a V-shaped recovery: a quick fall and a quick recovery. This sort of talk causes F.O.M.O or fear of missing out, a very big reason why we see such rallies, as they pile in buying up stock believing that the worst is over.


This is the number one reason that stocks are getting bought while the news is getting worse. But the elephant in the room is Covid-19 is still an unknown disease and the moment markets hear of second waves they will drop stocks like hot potatoes. There will highly come a time, very shortly, which will be the straw that broke the camel’s back, bringing the current bull run to a crashing end. And that will confirm what we see as a bull trap.

Categories
Forex Basic Strategies

Identifying & Trading The Bull Trap Pattern In The Forex Market

Introduction

A Bull Trap is one of the unique patterns that can be found in the Forex market. This pattern is comprised of two highs were the second high is failing to hold higher, and as a result, prices push to the new low. Unlike most of the patterns, a Bull Trap pattern generates false buying signals and indicate us to be cautious when we identify this pattern on the price charts. Hence it is also known as a whipsaw pattern.

The up-move that happens trick the buyers & investors into making bullish trades as they look identical to a buy signal. But the signal is not real, and they end up generating losses on long positions. Traders must seek confirmation after the breakout so that they can filter out these false buying signals and escape the Bull Trap. Bear Trap is the opposite of the Bull Trap pattern, which occurs when sellers fail to hold the prices below the break down level.

Psychology Behind The Bull Trap Pattern

The markets will be in a downtrend printing brand new lower lows & lower highs continuously. The price action then hits the major resistance level and starts pulling back. When the pullback begins to struggle, some of the aggressive traders and investors tend to take their long positions. Then, suddenly, one strong candle breaks the resistance line with power.

At that stage of the market, emotions are on a peak point, so as a result, most of the traders take buy entries believing the breakout. The market then prints one red candle, and the price action respects the resistance level and starts to hold below the resistance level. At this point, most of the trader will be hoping for the market to go up, but the prices roll into the sell-side.

How Does The Bull Trap Occur?

Example 1

As we can see in the below 15-minute EUR/JPY Forex chart, price action hits the resistance line twice, but both the times it failed to break the line. However, the third-time, price action broke the major resistance line with power. This would have resulted in most of the traders taking their long positions. When the four small candles held above the resistance line, it gives extra confirmation to the traders to buy this currency pair, but that was just a trap by the sellers. After some time, the price action dropped back, and that would affect most of the traders’ emotions negatively.

This kind of situation is common, and sometimes novice traders tend to immediately jump to the opposite side. But for professional traders, their emotions never play a role in decision making. So never take the opposite trade if that is not a part of your plan. In the above chart, we shouldn’t be going short unless the second or third bearish candle is formed after the beginning of a downtrend.

Example 2

In the below EUR/GBP chart, the pair was in an overall downtrend. During the pullback phase, when price action reached the major resistance area, most of the amateur traders visually see that as a bullish market. Price action respects the resistance line twice, but on the 25th of Nov, when strong buyers broke the resistance line, it creates the illusion of a buy signal in this pair.

But the buyers failed to hold the price higher, and the very next candle pushed the price below the resistance line. When the price broke the resistance line, amateur traders activate their buy trades. Still, technical traders will always wait for the prices to hold above the resistance line and take the buy entry only after the confirmation. In this example, prices never held above the resistance line, so there was no trade buy trade for professional traders. On the other hand, inexperienced traders end up booking losses.

Trading The Bull Trap Pattern

In the above examples, we discussed how to identify the Bull Trap pattern. Now, let’s understand how to trade this pattern. In the below EUR/AUD Forex chart, the price action tried to break the resistance line twice, but both of the time buyers failed to perform. On the 3rd of Jan, buyers broke the resistance line with some strong power. After the break, inexperienced traders would have activated their buy positions. But always keep in mind that the breakout never confirms the buy entry. We should be keeping a close look at the price after the breakout and only trade once we get the confirmation.

As you can see in the above chart, after the breakout, many candles held above the resistance line. After watching close to fifteen candles, we can confirm that the resistance has turned to support. The hold after the breakout confirms that the sellers failed to take prices lower.

Entry, Stop-Loss & Take-Profit

When buyers held the prices above the resistance line for a while, it is a clear indication of a buy signal. So now we enter the market as soon as the confirmation is done. We have decided to go for a smaller stop-loss because the hold confirms that the sellers left the ground.

Our take-profit is at the higher timeframe resistance area. We can see the price dropping back right after our take-profit level as the price tested the resistance line. Interestingly, a bull trap pattern is formed again above our take-profit order. This is the ideal way to trade this pattern, and most of the professional traders follow the same. Patience is the key to trade the Forex market. If you are patient enough to follow all the rules of the game, you will win for sure.

Conclusion

Bull Trap occurs when the prices fail to hold above the breakout. It could happen for various reasons. Some of them are buyers not being interested in pushing the prices higher, or they might have been booking the profits. On the other hand, professional sellers might have jumped into the market to take sell trades. As a result, they end up dropping the prices below the resistance levels, which will eventually result in triggering the stop-loss orders of the trapped buyers.

The best way to identify the Bull Trap pattern is to analyze the momentum of the buyers in the Forex market. If the buyers fail to hold the prices above the breakout, do not take long positions and never let the emotions drive your decision making.