US stock market: Are investors walking into a trap?
Thank you for joining this forex academy educational video.
In this session, we will be looking at US stock markets, which have rocketed to historic highs, even though the United States economy is in the grip of the Coronavirus.
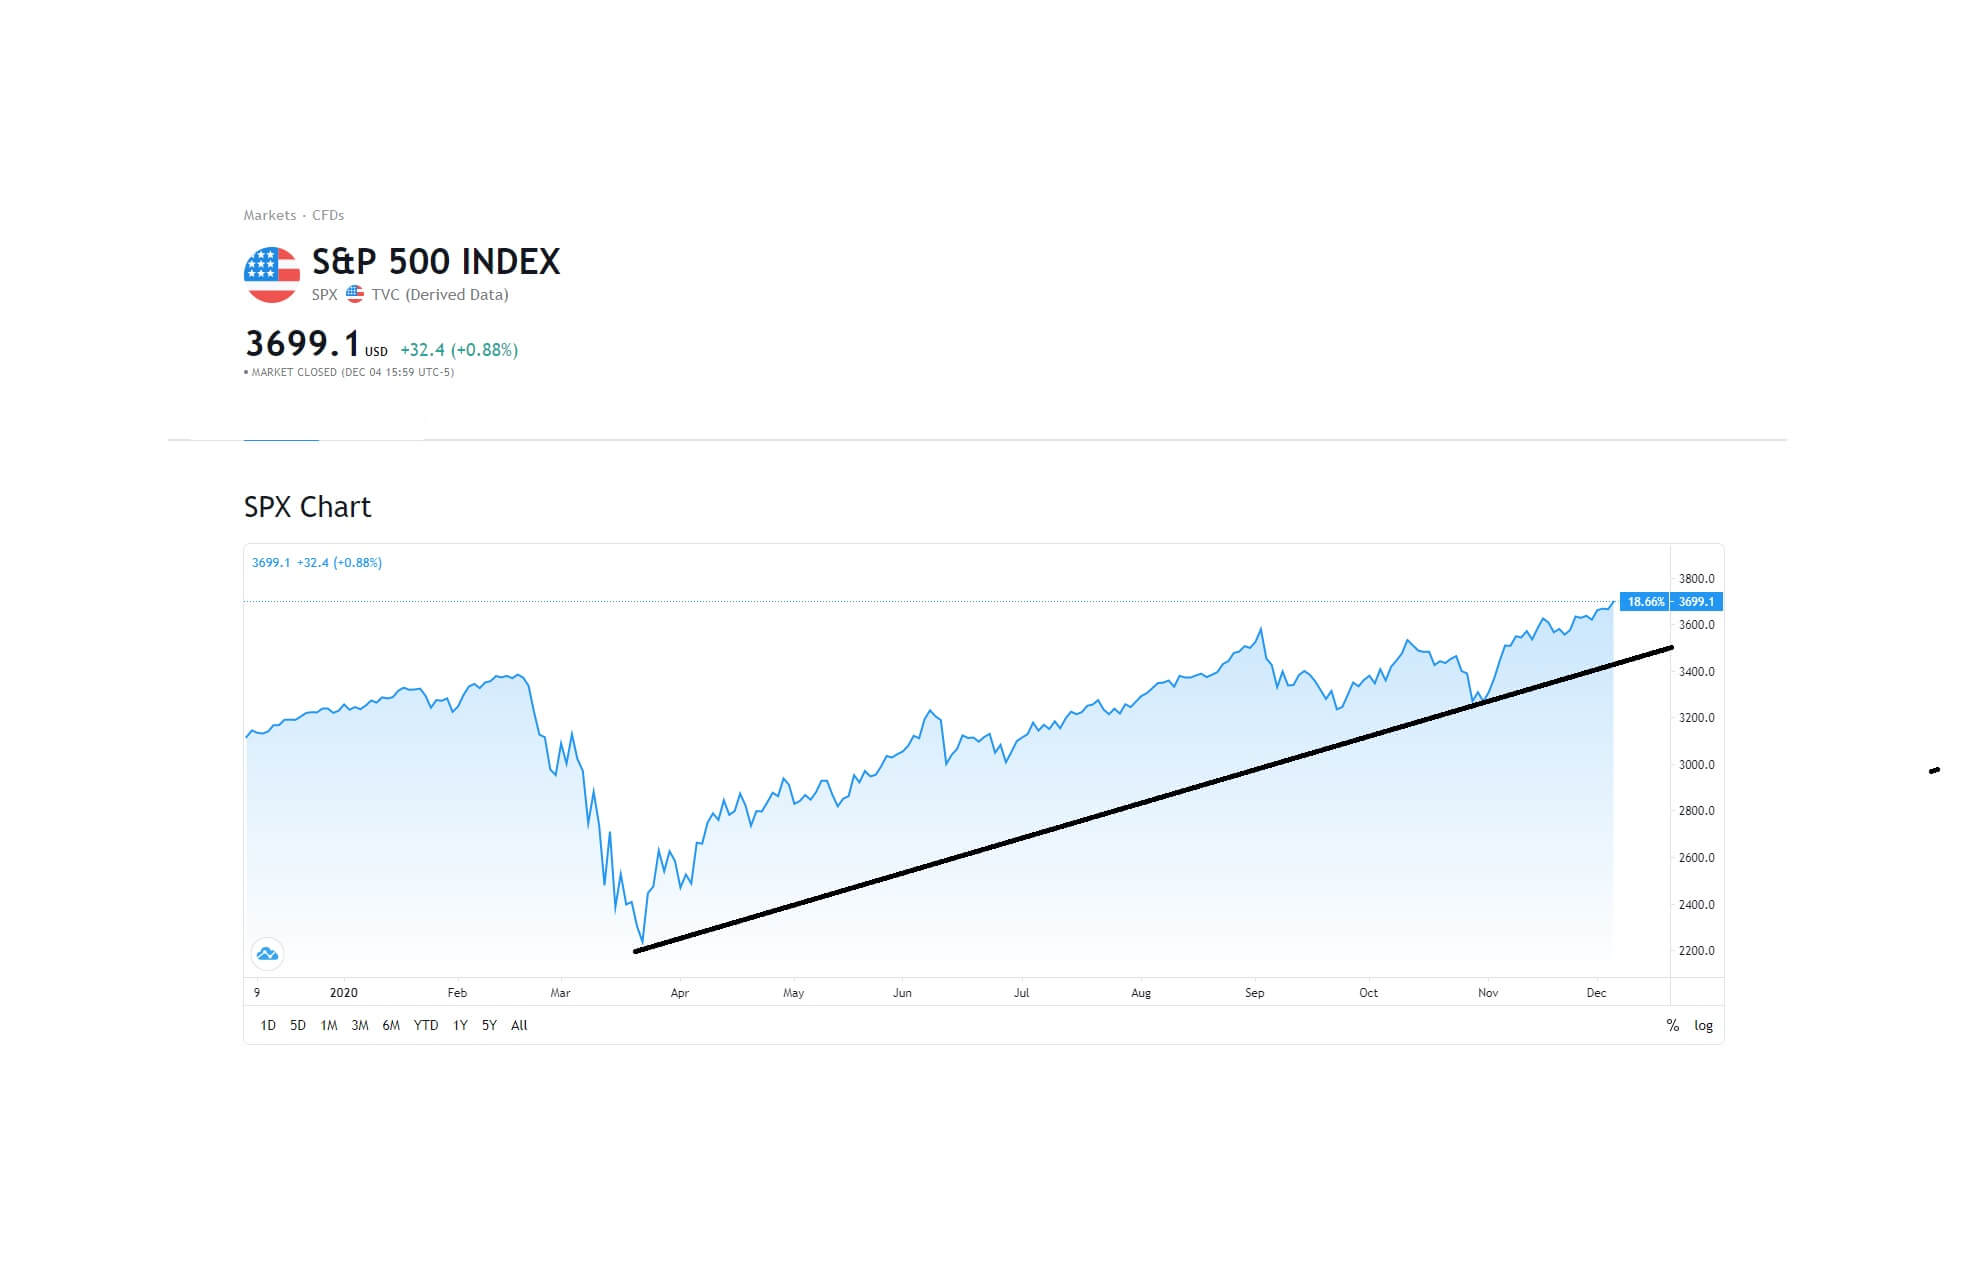
On Friday the 4th December, just post the non-farm payroll numbers, the S&P 500 index reached an all-time record high…
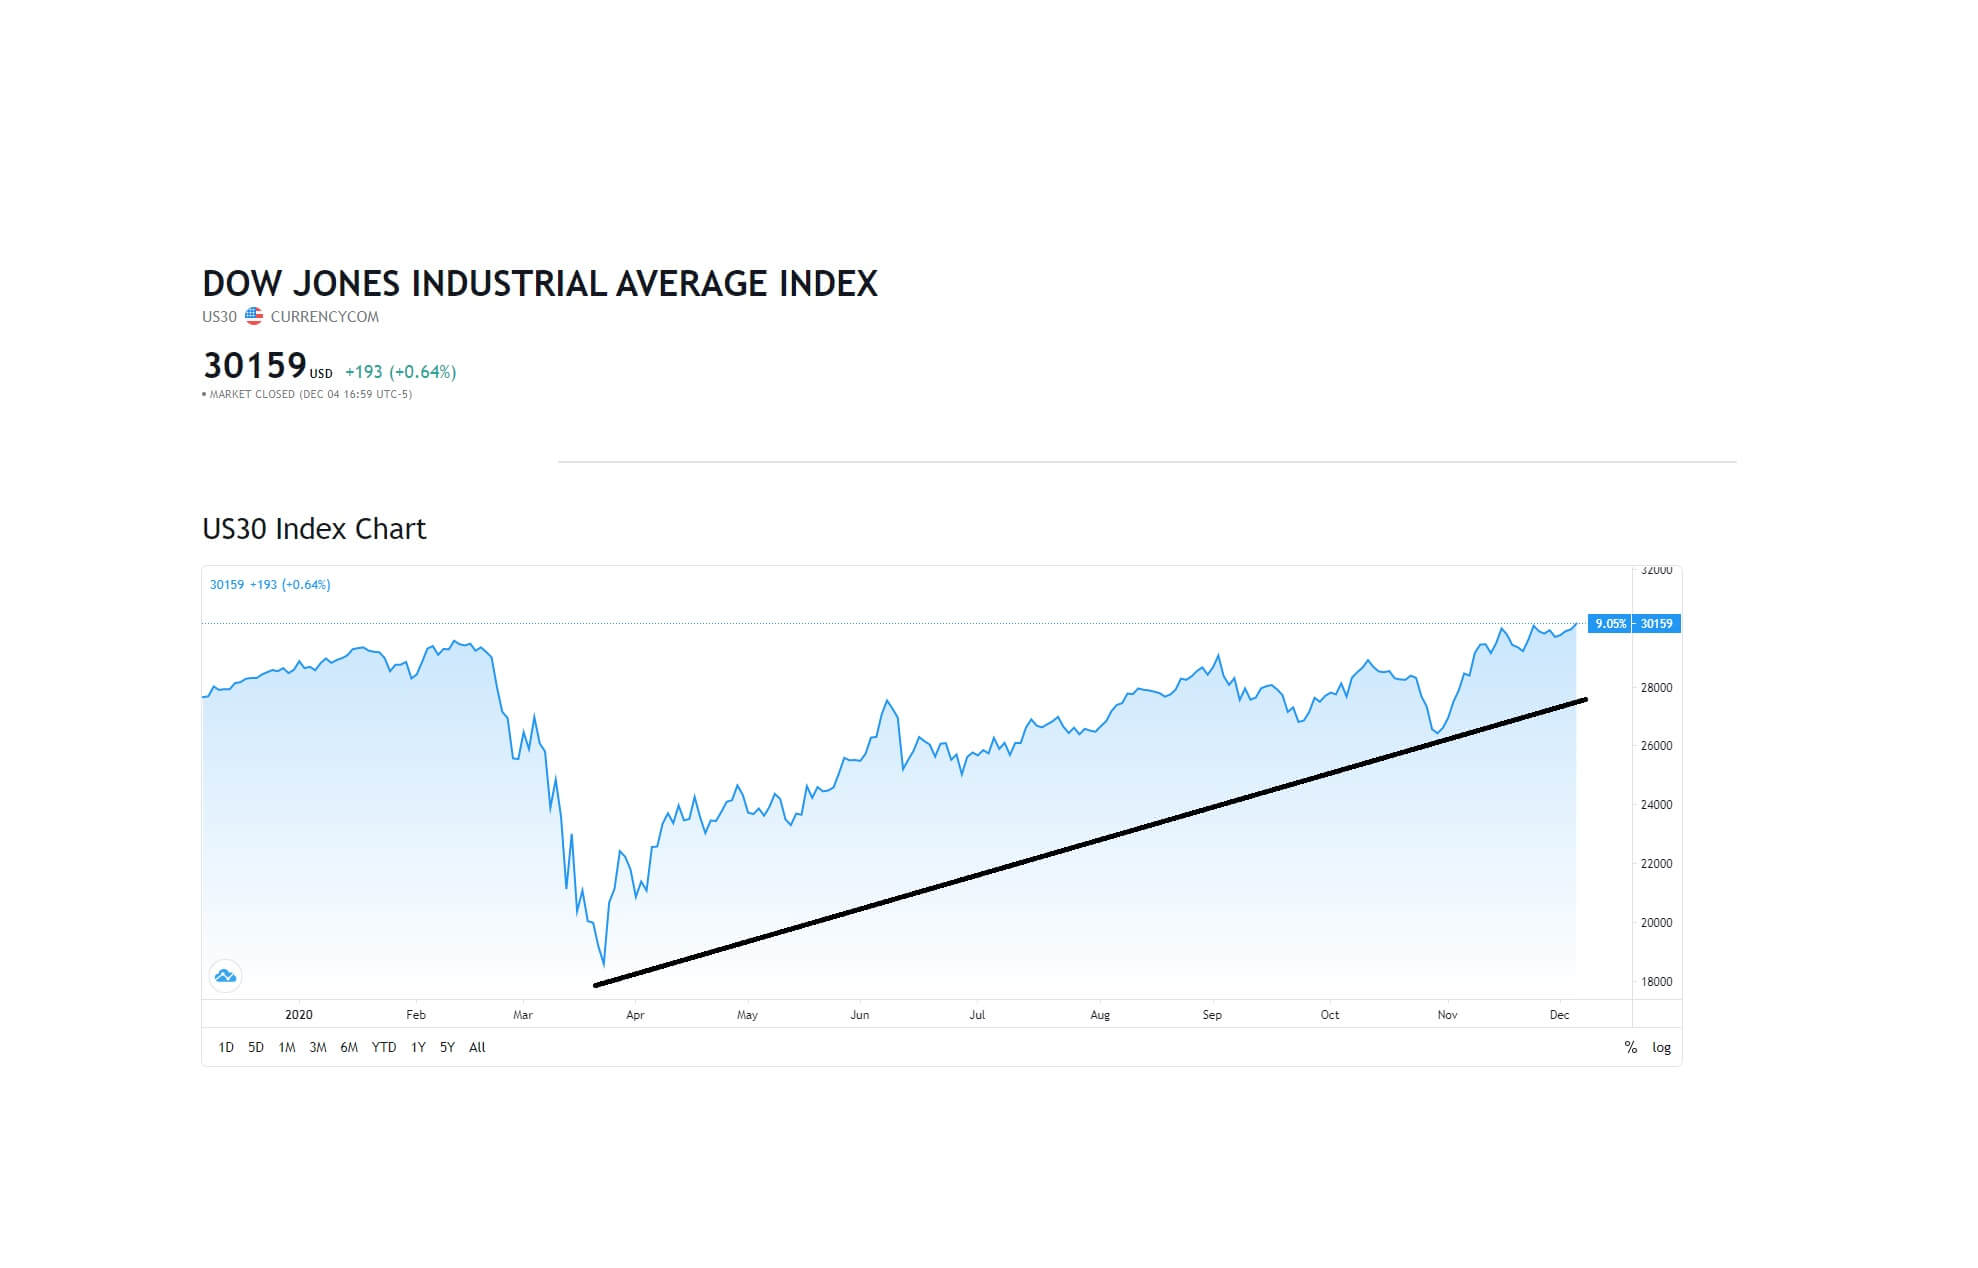
….this was also the case for the DOW Jones 30 industrial average…….
….the NASDAQ Composite index followed suit …….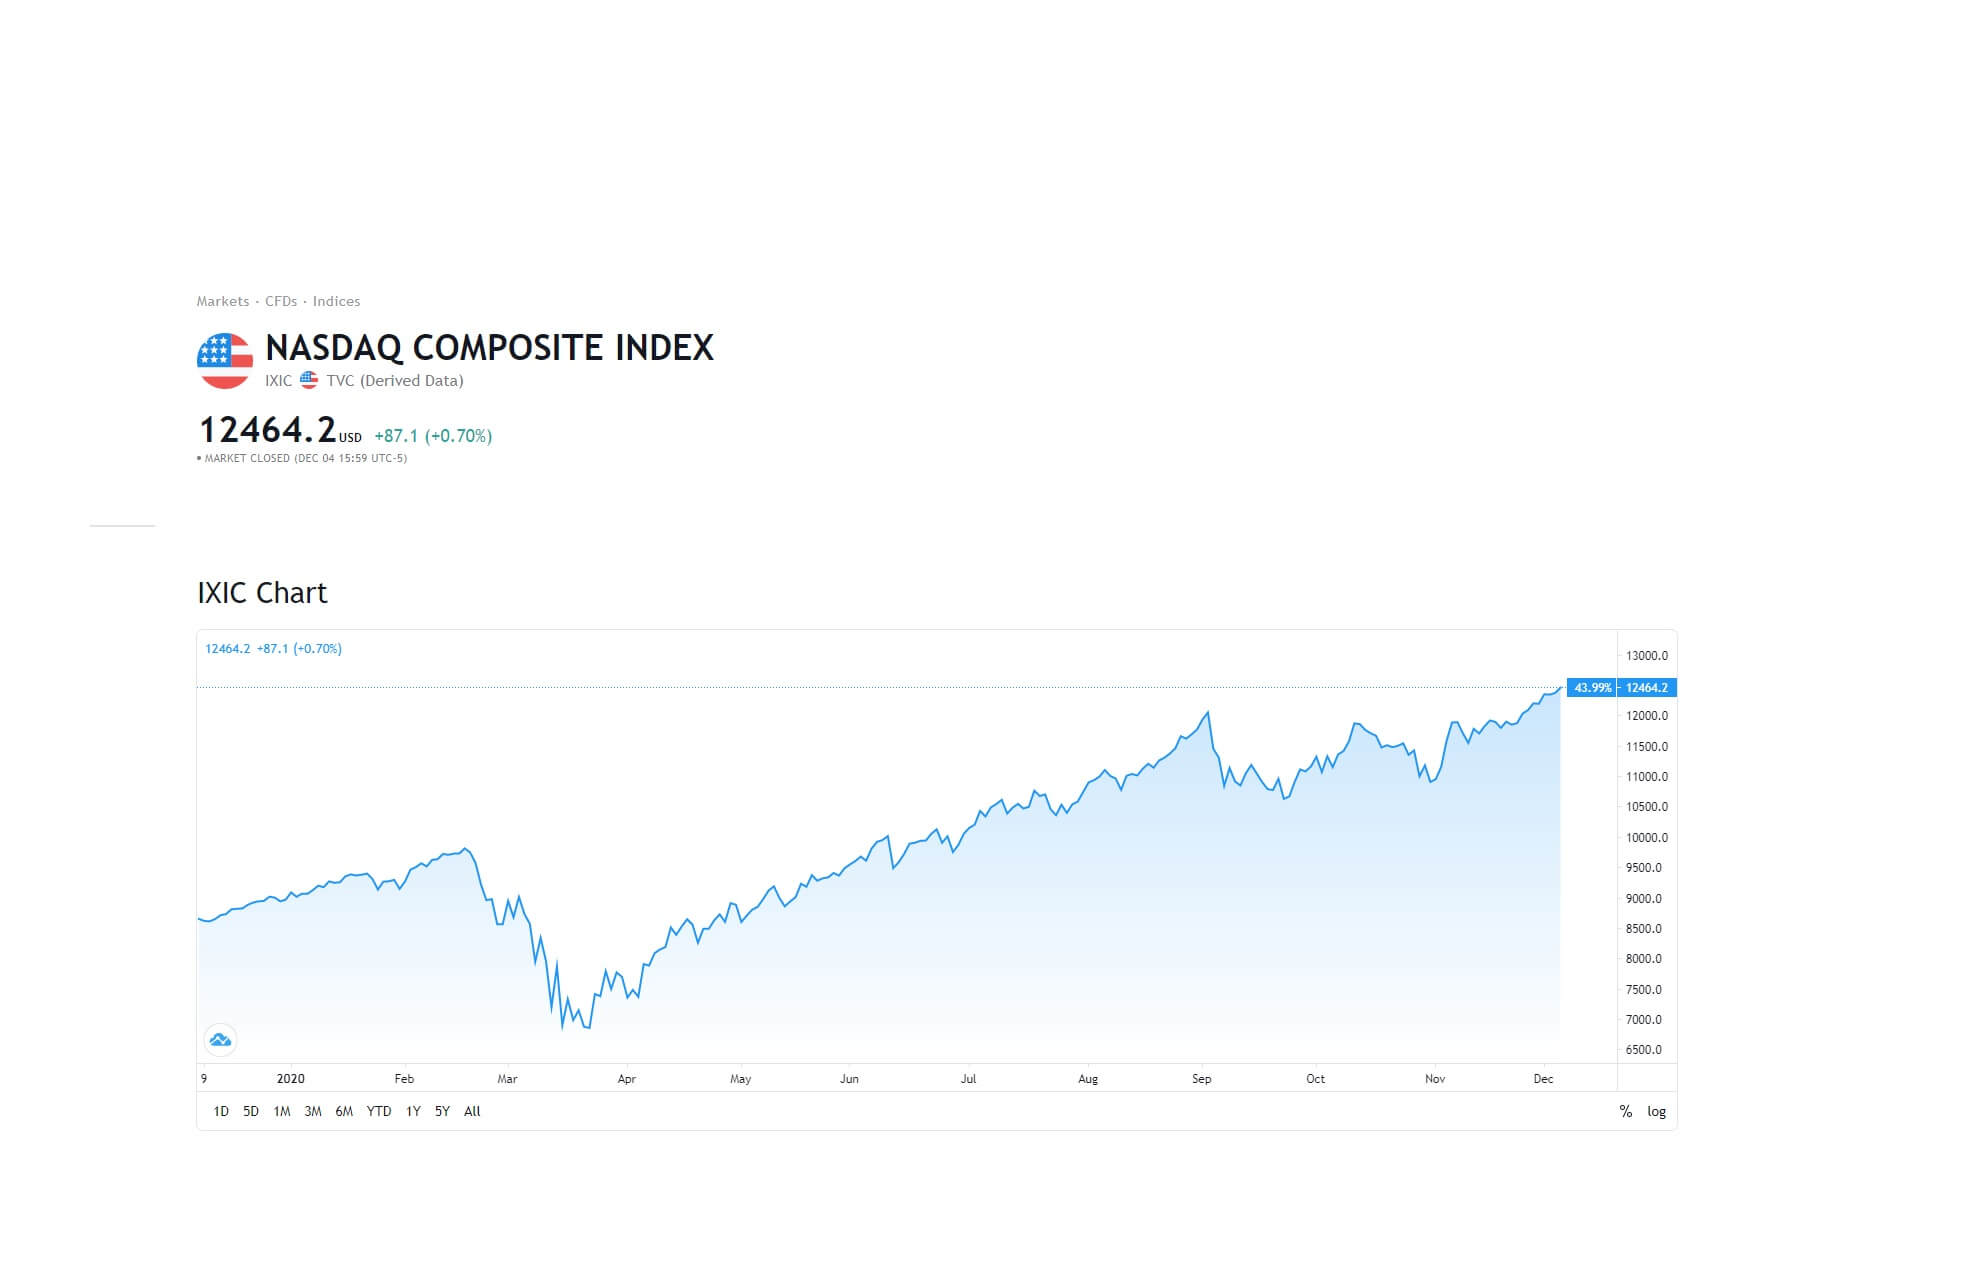
….and so did the Barons 400 index
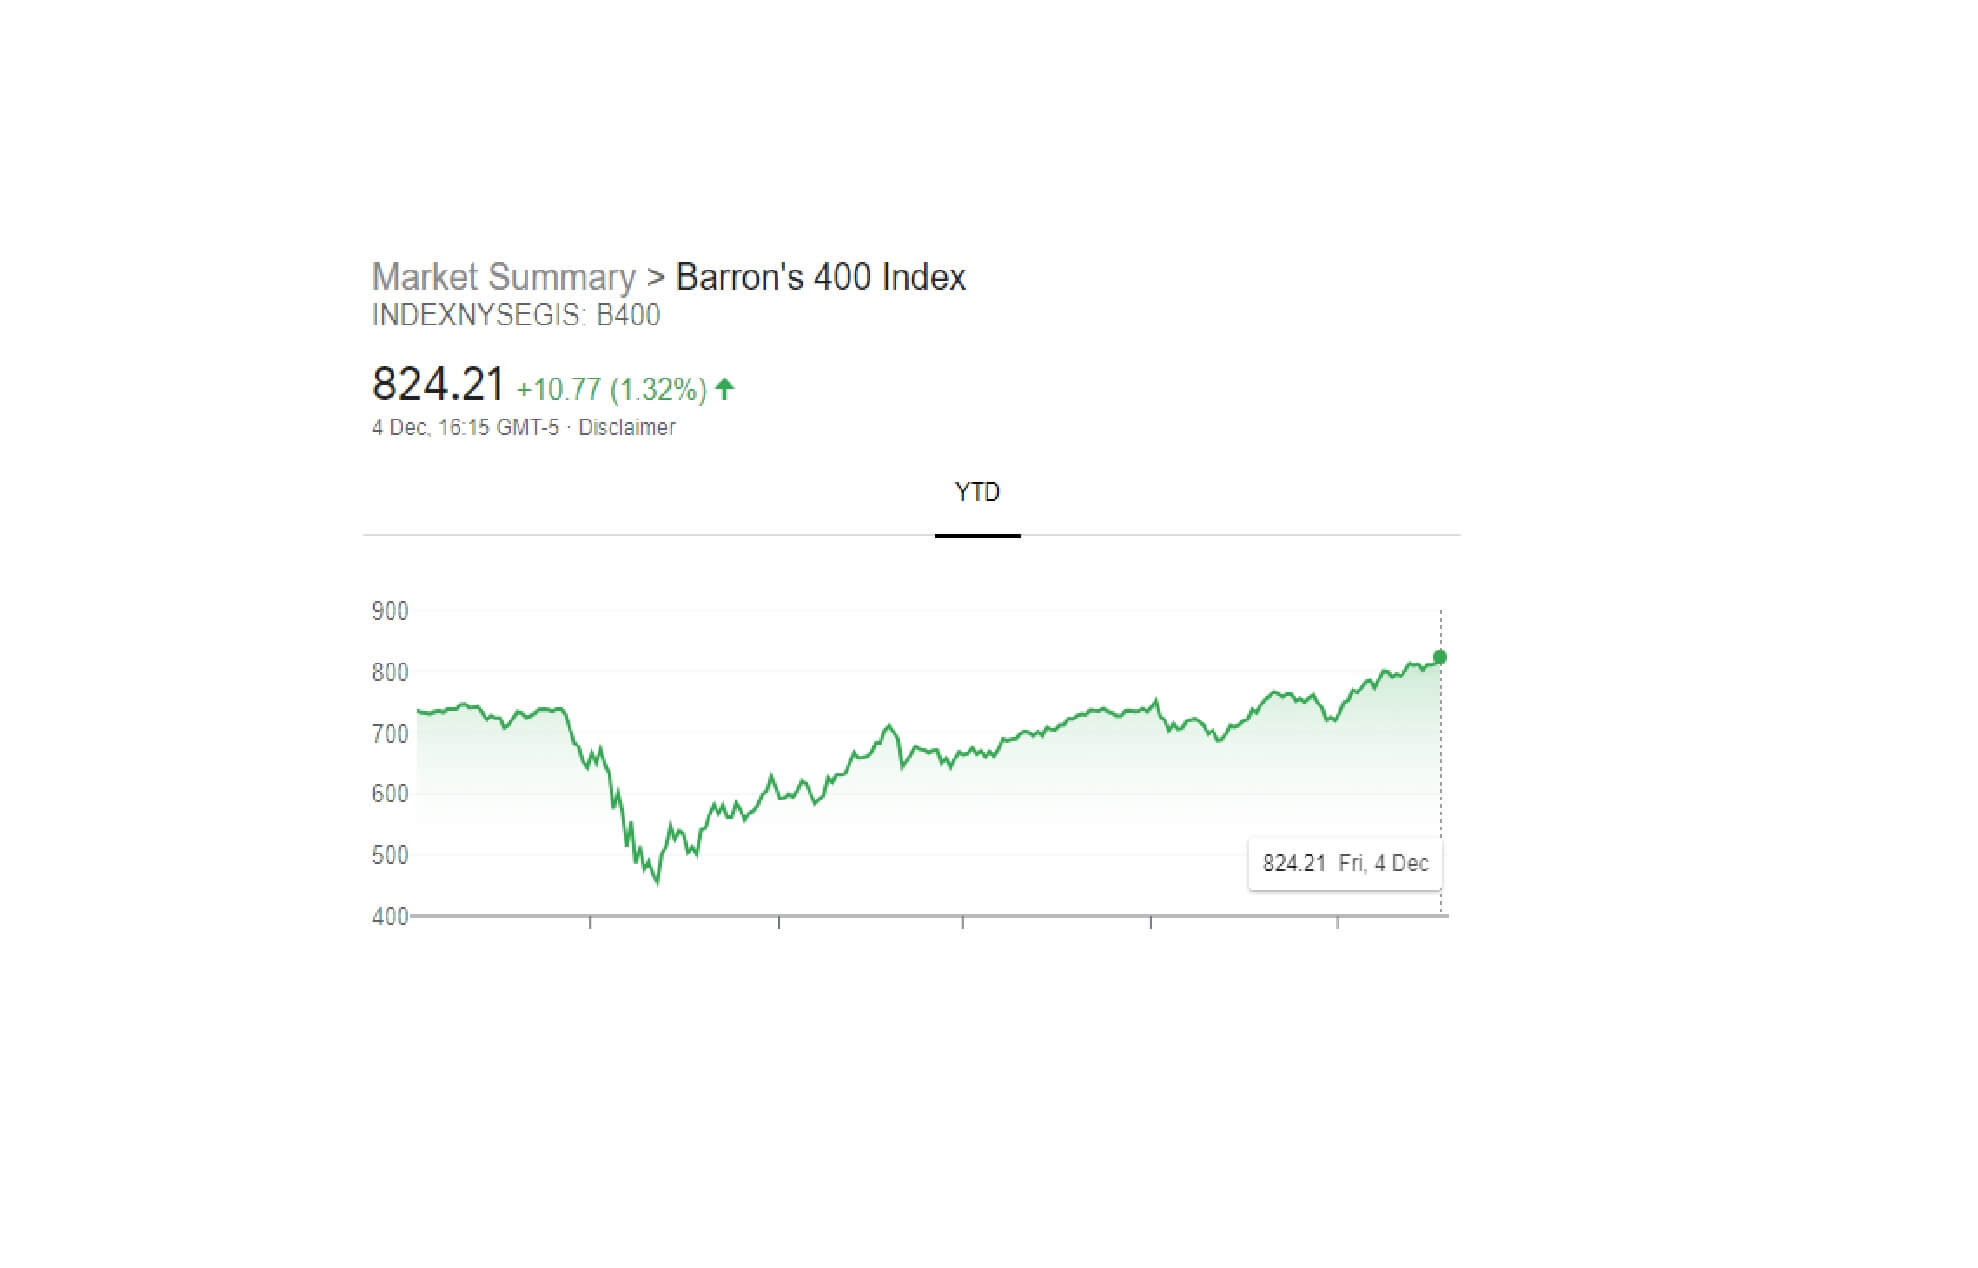
For all of these indices to simultaneously hit fresh all-time record highs is a very rare occurrence. It shows that investor sentiment is extremely high, potentially buoyed by a forthcoming and greatly anticipated next round for the Covid stimulus bill, if and when the democrats and republicans can reach an agreement on the size, currently estimated at $900 billion. The markets are also confident that the federal reserve is doing a good job in propping up the ailing American economy and sticking to a policy of low-interest rates for at least the next 2 years, which has typically corresponded with higher investment in stocks and shares, historically speaking.
Investors will look at the fed’s response to the crisis as a kind of insurance policy, that behind the scenes, the federal reserve will not allow the stock market to crash.
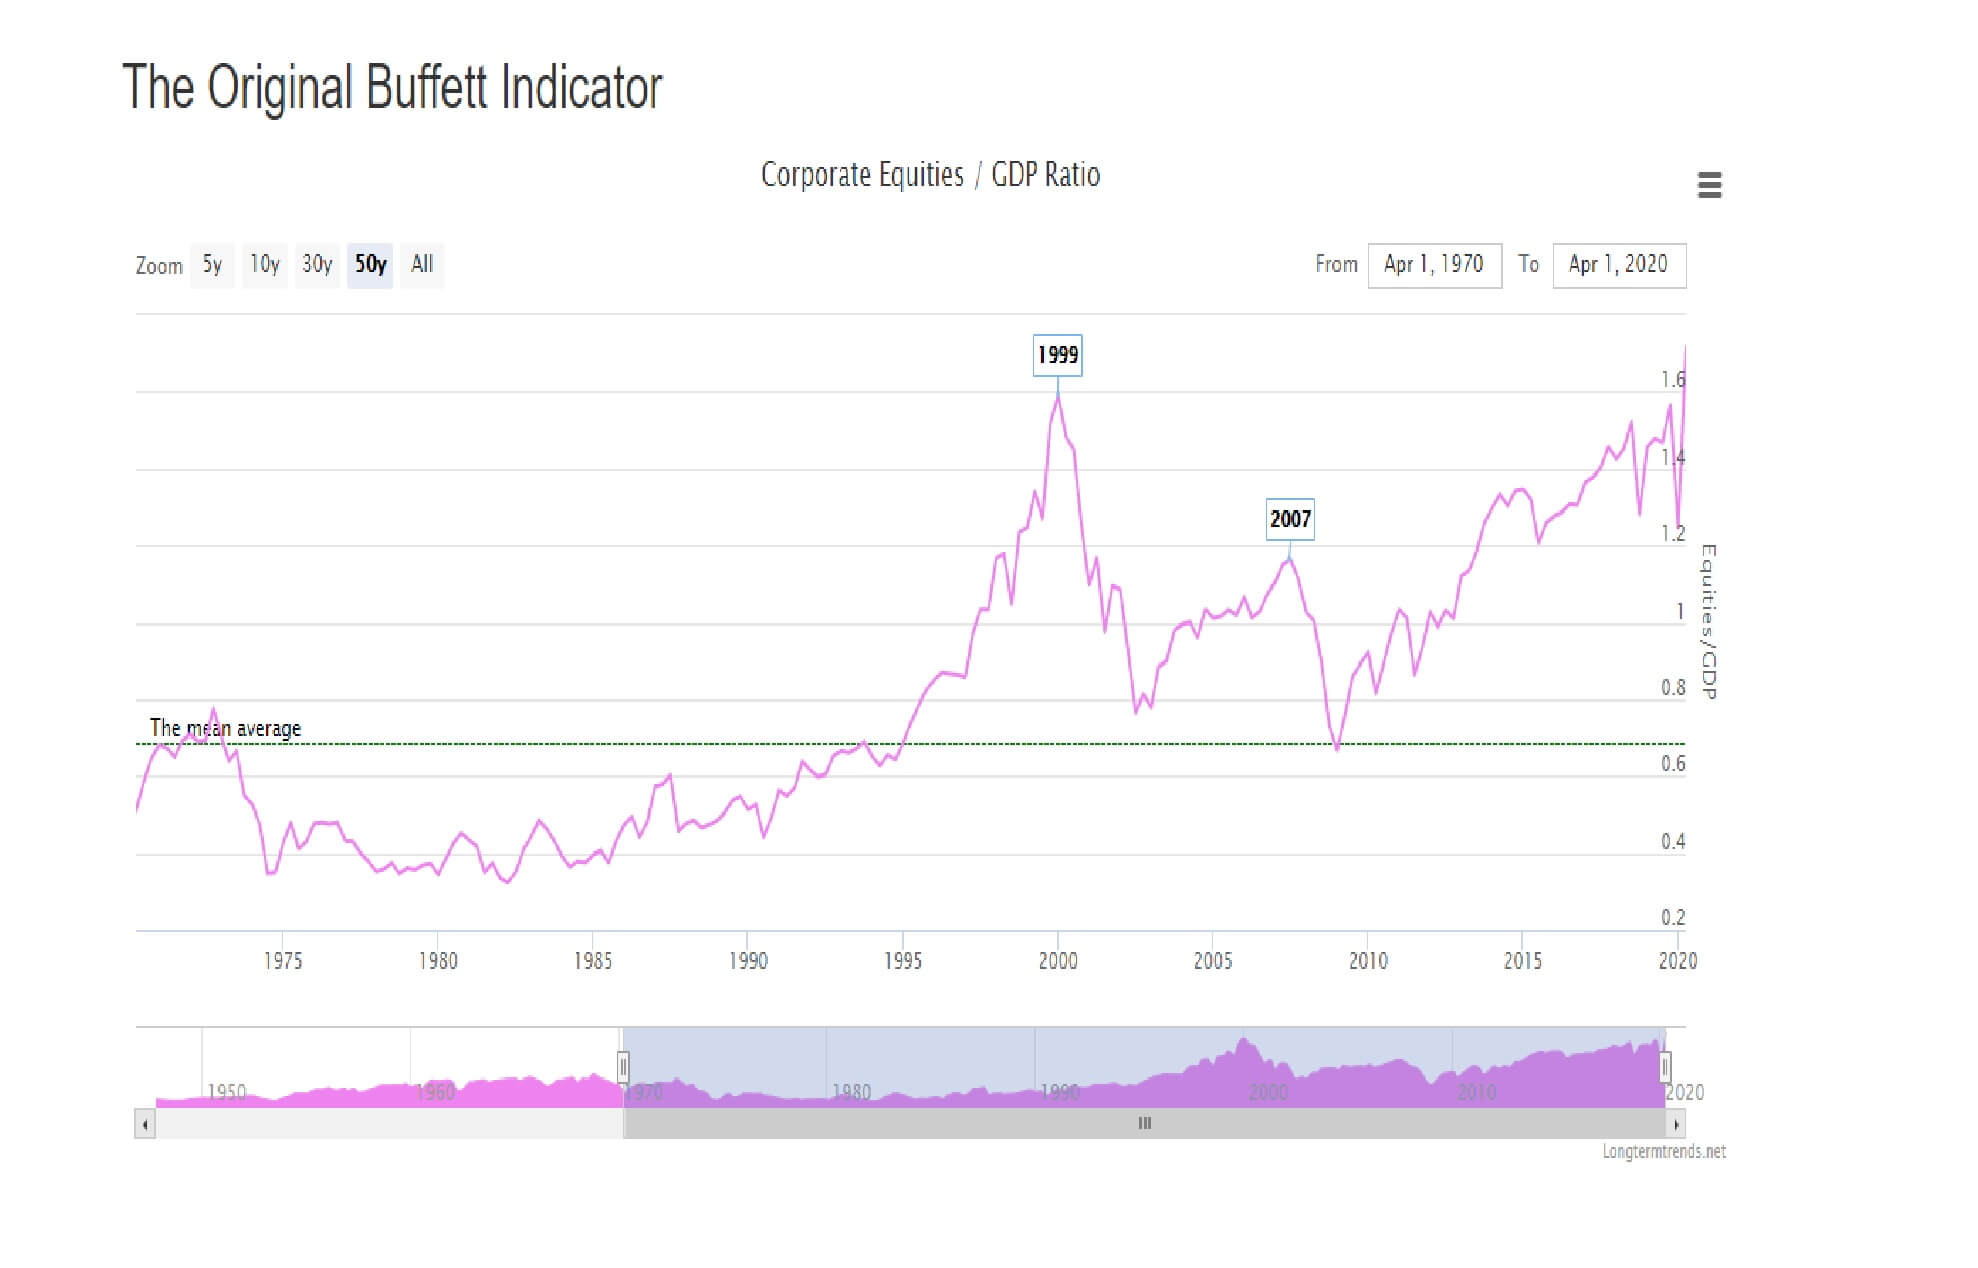
However, analysts who follow the Buffett indicator, which is the original measure for US market capitalisation, point out that since 1947 earnings per share have grown at around 6.21% annually, while the economy has expanded by 6.47% annually. This premise that the market capitalisation ratio to gross domestic product is based on the economy driven roughly 70% by consumption, where individuals must earn in order to buy products. And that consumption is where corporations earn their revenues, and ultimately this is where their profits come from.
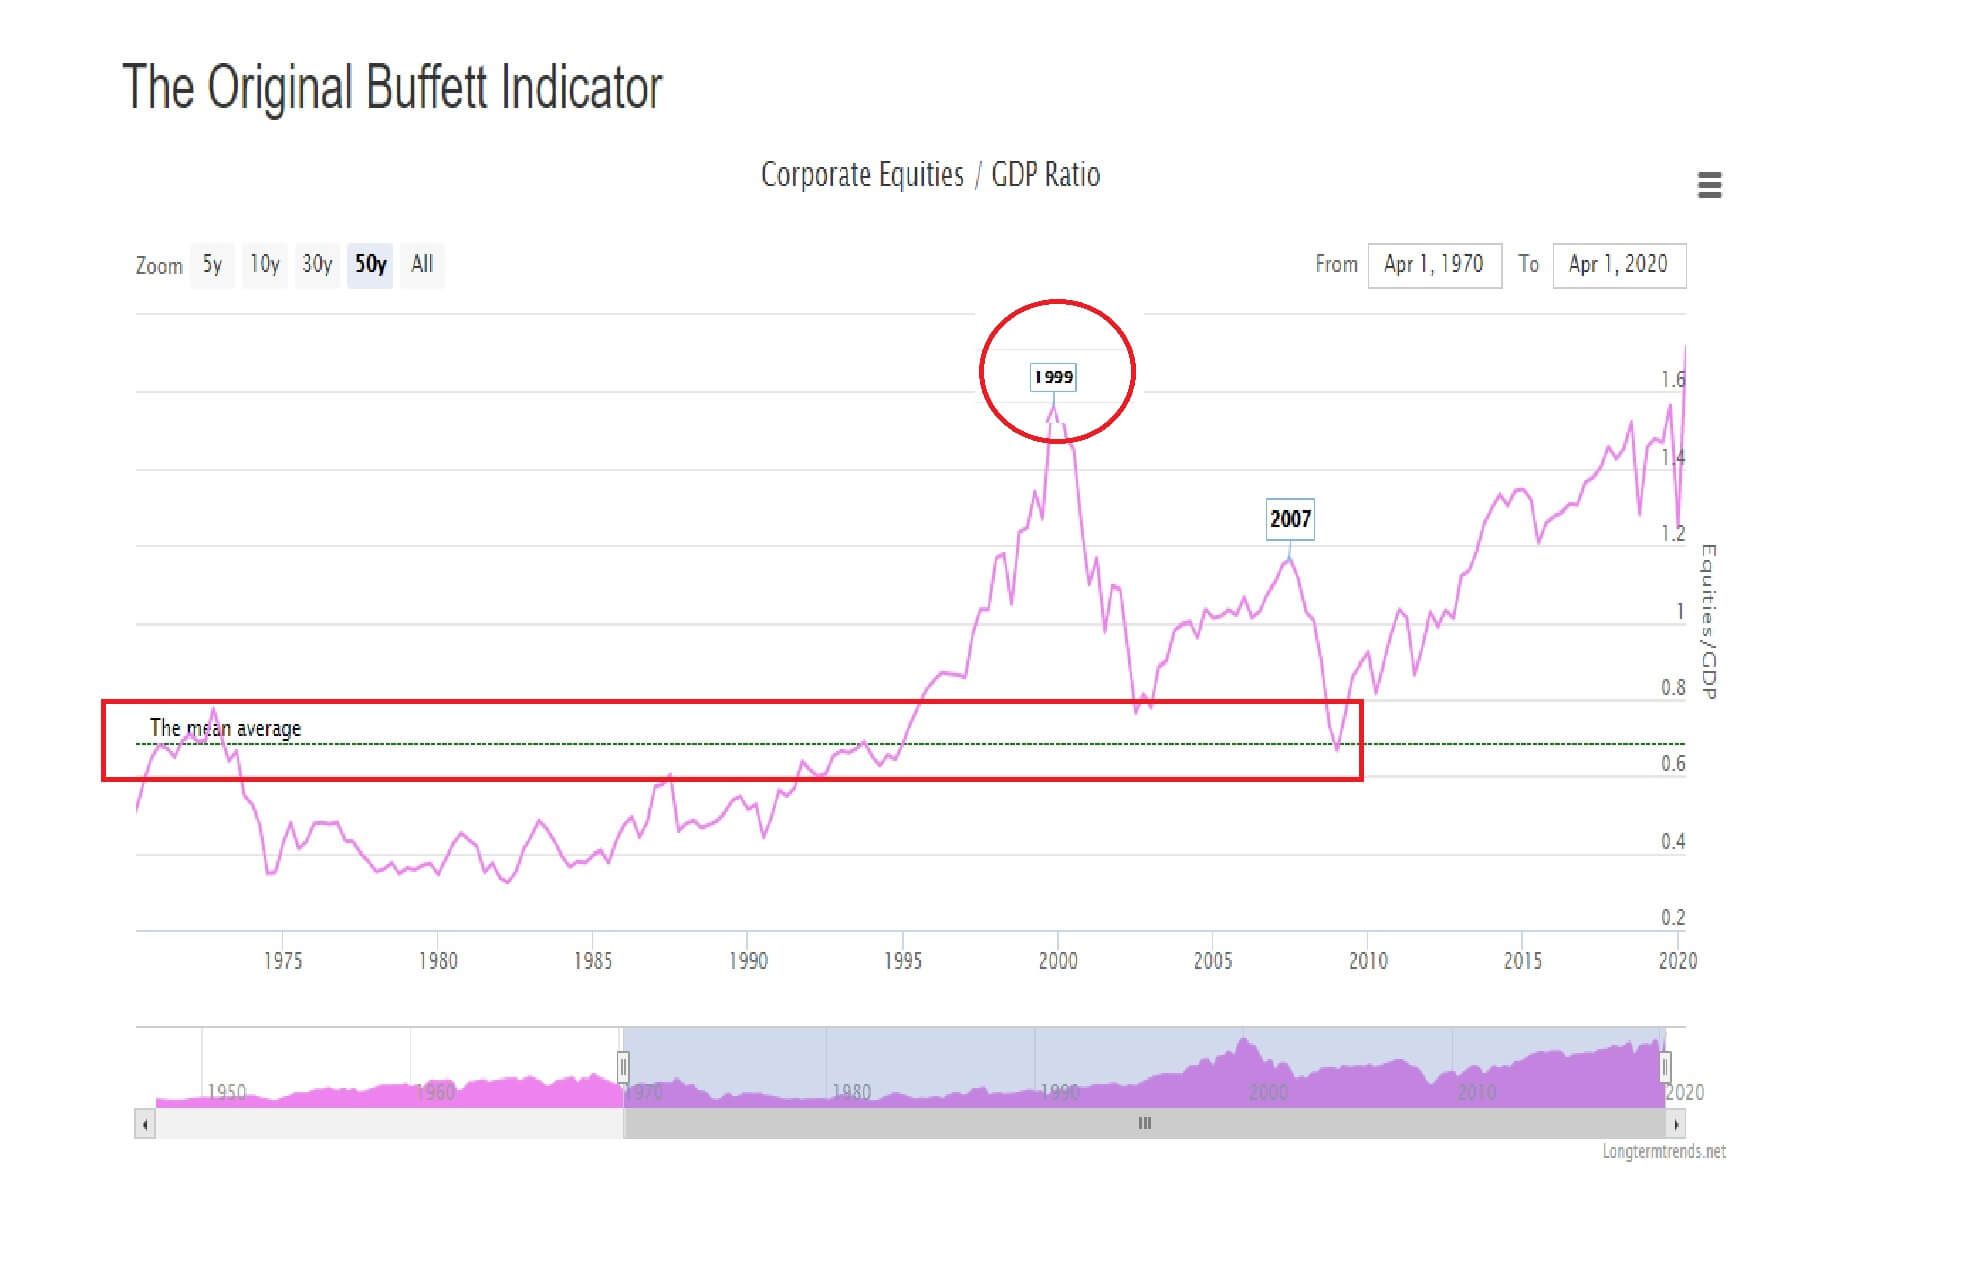
The Buffett indicator shows that the mean average of around 0.7 has been closely adhered to since the 1950s, and the last time it broke away to the upside was in 1999, when speculators were investing heavily in Dot-Com companies, and where this led to the market crash in March 2000, and where we see that around this time the indicator pulls back to the mean average. Analysts at Deutsche Bank also point out that the recent run in US stocks has taken the market shift above the ratio of price to earnings above the level seen just before the 1929 stock market crash.
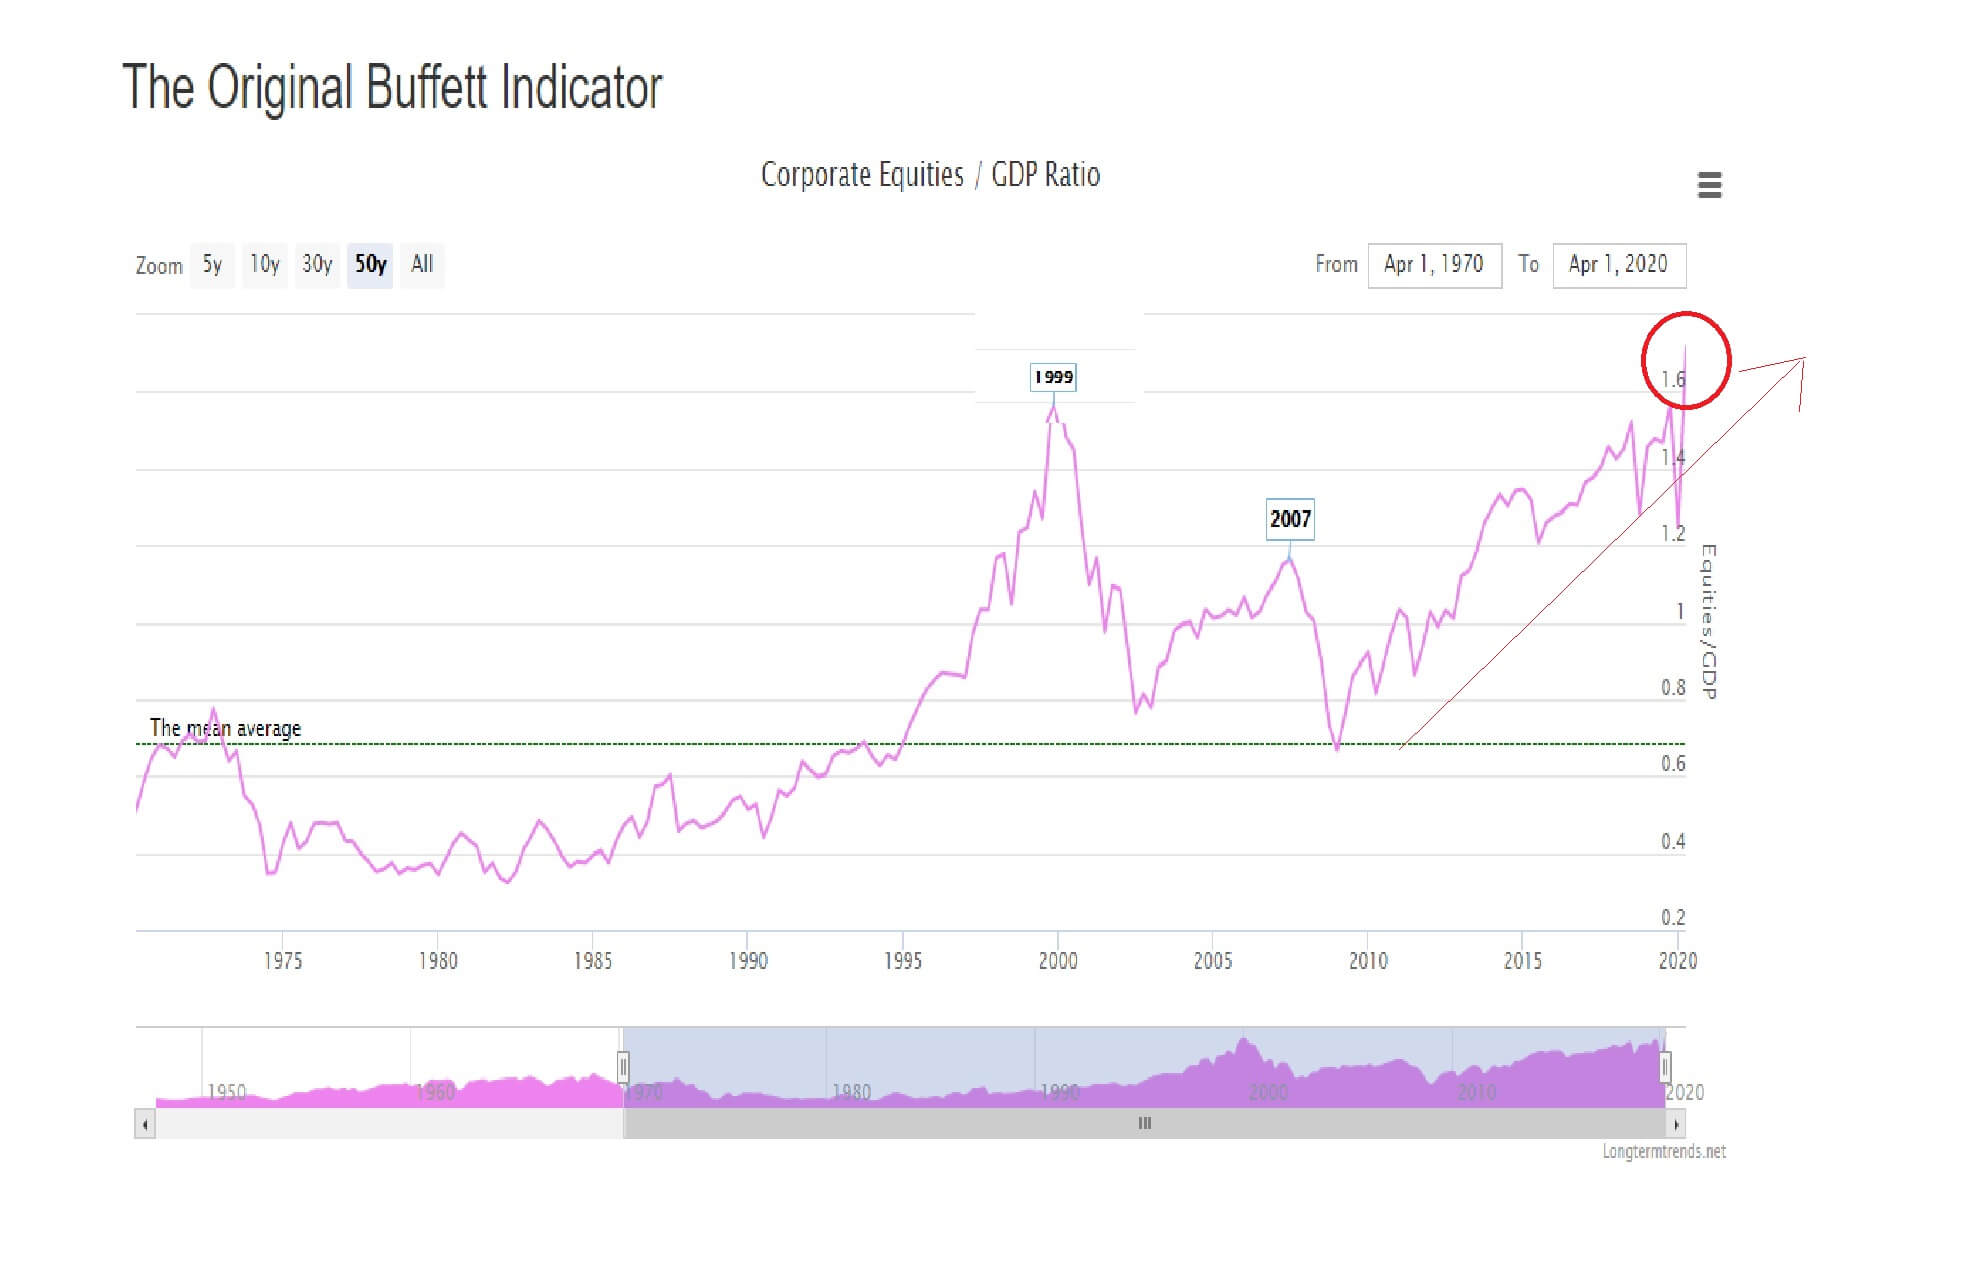
And here we see that the currents levels on the indicator are again highly inflated to a record high on the graph above the mean average at around 1.7.
…….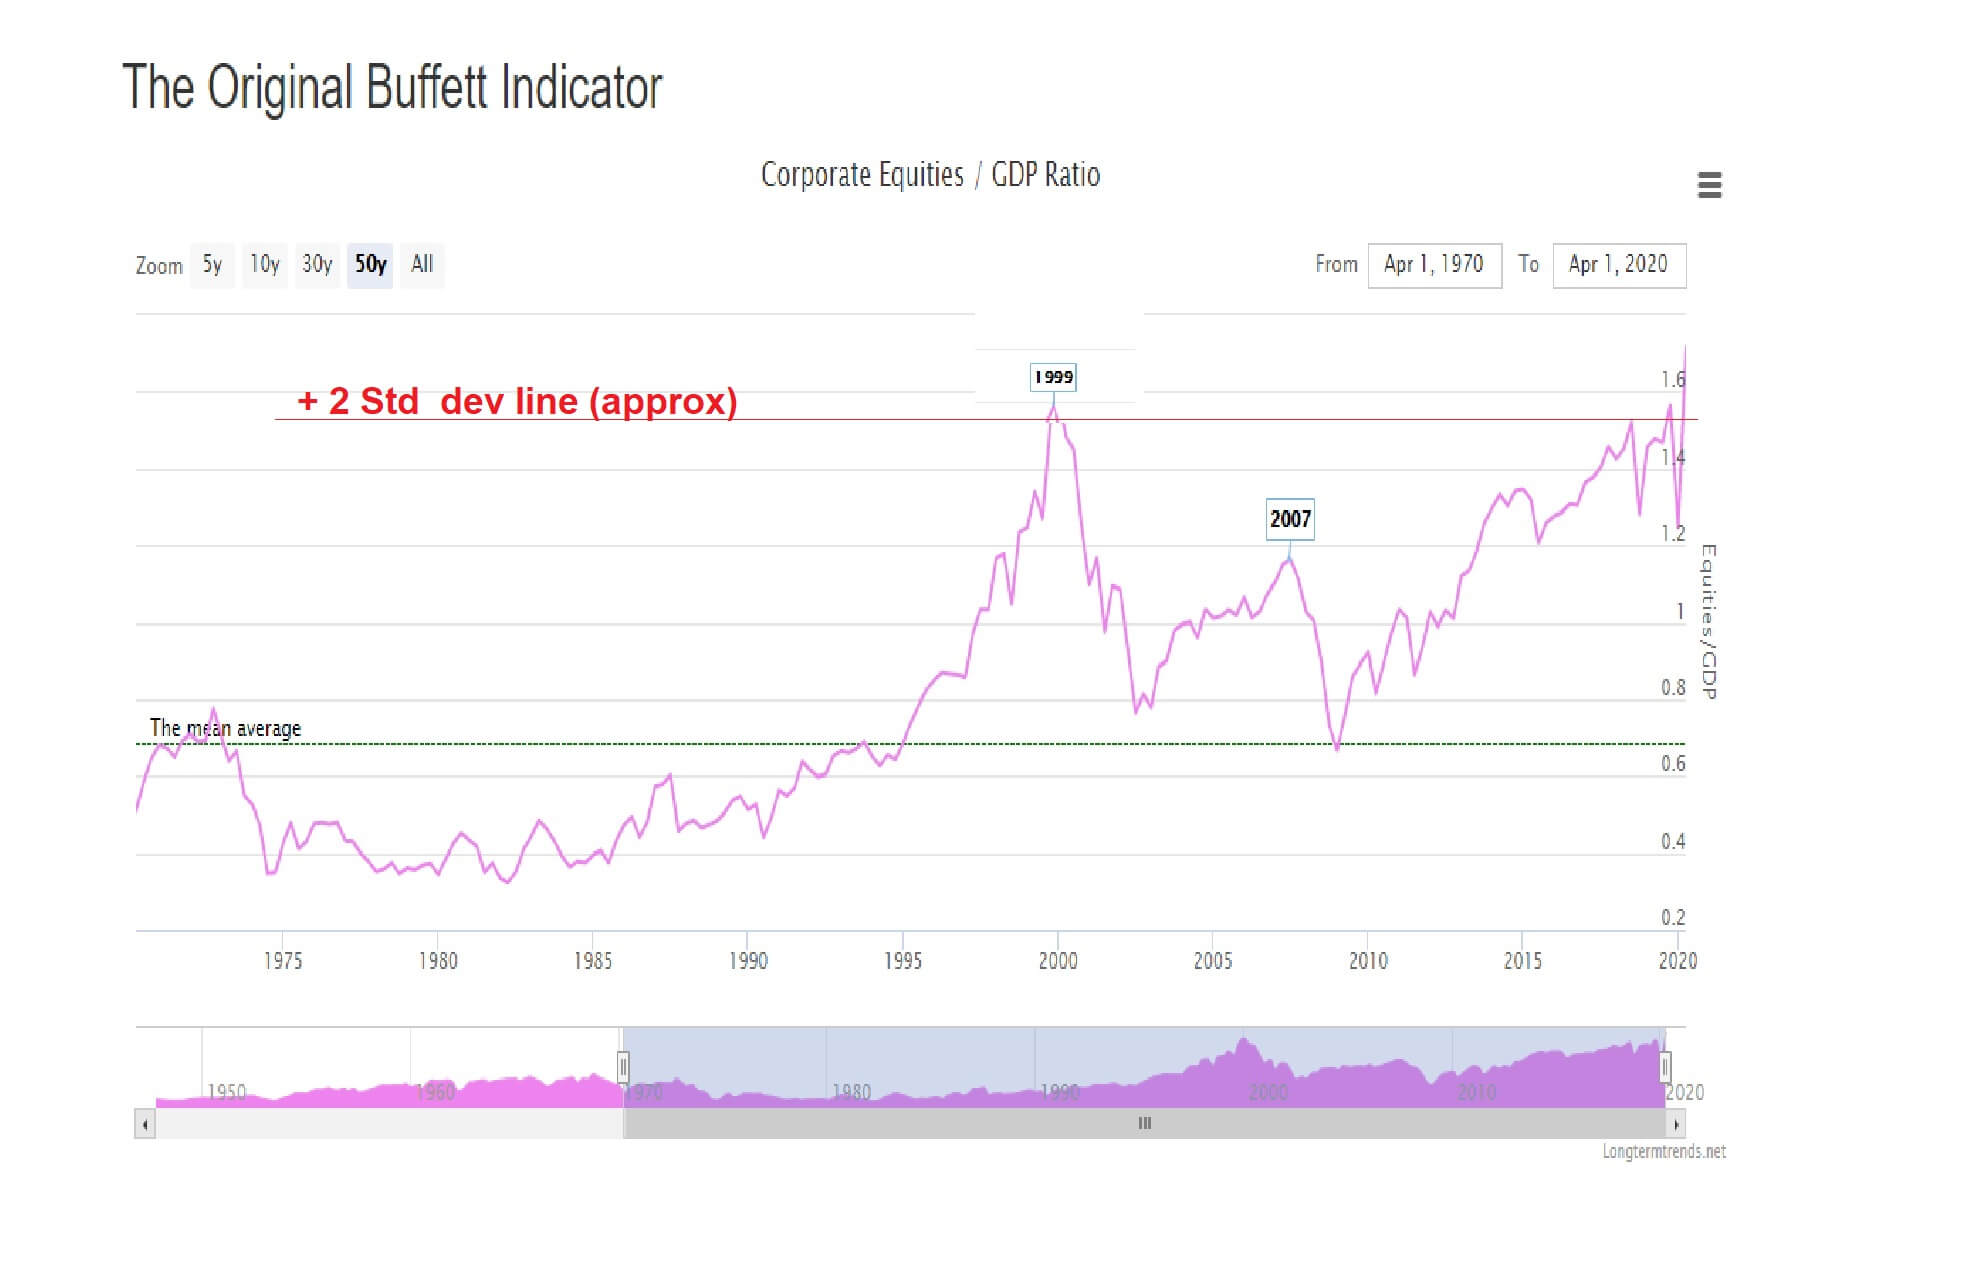
……and coincides with being above 2 standard deviations of the average range, which is an extremely rare occurrence.
And yet with the American economy still suffering from the pandemic, American corporations profit ratios are not reflective of consumer consumption, rather this time we have the Federal Reserve and US government stimulation packages which are churning out dollars into the market, and where investors are using much of those funds to push up the level of stocks due to FOMO, or fear of missing out. and where are the traditional corporate valuation matrix simply do not apply to certain stocks anymore.
Fear of a recurrence of the dot-com bubble correction, where investors ignored earnings per share valuations – many of these Dot-com firms were not making any profit at all – is another reason why we might potentially be looking at the top for stocks. Also, a fairly simple one; many of the favourites for investors, such as Amazon, Apple, and Tesla, for example, are not cheap anymore. This means that investors will be looking at cheaper stocks with growth potential, while others which are too expensive and are seen as potentially overbought. And in an economy which may not see growth return to any kind of normality for years, it adds weight to the thorny issue that the Dow Jones 30 industrial average – home to the top 30 most expensive stocks in the USA – and which is considered as a benchmark of the health of the US economy, may find buyers to be thin on the ground now, in which case a correction could be not too far away, based on everything set out in our assessment today.

