Overview
The Dow Jones Industrial Average is developing a descending sequence that could drive the price to new lower lows. This bearish context occurs in the middle of the US presidential elections campaign, which will take place on November 03rd.
Market Sentiment Overview
The United States benchmark, led by the Dow Jones index, appears to be preparing for the presidential elections on November 3.
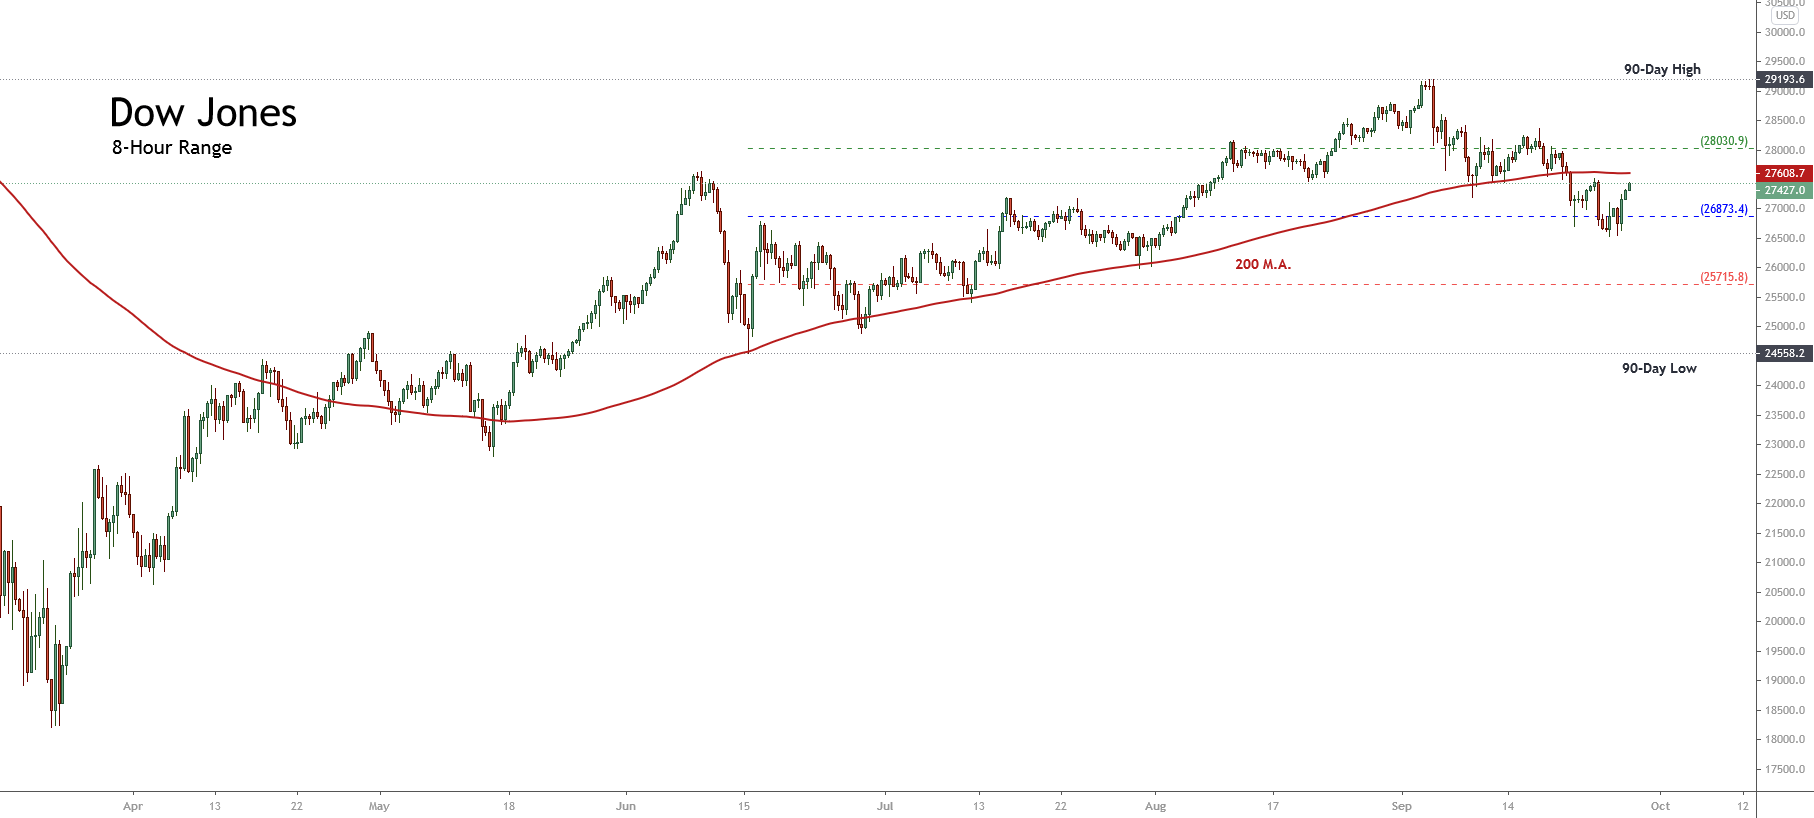
The short-term market sentiment exposed in the following 8-hour chart illustrates the price shift below the 200-day weighted moving average, which has turned from support to the next short-term resistance to struggle with.
On the other hand, we observe the 90-day high and low range, where the Industrial Average Index has found support in the neutral zone at over the 26,700 pts, where it bounced, being traded slightly bullish during the last Friday 25th session. This context, added to the shifting movement of the price and against its 200-day moving average, leads us to suspect that the Dow Jones Index could see a further drop within the next few sessions.
Concerning the volatility associated with the Industrial Average, expressed by the Dow Jones Volatility Index (VXD) on its daily chart, we distinguish that the action consolidates above the 60-day moving average. Likewise, VXD shows an increasing sequence of short-term lows, which provides a chance of a new bullish movement of the VXD in the short term.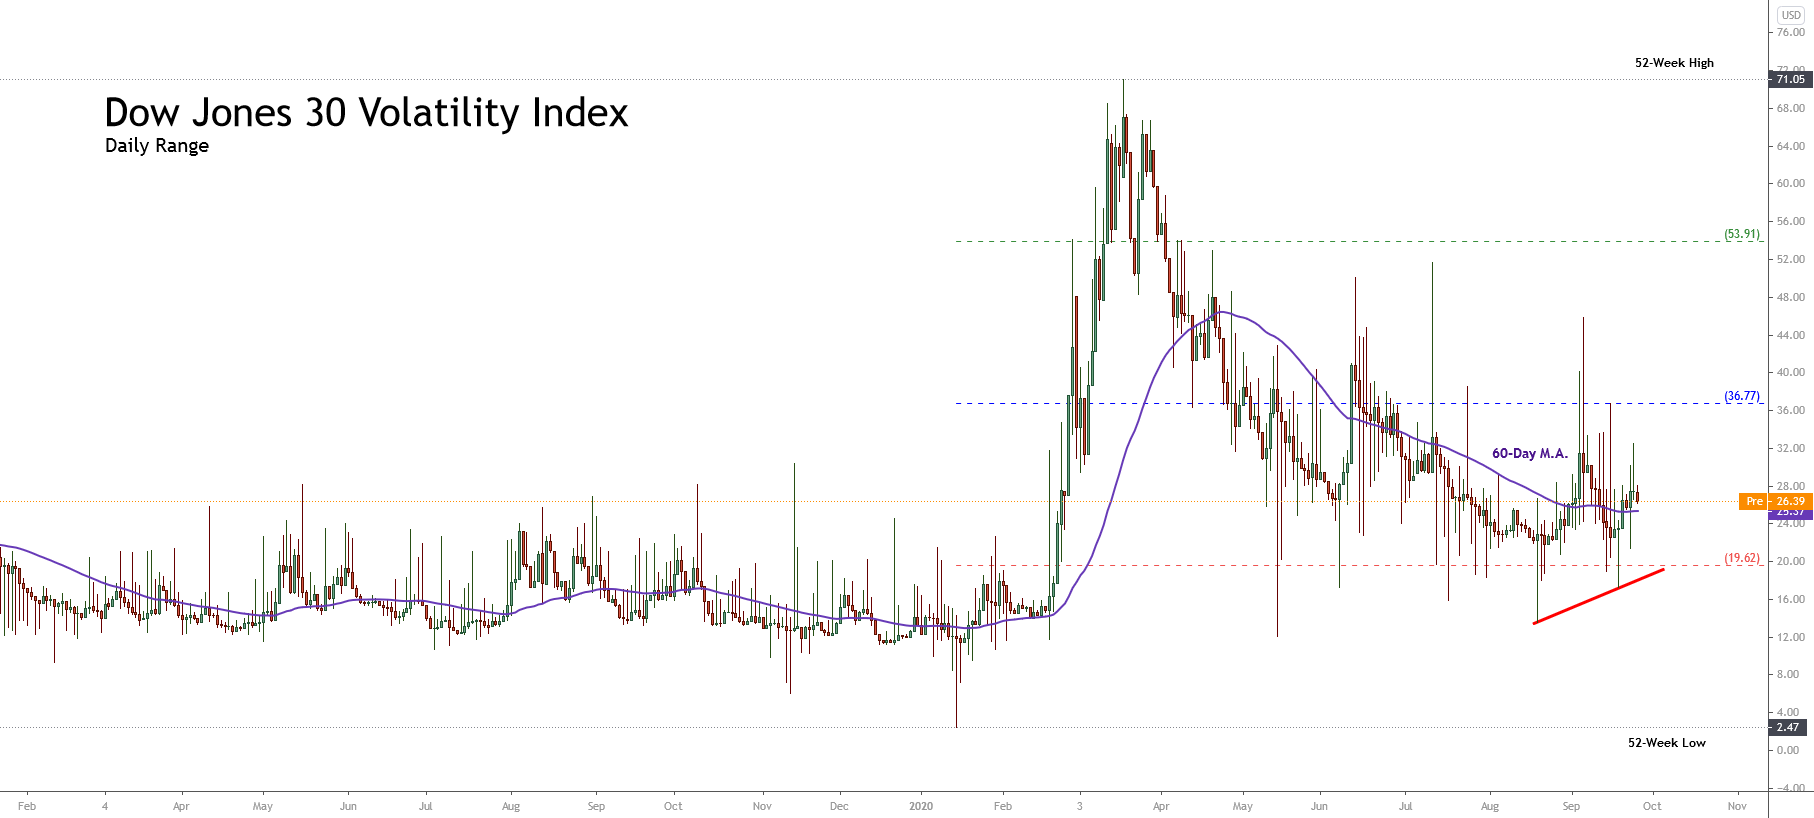
In consequence, the market context leads us to expect a potential bearish movement for the Industrial Average. However, this scenario still needs to be confirmed by the price action.
Technical Analysis Outlook
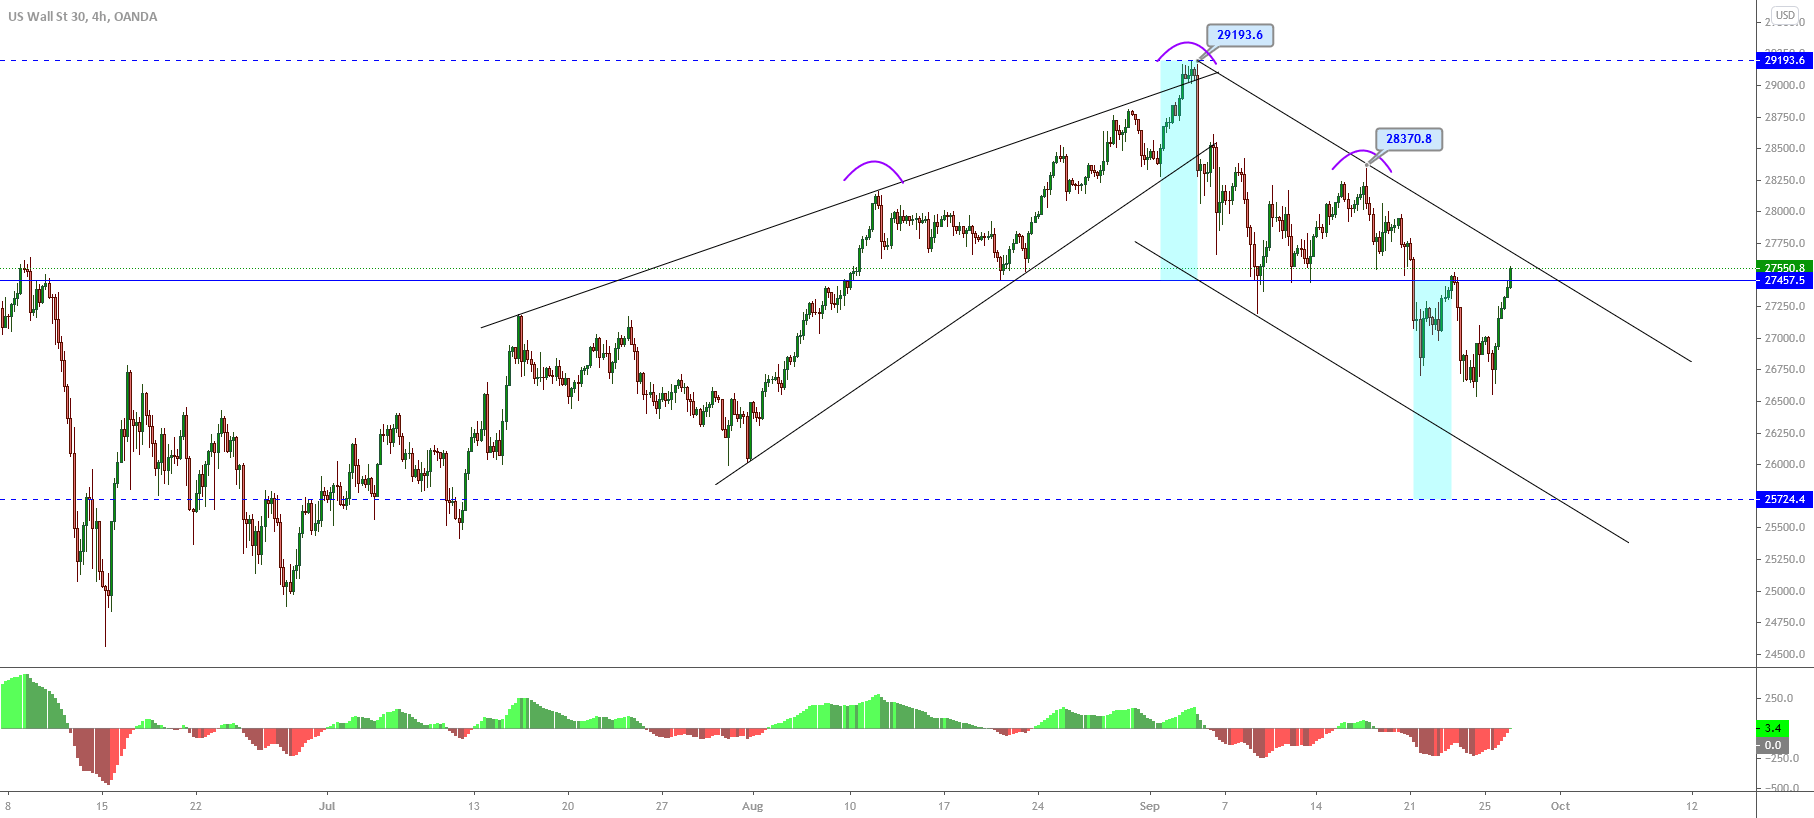
From a technical analysis perspective, the Dow Jones Index in its 4-hour chart is showing a descending sequence that began once the price found resistance at 29,193.6 pts on September 03rd. Once the Industrial Average found fresh sellers, the downward pressure drove the price to a retracement till the 26,541 level, where the leading US benchmark found support and began to bounce back to the current trading levels.
On the other hand, in the previous figure, we distinguish the progress of a head and shoulders pattern, which has its neckline at the level of 27,457.5. The bearish breakdown developed during the September 21st trading session, and its subsequent pullback confirmed the bearish signal in the Industrial Average. In this regard, according to the head and shoulder pattern definition, this trend reversal formation has a pending bearish target located at 25,724 pts.
Similarly, if the price confirms a new lower high under the previous peak at 28,370.8 pts, it would confirm a bearish continuation pattern identified as three descending peaks, which would support the bearish scenario for Dow Jones.
In conclusion, our short-term perspective is mainly bearish as long as the price remains below 28,370.8 pts, with a bearish target established at 25,724 pts. The invalidation of our bearish scenario will occur if the Industrial Average consolidates above 28,370.8 pts.

