Categories
Forex Market Analysis

Dow Jones Moves Under Bearish Signals

Overview

The Dow Jones Industrial Average is developing a descending sequence that could drive the price to new lower lows. This bearish context occurs in the middle of the US presidential elections campaign, which will take place on November 03rd.

Market Sentiment Overview

The United States benchmark, led by the Dow Jones index, appears to be preparing for the presidential elections on November 3.

The short-term market sentiment exposed in the following 8-hour chart illustrates the price shift below the 200-day weighted moving average, which has turned from support to the next short-term resistance to struggle with.

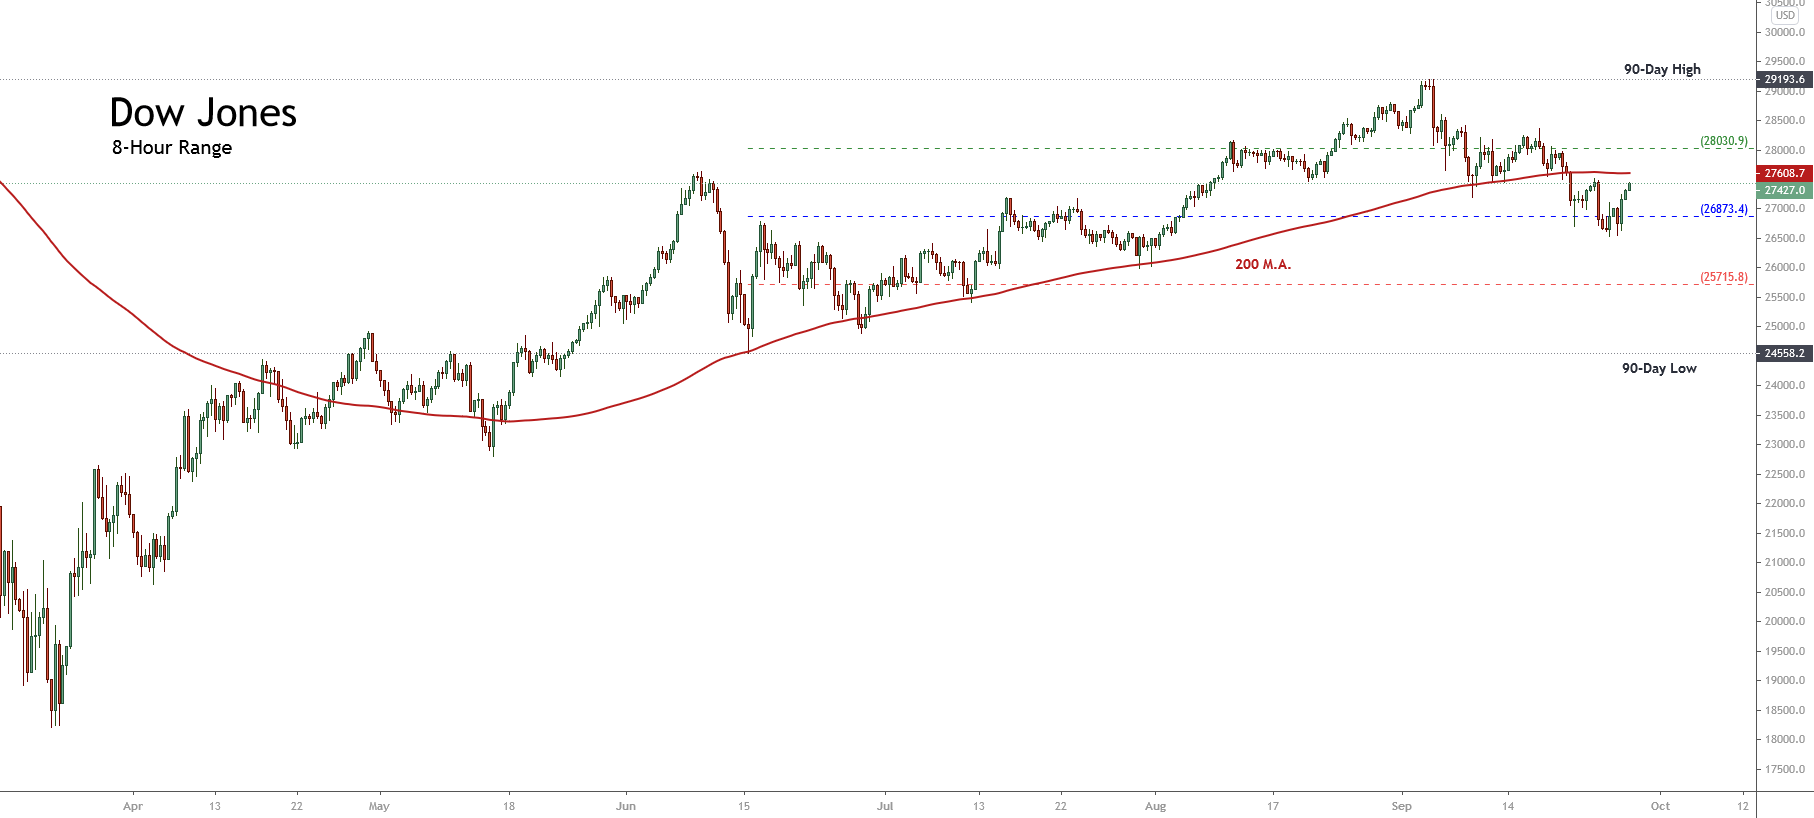
On the other hand, we observe the 90-day high and low range, where the Industrial Average Index has found support in the neutral zone at over the 26,700 pts, where it bounced, being traded slightly bullish during the last Friday 25th session. This context, added to the shifting movement of the price and against its 200-day moving average, leads us to suspect that the Dow Jones Index could see a further drop within the next few sessions.

Concerning the volatility associated with the Industrial Average, expressed by the Dow Jones Volatility Index (VXD) on its daily chart, we distinguish that the action consolidates above the 60-day moving average. Likewise, VXD shows an increasing sequence of short-term lows, which provides a chance of a new bullish movement of the VXD in the short term.

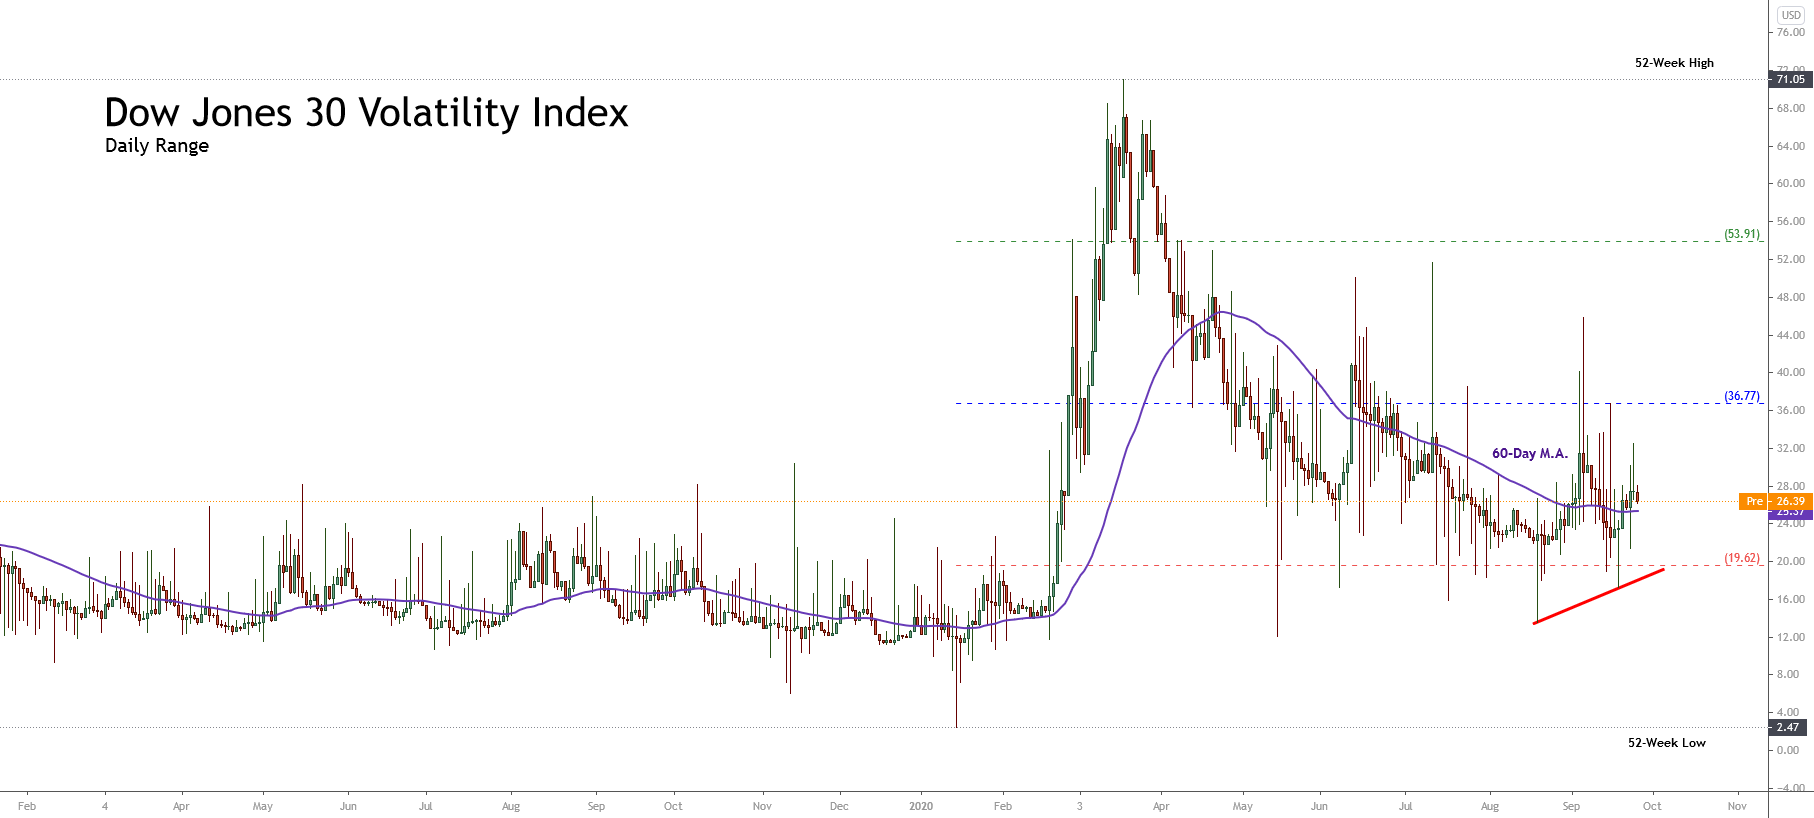
In consequence, the market context leads us to expect a potential bearish movement for the Industrial Average. However, this scenario still needs to be confirmed by the price action.

Technical Analysis Outlook

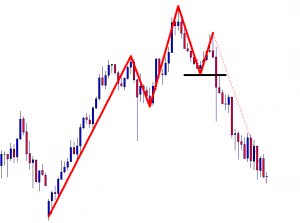
From a technical analysis perspective, the Dow Jones Index in its 4-hour chart is showing a descending sequence that began once the price found resistance at 29,193.6 pts on September 03rd. Once the Industrial Average found fresh sellers, the downward pressure drove the price to a retracement till the 26,541 level, where the leading US benchmark found support and began to bounce back to the current trading levels.

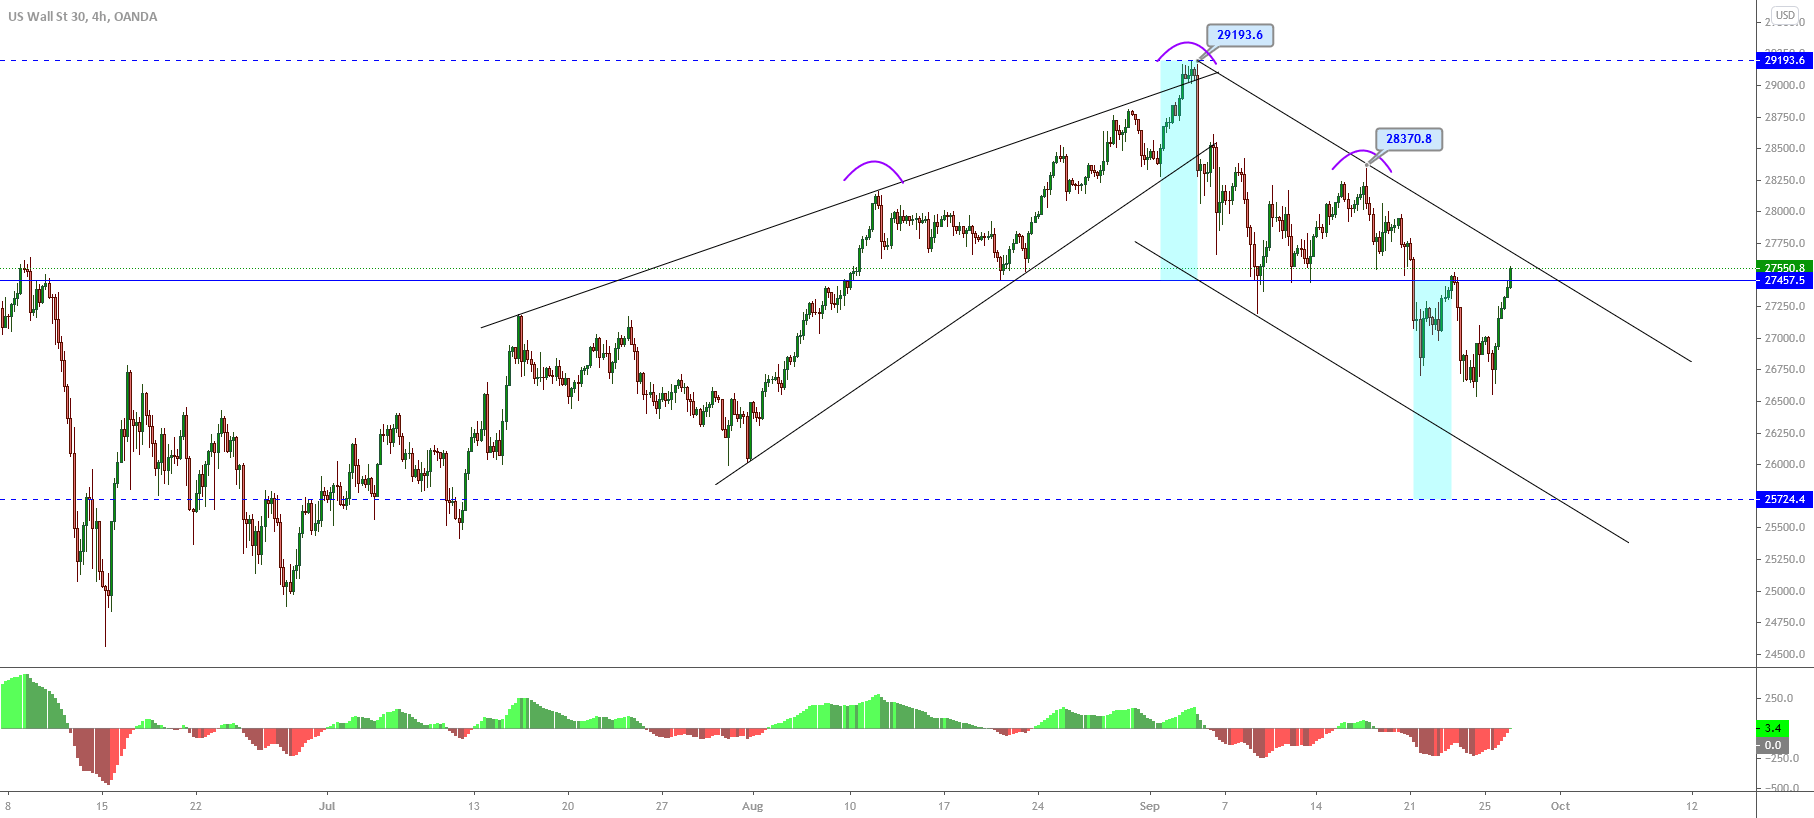
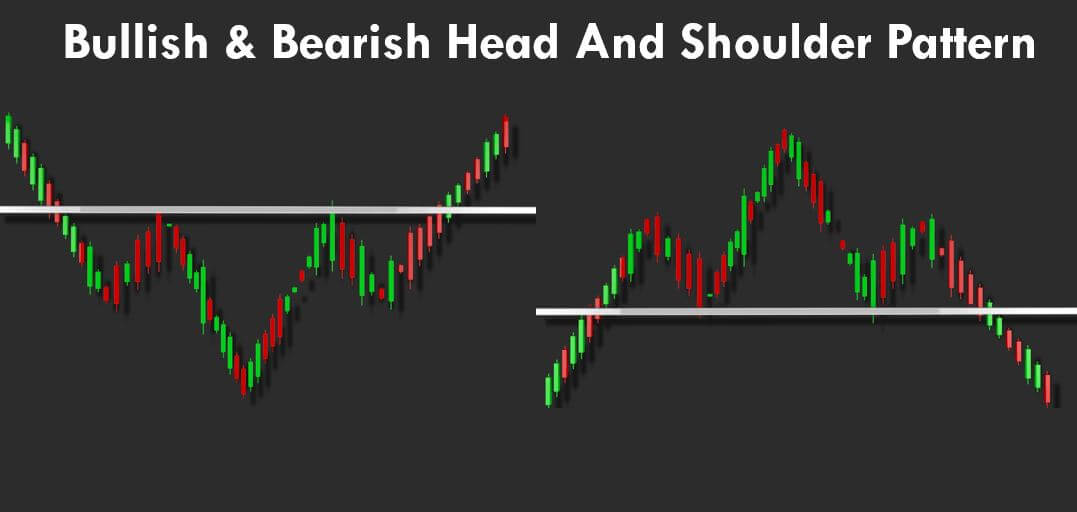
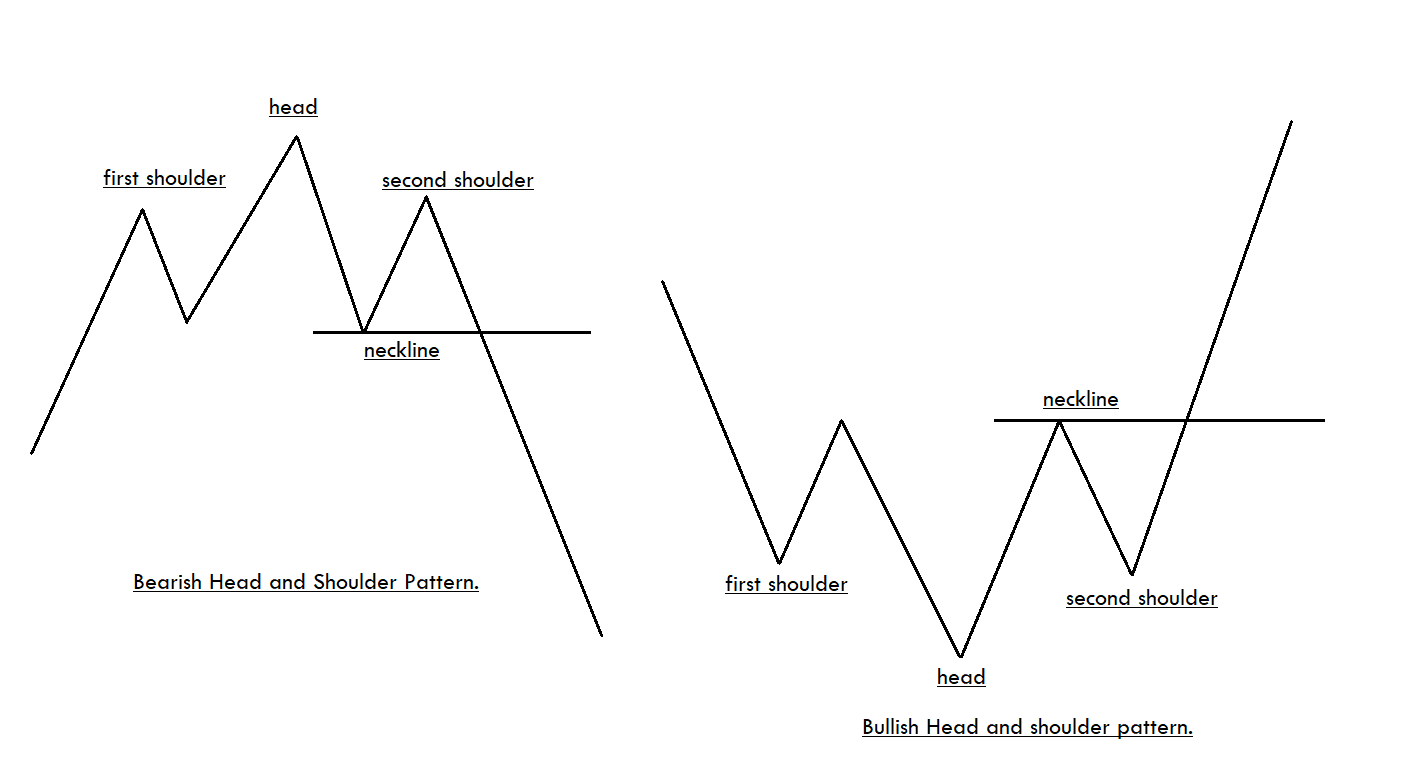
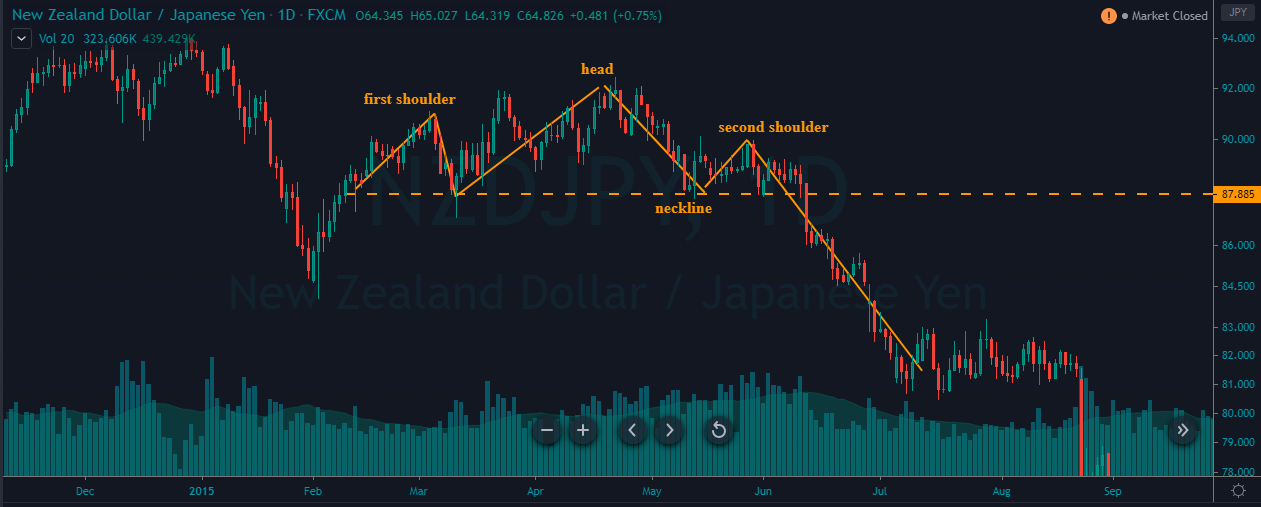
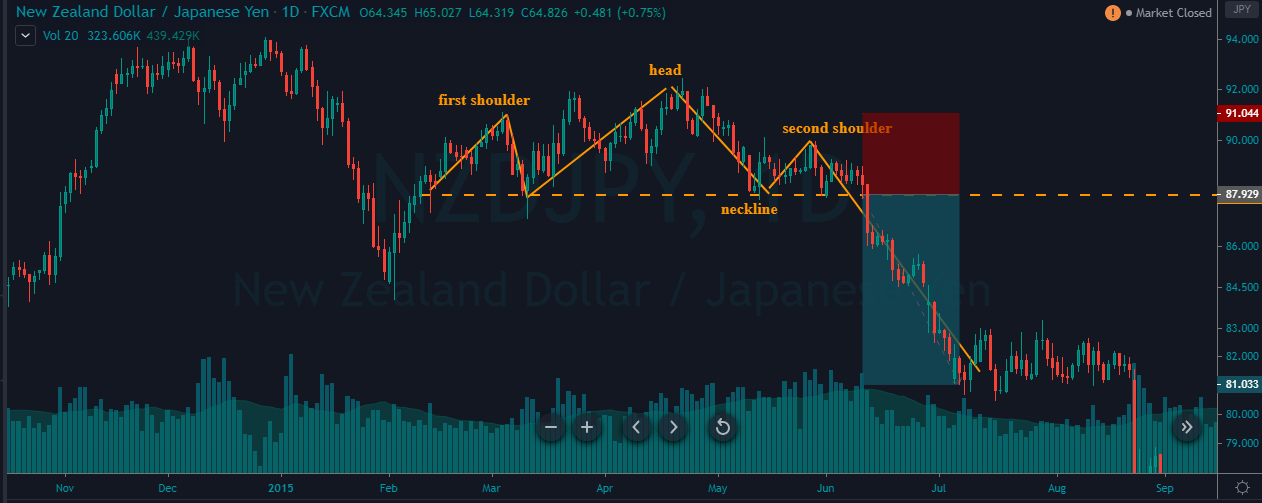
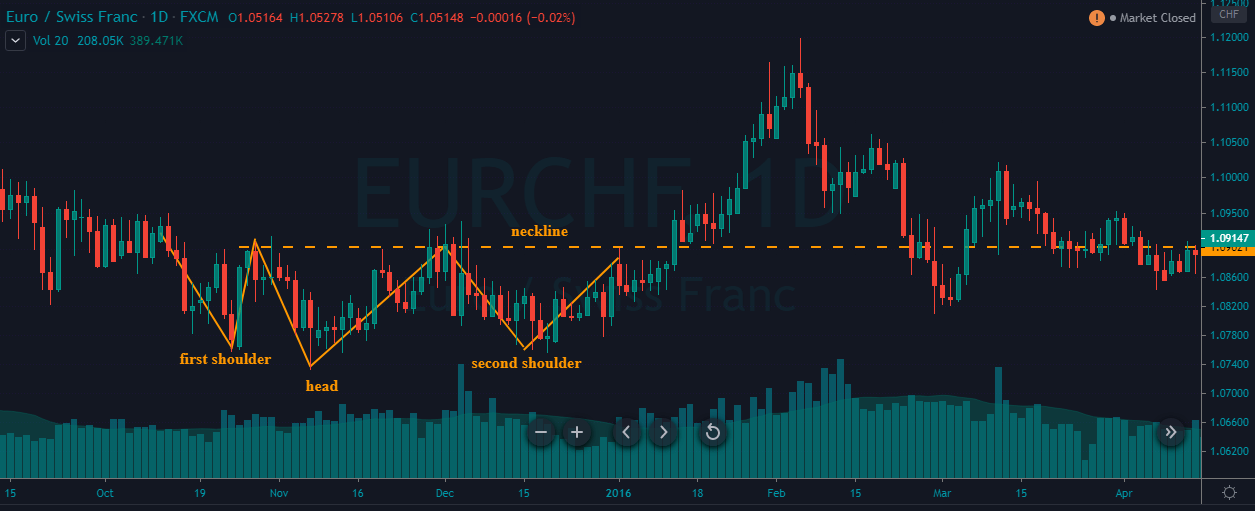
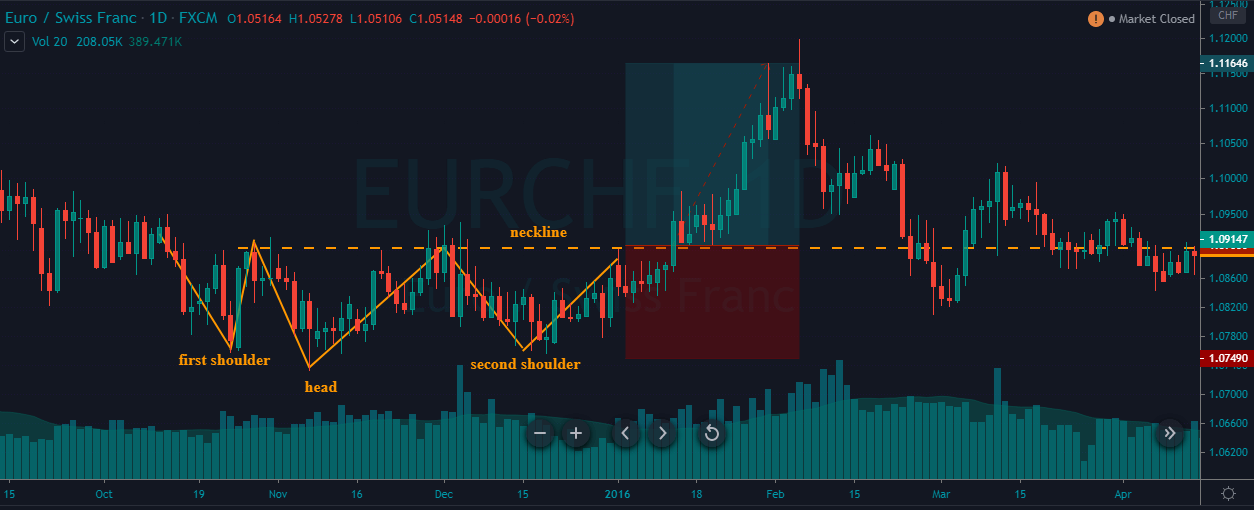
On the other hand, in the previous figure, we distinguish the progress of a head and shoulders pattern, which has its neckline at the level of 27,457.5. The bearish breakdown developed during the September 21st trading session, and its subsequent pullback confirmed the bearish signal in the Industrial Average. In this regard, according to the head and shoulder pattern definition, this trend reversal formation has a pending bearish target located at 25,724 pts.

Similarly, if the price confirms a new lower high under the previous peak at 28,370.8 pts, it would confirm a bearish continuation pattern identified as three descending peaks, which would support the bearish scenario for Dow Jones.

In conclusion, our short-term perspective is mainly bearish as long as the price remains below 28,370.8 pts, with a bearish target established at 25,724 pts. The invalidation of our bearish scenario will occur if the Industrial Average consolidates above 28,370.8 pts.


Categories
Forex Harmonic

Head and Shoulders Often Comes with a Different Look

The Head and Shoulders formation is one of the most traded patterns in the financial market. It offers an excellent risk-reward, thus it is very fruitful if we understand and get well acquainted with it. A typical Head and Shoulders pattern that we usually see in the trading lesson is very easy to be spotted out. However, the financial market makes a lot of adjustments. Thus, the traders need to make some adjustments as well. In today’s lesson, we are going to demonstrate an example of a Head and Shoulder pattern, which is a bit different in its looks.

The price heads towards the North with good bullish momentum. It seems that it has found its resistance, where it has produced a double top. At its second rejection, it has produced a bearish engulfing candle followed by another bearish candle. Thus, we have drawn a line to show the lowest low and the highest high.

The price makes a bearish correction. It seems to have found its support. It has produced a bullish engulfing candle followed by another one. Let us assume this is the last wave’s lowest low.

The price heads towards the North and makes a breakout at the wave’s highest high. So far, it seems like an ABC pattern. However, the price produces another bearish engulfing candle followed by a bearish candle. It suggests that the price may head towards the South for a bearish move.

It makes a bearish move and seems to have found its support. The level of support produces three consecutive bullish candles. Let us draw another line here. Here is a question. Do you see anything here? If you do, you are well known with Head and Shoulder pattern. If you do not, you may have to study and work with your Head and Shoulder pattern more.

The price makes another bearish move upon producing two consecutive bearish candles. Some Head and Shoulder pattern sellers may want the price to go further down to have its support at the same neckline level. However, the price does not go towards the same neckline level. It makes a breakout at the very last lowest low. What do the sellers do here? Let us find the answer from the next chart.

The chart shows that the price heads towards the South with good bearish momentum. It may continue its move up to the first swing low from where the Head and Shoulder is initiated. The most important point here is the price gets bearish once it makes a breakout at the level of support drawn by the black line. This is the neckline of the Head and Shoulder. It may get difficult to find out since many sellers may wait for the price to have a bounce at the around the same level where the price produces its neck. As mentioned, this world is not perfect, neither the Forex market is. We often need to adjust in the market to trade. Today’s lesson is one of the examples of that.

Categories
Forex Course

117. How to Trade the ‘Head and Shoulders’ Forex Chart Pattern?

Introduction

The Head and Shoulders formation is a popular Forex chart pattern, which is pretty easy to recognize on the price charts. There are both bullish and bearish Head and Shoulders patterns, and both indicate potential market reversals. This pattern consists of three peaks, which is developed after a strong bullish trend. The first and third peaks are of the same height, and they are classified as shoulders. The second peak of the pattern is the highest and hence classified as the head.

There are both bullish and bearish Head and Shoulder patterns. The appearance of bullish Head and Shoulder pattern on the price chart indicates that the momentum is transferring from the sellers to buyers. Likewise, the appearance of the Bearish Head and Shoulder pattern indicates the momentum is transferring from the buyers to sellers. While trading the Bearish Head and Shoulders pattern, it is advisable to go short when the price breaks below the neckline. Contrarily, go long when the price goes above the neckline while trading the Bullish pattern.

How To Trade The Head And Shoulders Pattern?

It is advisable not to wait for the perfect pattern instead look for the good entry/exits when you spot the pattern on the price chart. Sometimes the left shoulder will be bigger than the right shoulder and vice-versa. Please do not focus on minute details. Instead, our focus must be on deciding if the pattern looks reliable enough to trade or not. If the answer is yes, only then take entries.

Trading The Bearish Head And Shoulders Pattern

The below chart represents the formation of the Head and Shoulder pattern on the NZD/JPY forex pair.

As you can see, in the below NZD/JPY chart, the formation of the pattern doesn’t look perfect, but the overall pattern looks reliable to trade. We went short as soon as the price action broke below the neckline. The stop-loss order was placed above the second shoulder. For TP, we went double the size of the pattern. We had exited the market when the price got consolidated, as it implies the opposite party is gaining strength.

Trading The Bullish Head And Shoulders Pattern

In the below chart, we have identified the Bullish Head and Shoulder pattern in the EUR/CHF Forex pair.

In a choppy downtrend, a bullish Head and Shoulder pattern is formed. When the price goes above the neckline, it is an indication for us to go long. The take-profit is again placed two times the size of the pattern, and the stop-loss is just below the second shoulder.

In the above chart, we can clearly see that the Bullish Head and Shoulder pattern is not perfect, like the ones we see in textbooks. But still, our trade worked beautifully. So it is crucial to bends our rules here and there; we will hardly find such kind of perfect patterns. If we just wait for them, we will hardly get to trade. Also, once you gain some experience in trading this pattern, you will automatically be able to decide which pattern works and which will not. Mastering any pattern requires tons of practice and patience.

That’s about identifying and trading the Head and Shoulders pattern. Advanced strategies related to this pattern can be found in our trading strategies section. Please feel free to explore. Cheers!

[wp_quiz id=”73064″]