Introduction
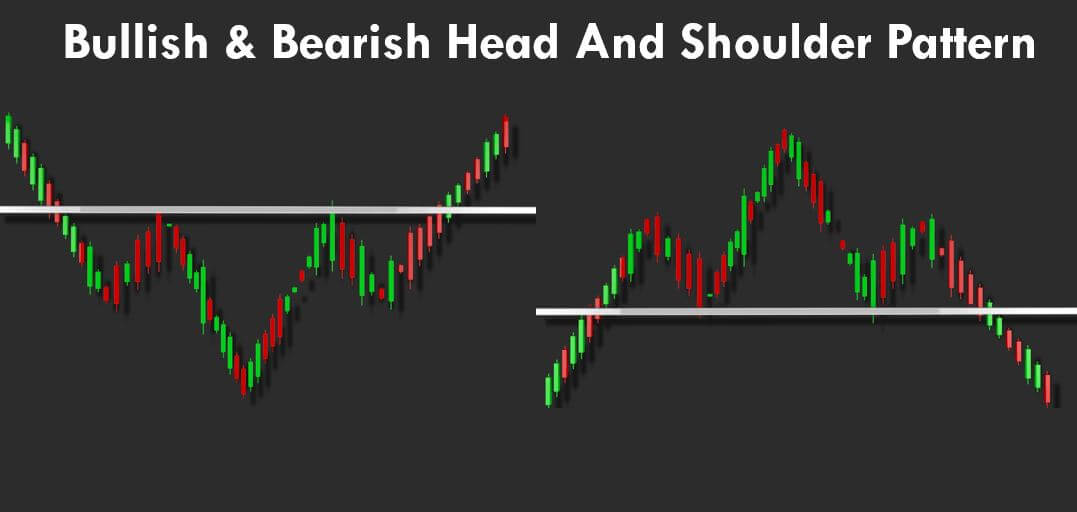
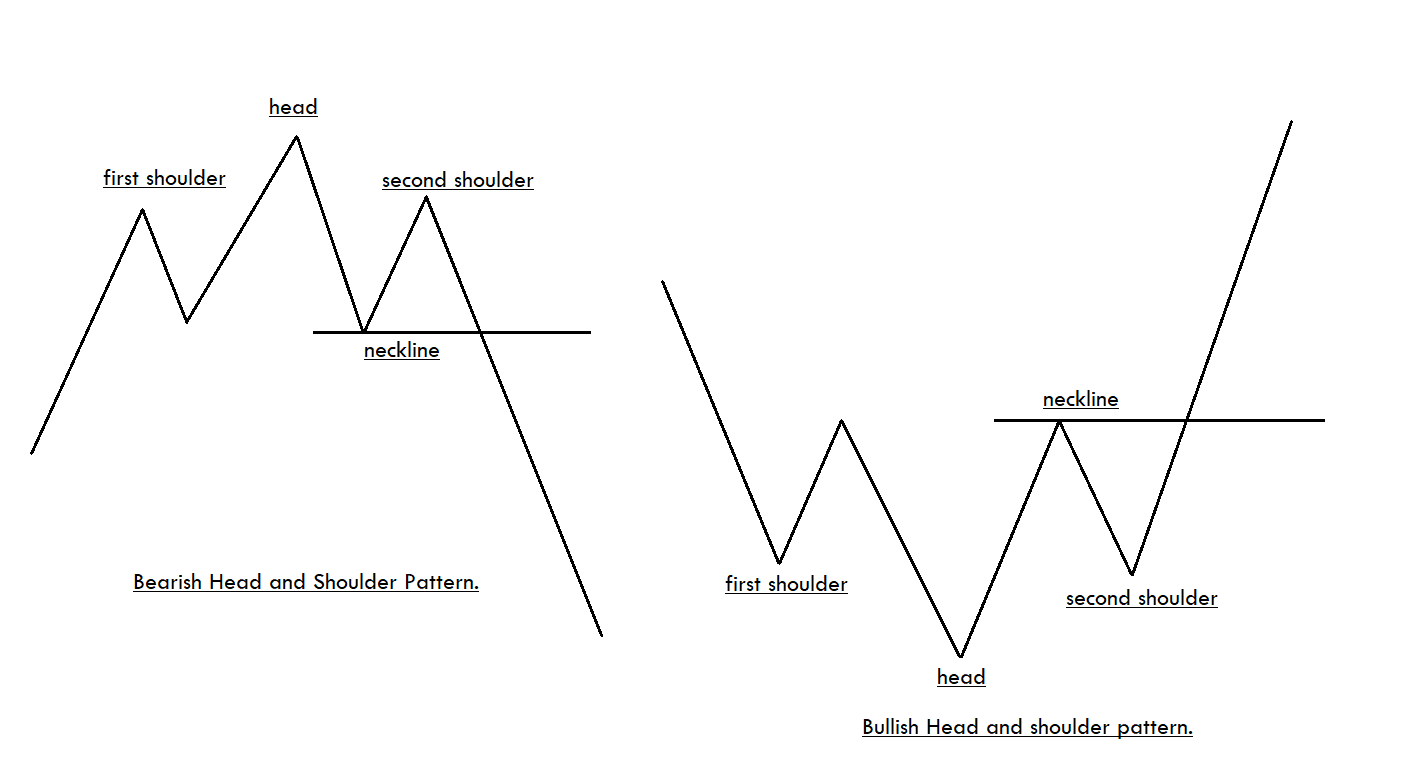
The Head and Shoulders formation is a popular Forex chart pattern, which is pretty easy to recognize on the price charts. There are both bullish and bearish Head and Shoulders patterns, and both indicate potential market reversals. This pattern consists of three peaks, which is developed after a strong bullish trend. The first and third peaks are of the same height, and they are classified as shoulders. The second peak of the pattern is the highest and hence classified as the head.
There are both bullish and bearish Head and Shoulder patterns. The appearance of bullish Head and Shoulder pattern on the price chart indicates that the momentum is transferring from the sellers to buyers. Likewise, the appearance of the Bearish Head and Shoulder pattern indicates the momentum is transferring from the buyers to sellers. While trading the Bearish Head and Shoulders pattern, it is advisable to go short when the price breaks below the neckline. Contrarily, go long when the price goes above the neckline while trading the Bullish pattern.
How To Trade The Head And Shoulders Pattern?
It is advisable not to wait for the perfect pattern instead look for the good entry/exits when you spot the pattern on the price chart. Sometimes the left shoulder will be bigger than the right shoulder and vice-versa. Please do not focus on minute details. Instead, our focus must be on deciding if the pattern looks reliable enough to trade or not. If the answer is yes, only then take entries.
Trading The Bearish Head And Shoulders Pattern
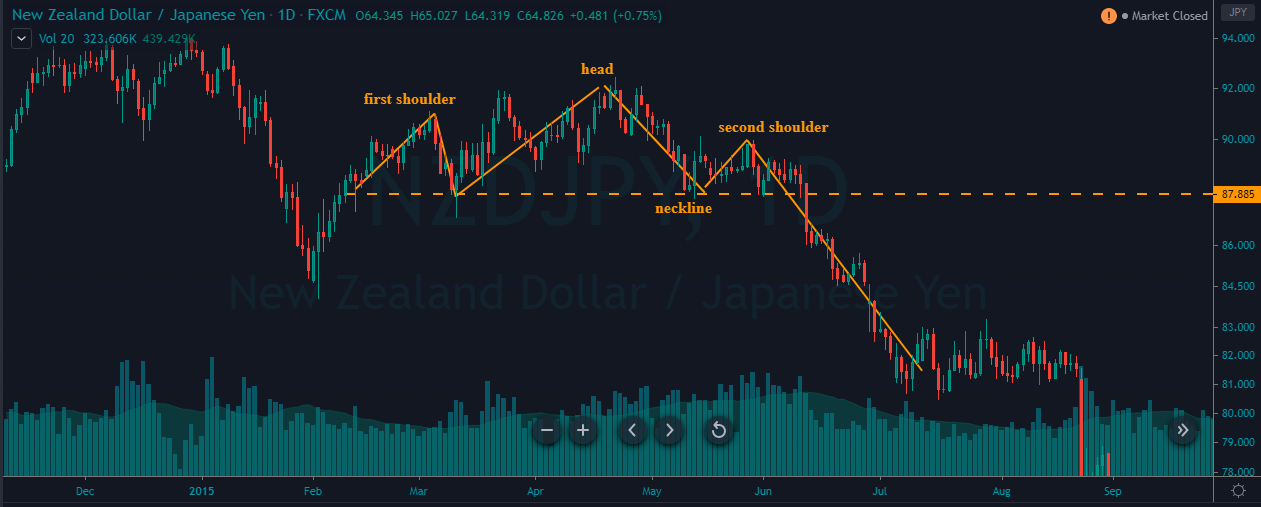
The below chart represents the formation of the Head and Shoulder pattern on the NZD/JPY forex pair.
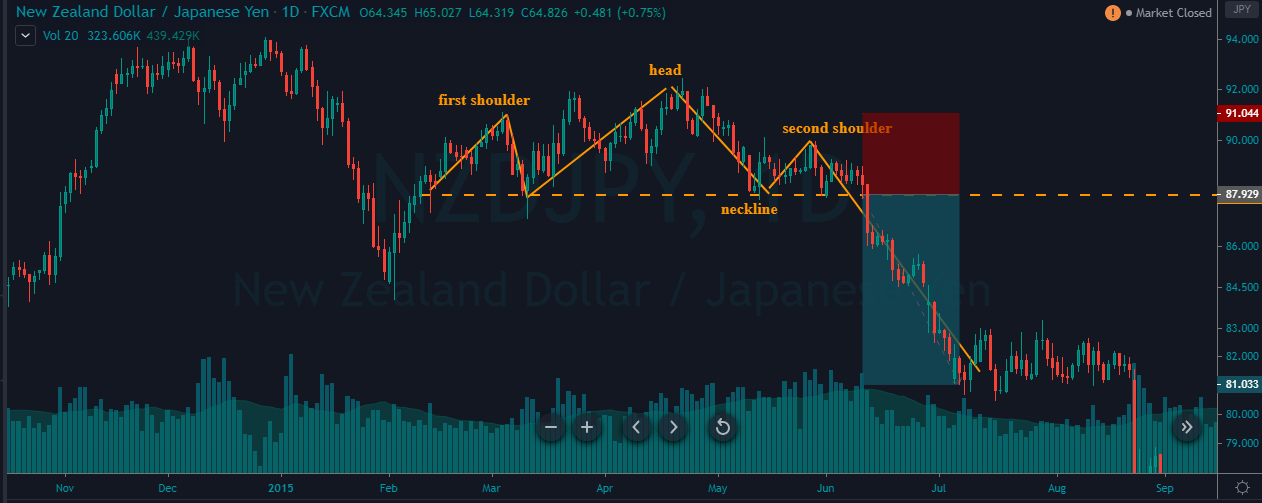
As you can see, in the below NZD/JPY chart, the formation of the pattern doesn’t look perfect, but the overall pattern looks reliable to trade. We went short as soon as the price action broke below the neckline. The stop-loss order was placed above the second shoulder. For TP, we went double the size of the pattern. We had exited the market when the price got consolidated, as it implies the opposite party is gaining strength.
Trading The Bullish Head And Shoulders Pattern
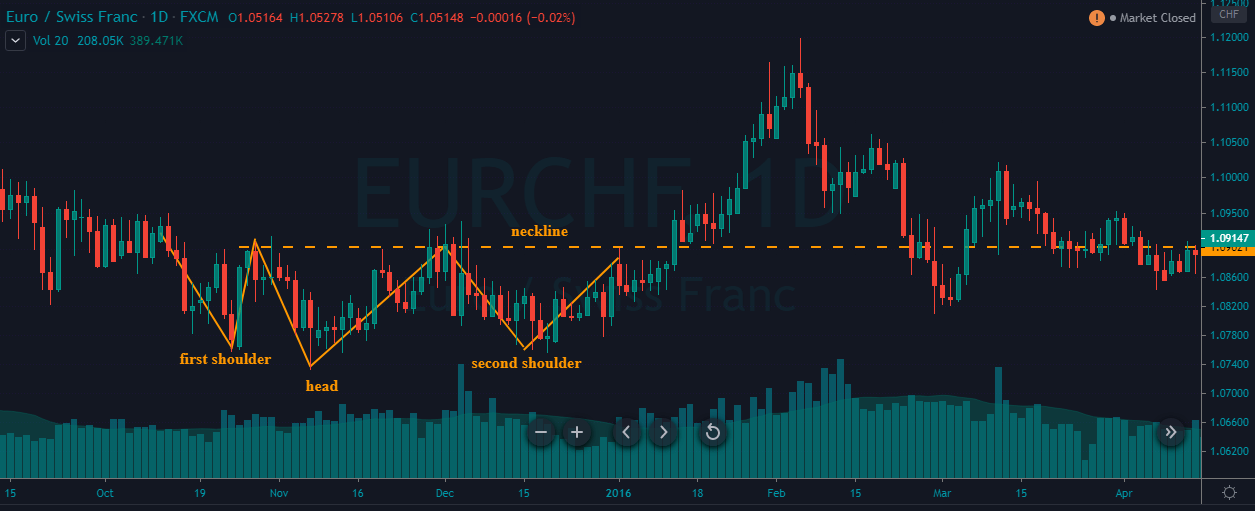
In the below chart, we have identified the Bullish Head and Shoulder pattern in the EUR/CHF Forex pair.
In a choppy downtrend, a bullish Head and Shoulder pattern is formed. When the price goes above the neckline, it is an indication for us to go long. The take-profit is again placed two times the size of the pattern, and the stop-loss is just below the second shoulder.
In the above chart, we can clearly see that the Bullish Head and Shoulder pattern is not perfect, like the ones we see in textbooks. But still, our trade worked beautifully. So it is crucial to bends our rules here and there; we will hardly find such kind of perfect patterns. If we just wait for them, we will hardly get to trade. Also, once you gain some experience in trading this pattern, you will automatically be able to decide which pattern works and which will not. Mastering any pattern requires tons of practice and patience.
That’s about identifying and trading the Head and Shoulders pattern. Advanced strategies related to this pattern can be found in our trading strategies section. Please feel free to explore. Cheers! [wp_quiz id=”73064″]

