Categories
Forex Harmonic

Head and Shoulders Often Comes with a Different Look

The Head and Shoulders formation is one of the most traded patterns in the financial market. It offers an excellent risk-reward, thus it is very fruitful if we understand and get well acquainted with it. A typical Head and Shoulders pattern that we usually see in the trading lesson is very easy to be spotted out. However, the financial market makes a lot of adjustments. Thus, the traders need to make some adjustments as well. In today’s lesson, we are going to demonstrate an example of a Head and Shoulder pattern, which is a bit different in its looks.

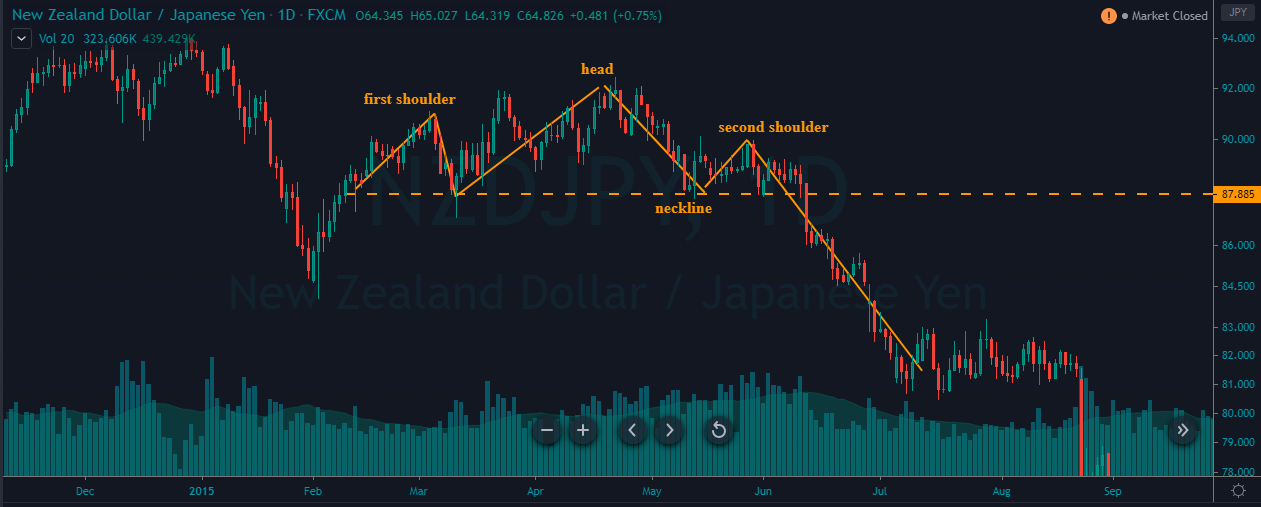
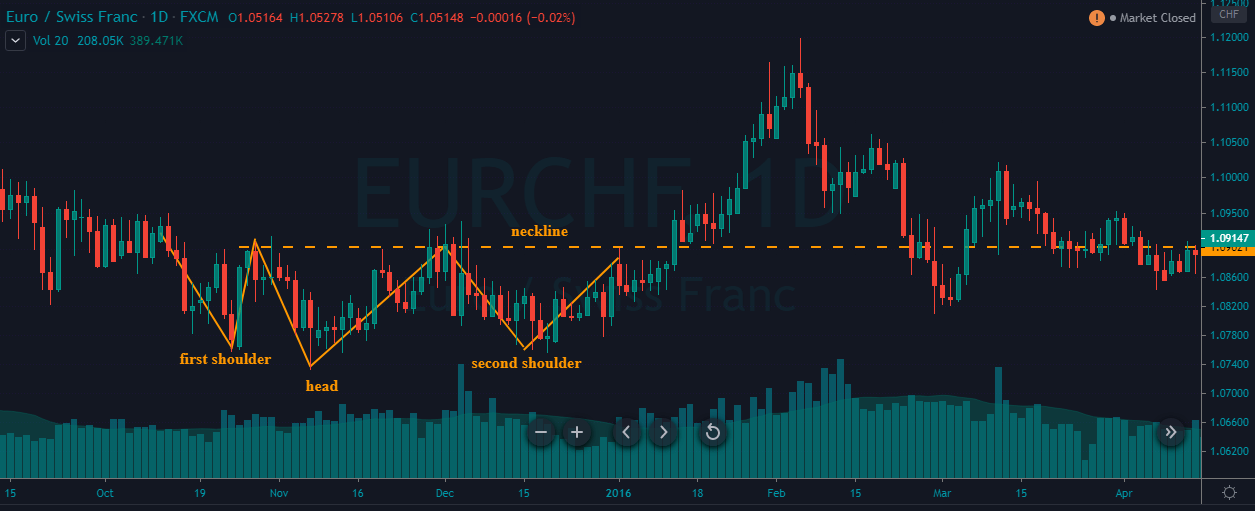
The price heads towards the North with good bullish momentum. It seems that it has found its resistance, where it has produced a double top. At its second rejection, it has produced a bearish engulfing candle followed by another bearish candle. Thus, we have drawn a line to show the lowest low and the highest high.

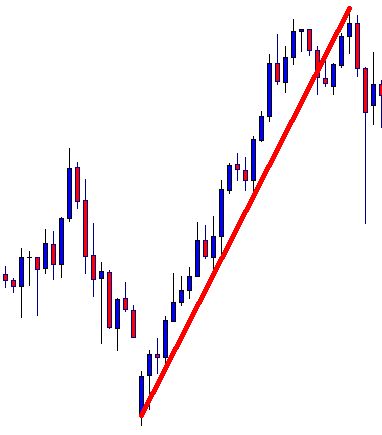
The price makes a bearish correction. It seems to have found its support. It has produced a bullish engulfing candle followed by another one. Let us assume this is the last wave’s lowest low.

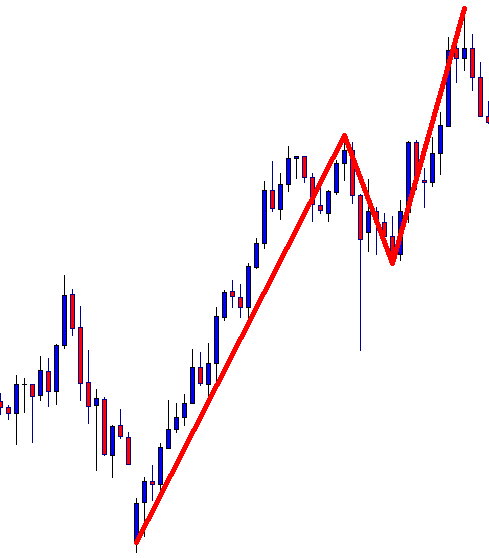
The price heads towards the North and makes a breakout at the wave’s highest high. So far, it seems like an ABC pattern. However, the price produces another bearish engulfing candle followed by a bearish candle. It suggests that the price may head towards the South for a bearish move.

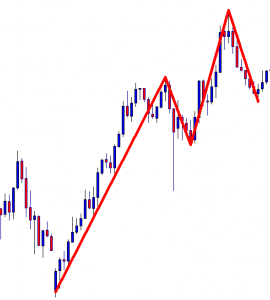
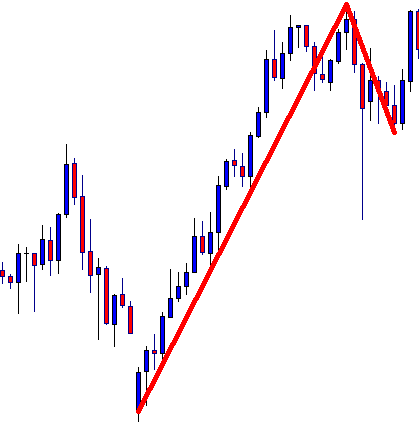
It makes a bearish move and seems to have found its support. The level of support produces three consecutive bullish candles. Let us draw another line here. Here is a question. Do you see anything here? If you do, you are well known with Head and Shoulder pattern. If you do not, you may have to study and work with your Head and Shoulder pattern more.

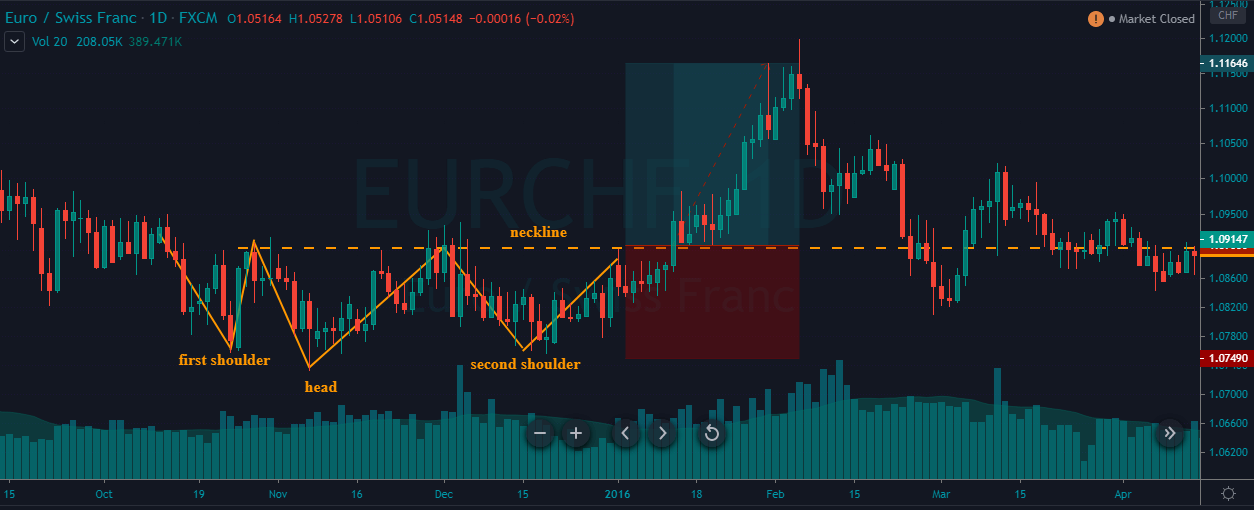
The price makes another bearish move upon producing two consecutive bearish candles. Some Head and Shoulder pattern sellers may want the price to go further down to have its support at the same neckline level. However, the price does not go towards the same neckline level. It makes a breakout at the very last lowest low. What do the sellers do here? Let us find the answer from the next chart.

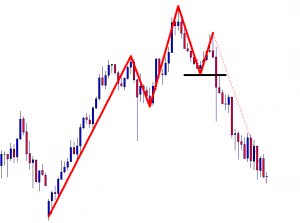
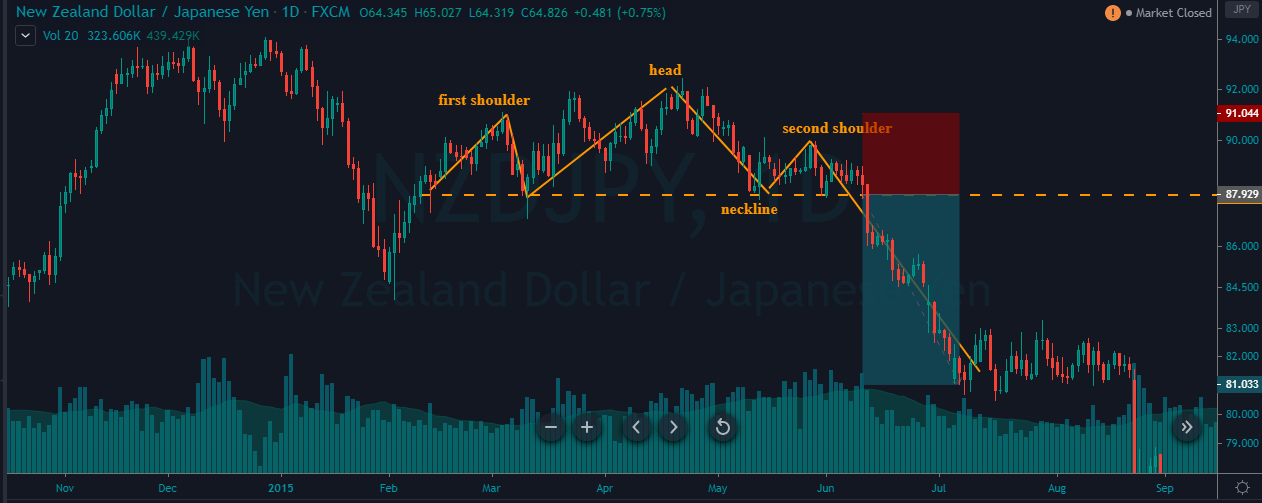
The chart shows that the price heads towards the South with good bearish momentum. It may continue its move up to the first swing low from where the Head and Shoulder is initiated. The most important point here is the price gets bearish once it makes a breakout at the level of support drawn by the black line. This is the neckline of the Head and Shoulder. It may get difficult to find out since many sellers may wait for the price to have a bounce at the around the same level where the price produces its neck. As mentioned, this world is not perfect, neither the Forex market is. We often need to adjust in the market to trade. Today’s lesson is one of the examples of that.

Categories
Forex Course

117. How to Trade the ‘Head and Shoulders’ Forex Chart Pattern?

Introduction

The Head and Shoulders formation is a popular Forex chart pattern, which is pretty easy to recognize on the price charts. There are both bullish and bearish Head and Shoulders patterns, and both indicate potential market reversals. This pattern consists of three peaks, which is developed after a strong bullish trend. The first and third peaks are of the same height, and they are classified as shoulders. The second peak of the pattern is the highest and hence classified as the head.

There are both bullish and bearish Head and Shoulder patterns. The appearance of bullish Head and Shoulder pattern on the price chart indicates that the momentum is transferring from the sellers to buyers. Likewise, the appearance of the Bearish Head and Shoulder pattern indicates the momentum is transferring from the buyers to sellers. While trading the Bearish Head and Shoulders pattern, it is advisable to go short when the price breaks below the neckline. Contrarily, go long when the price goes above the neckline while trading the Bullish pattern.

How To Trade The Head And Shoulders Pattern?

It is advisable not to wait for the perfect pattern instead look for the good entry/exits when you spot the pattern on the price chart. Sometimes the left shoulder will be bigger than the right shoulder and vice-versa. Please do not focus on minute details. Instead, our focus must be on deciding if the pattern looks reliable enough to trade or not. If the answer is yes, only then take entries.

Trading The Bearish Head And Shoulders Pattern

The below chart represents the formation of the Head and Shoulder pattern on the NZD/JPY forex pair.

As you can see, in the below NZD/JPY chart, the formation of the pattern doesn’t look perfect, but the overall pattern looks reliable to trade. We went short as soon as the price action broke below the neckline. The stop-loss order was placed above the second shoulder. For TP, we went double the size of the pattern. We had exited the market when the price got consolidated, as it implies the opposite party is gaining strength.

Trading The Bullish Head And Shoulders Pattern

In the below chart, we have identified the Bullish Head and Shoulder pattern in the EUR/CHF Forex pair.

In a choppy downtrend, a bullish Head and Shoulder pattern is formed. When the price goes above the neckline, it is an indication for us to go long. The take-profit is again placed two times the size of the pattern, and the stop-loss is just below the second shoulder.

In the above chart, we can clearly see that the Bullish Head and Shoulder pattern is not perfect, like the ones we see in textbooks. But still, our trade worked beautifully. So it is crucial to bends our rules here and there; we will hardly find such kind of perfect patterns. If we just wait for them, we will hardly get to trade. Also, once you gain some experience in trading this pattern, you will automatically be able to decide which pattern works and which will not. Mastering any pattern requires tons of practice and patience.

That’s about identifying and trading the Head and Shoulders pattern. Advanced strategies related to this pattern can be found in our trading strategies section. Please feel free to explore. Cheers!

[wp_quiz id=”73064″]
Categories
Crypto Videos

Make Huge Profits Market Pattern Trading In Crypto (Head and Shoulders, Triangles, Wedges) Part 2/2


pattern trading in cryptocurrencies (Head and Shoulders, Triangles, Wedges) – part 2/2

This part of the guide will cover various triangle formations as well as wedges.

Triangles

Triangles come in three formations:
Ascending triangle
Descending triangle
Symmetrical triangle

Ascending triangle

Traders can spot an ascending triangle by the price going up and down between the constant line of resistance and the rising support.
The ascending triangle is widely considered to be a bullish formation, which leads to massive profits if approached the right way.
However, those not careful enough might consider taking a position near the support line in hopes of enhancing their gains, only to end up with a loss as formation didn’t complete, and the price movement turns to be a double or triple top bearish formation.
Targeted prices are measured by the widest distance between the highs and the lows, and applied up from the point of the breakout.
Experienced traders will wait for a confirmation of the upward breakout accompanied by a much bigger volume before taking a position, as breakouts without an increase in volume can catch traders in a bull-trap (as we showed on the chart).

Descending Triangle

A descending triangle is considered a typical bearish formation. For it to form, the price action needs to flow between a steady support line and descending resistance.
The pattern is confirmed only once a downward breakout with increased volume happens. Only then can a trader expect the continuation of the price movement to the downside.
Just like with ascending triangles, the price target is equal to the widest swing inside the triangle transferred from the breakout point to the downside.

One of the most famous descending triangles in cryptocurrencies is the one that formed on the 2018 Bitcoin chart.

Symmetrical triangle

These triangles are probably the most common formations in cryptocurrency trading. However, at the same time, they are the most unpredictable.

As the symmetrical triangle approaches its closure, the trading volume drops as traders are often indecisive about whether the price will unfold to the upside or downside. When the war between the bulls and the bears resolves, we get two outcomes: positive and negative.
Any of these breakout movements will be followed by an increase in volume, which will be even more visible due to the reduced trading volume before the breakout.
Once the breakout happens, traders can expect the target price to be the same distance as the distance between the breakout side and the base of the triangle.

Wedges

Wedges are very common formations in crypto trading as well. They are considered a multiple price wave reversal patterns.
The price action in a wedge swings from highs to lows multiple times before breaking out of the pattern.
Wedge formations come in two forms:

Rising wedges
Falling wedges

Rising wedge

As opposed to the ascending triangle formation, the rising wedge has price swings that travel through highs and lows, but both the highs and lows are getting higher. This formation announces a bullish trend reversal into a strong bearish sentiment.

Falling wedge

The falling wedge formation, on the other hand, looks like a mirror image of the rising wedge and announces a trend reversal from bearish to bullish.

As with other patterns, it is advisable for traders to get the confirmation of the breakout before taking a position.
The minimum targeted price for the falling wedge is the exact opposite of the ascending wedge.

One thing to notice is that, in the cryptocurrency market, peaks do not necessarily follow highs and lows in an exact straight line. They are rather just close enough in the price range to mark the formation.

Categories
Crypto Market Analysis

XMR/BTC Head and Shoulders Confirmed


Monero (XMR)


Market Cap: $2.16B

Circulating Supply: 16.12M XMR

 Max Supply: 0 XMR

Volume (24h) $36.49M

XMR/USD = $132.77


Technical Analysis


XMR/BTC dropped sharply today but failed to reach the 0.01950010 yesterday’s low. It is expected to drop further as the Head and Shoulders pattern is confirmed now. The price has increased a little in the short term, but it was only a temporary rebound. The crypto is on a declining path in the short term and maybe you can still go short on it.

The rate is pressuring a dynamic support, so a valid breakdown will confirm a further drop towards the next downside targets.


XMR/BTC dropped again below the upside 50% Fibonacci line (descending dotted line) of the descending pitchfork but it remains to be seen if this will really be a valid breakdown or if we’ll have another false breakdown.

You can see that the 50% Fibonacci line acts like a very strong dynamic support and has rejected the rate in the last weeks. A valid breakdown will confirm a further drop towards the median line (ML) of the descending pitchfork and towards the major uptrend line.

The failure to reach and retest the upper median line (UML) of the descending pitchfork has signalled a high selling pressure. It has broken below the lower median line (lml) of the black descending pitchfork.


Conclusion


Right now we don’t have a great selling opportunity but only because the sell-off has already started, but you could still go short if the rate will close above or if it will stabilise below the 50% Fibonacci line. The next major target will be at the uptrend line.