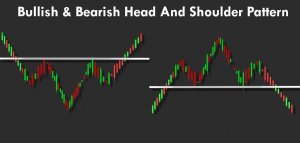
The Head and Shoulders formation is one of the most traded patterns in the financial market. It offers an excellent risk-reward, thus it is very fruitful if we understand and get well acquainted with it. A typical Head and Shoulders pattern that we usually see in the trading lesson is very easy to be spotted out. However, the financial market makes a lot of adjustments. Thus, the traders need to make some adjustments as well. In today’s lesson, we are going to demonstrate an example of a Head and Shoulder pattern, which is a bit different in its looks.
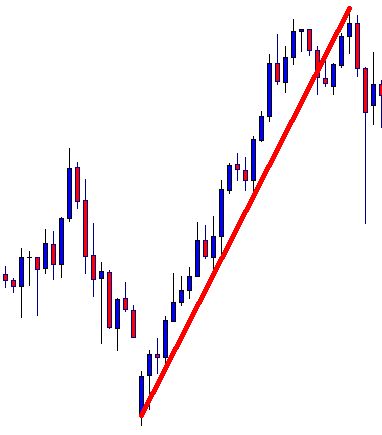
The price heads towards the North with good bullish momentum. It seems that it has found its resistance, where it has produced a double top. At its second rejection, it has produced a bearish engulfing candle followed by another bearish candle. Thus, we have drawn a line to show the lowest low and the highest high.
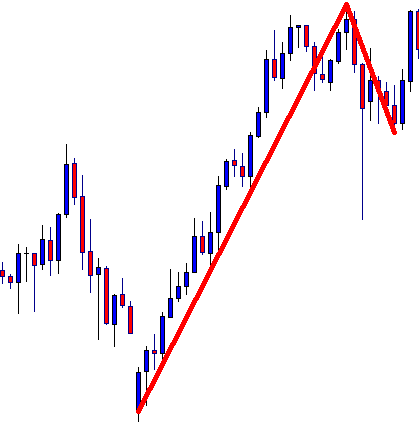
The price makes a bearish correction. It seems to have found its support. It has produced a bullish engulfing candle followed by another one. Let us assume this is the last wave’s lowest low.
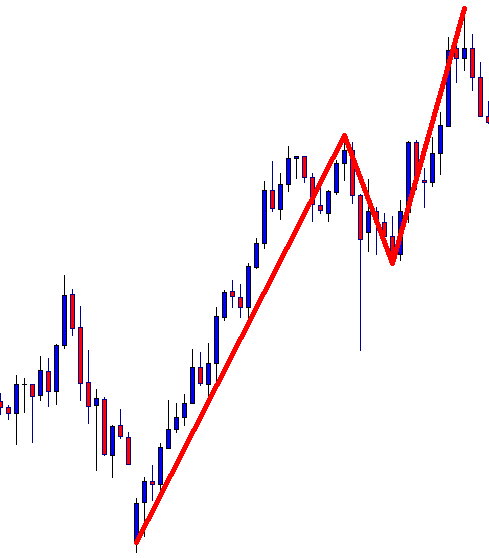
The price heads towards the North and makes a breakout at the wave’s highest high. So far, it seems like an ABC pattern. However, the price produces another bearish engulfing candle followed by a bearish candle. It suggests that the price may head towards the South for a bearish move.
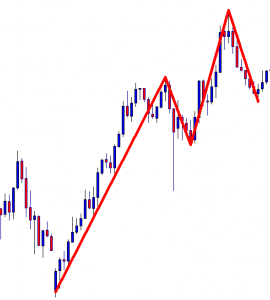
It makes a bearish move and seems to have found its support. The level of support produces three consecutive bullish candles. Let us draw another line here. Here is a question. Do you see anything here? If you do, you are well known with Head and Shoulder pattern. If you do not, you may have to study and work with your Head and Shoulder pattern more.

The price makes another bearish move upon producing two consecutive bearish candles. Some Head and Shoulder pattern sellers may want the price to go further down to have its support at the same neckline level. However, the price does not go towards the same neckline level. It makes a breakout at the very last lowest low. What do the sellers do here? Let us find the answer from the next chart.
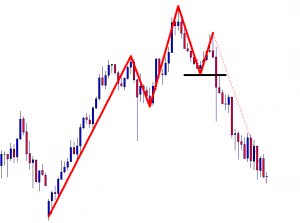
The chart shows that the price heads towards the South with good bearish momentum. It may continue its move up to the first swing low from where the Head and Shoulder is initiated. The most important point here is the price gets bearish once it makes a breakout at the level of support drawn by the black line. This is the neckline of the Head and Shoulder. It may get difficult to find out since many sellers may wait for the price to have a bounce at the around the same level where the price produces its neck. As mentioned, this world is not perfect, neither the Forex market is. We often need to adjust in the market to trade. Today’s lesson is one of the examples of that.

