Today we will examine the Market Profile Singles Indicator (we could also call it a single print indicator or gap indicator), which is available on the mql5.com market in metatrader4 and metatrader5 versions.
The developer of this indicator is Tomas Papp, who is located in Slovakia, and currently has 7 products available on the MQL5 market.
It is fair to point out that four of his products are completely FREE and are in a full-working version. These are: Close partially, Close partially MT5, Display Spread meter, Display Spread meter MT5. So it’s definitely worth a try.
Overview of the Market Profile Singles
This indicator is based on market profile theory. It was designed to show “singles areas.” But, what exactly is a singles area?
Theory of the Market Profile Singles
Singles, or single prints, or gaps of the profile are placed inside a profile structure, not at the upper or lower edge. They are represented with single TPOs printed on the Market profile. Singles draw our attention to places where the price moved very fast (impulse movements). They leave low-volume nodes with liquidity gaps and, therefore, the market imbalance. Thus, Singles show us an area of imbalance. Singles are usually created when the market reacts to unexpected news. These reports can generate extreme imbalances and prepare the spawn for the extreme emotional reactions of buyers and sellers.
The market will usually revisit this area to examine as these price levels are attractive for forex traders, as support or resistance zones. Why should these traders be there? Because the market literally flew through the area, and only a small number of traders got a chance to trade there. For this reason, these areas are likely to be filled in the future.
The author also adds: “These inefficient moves tend to get filled, and we can seek trading opportunities once they get filled, or we can also enter before they get filled and use these single prints as targets.”
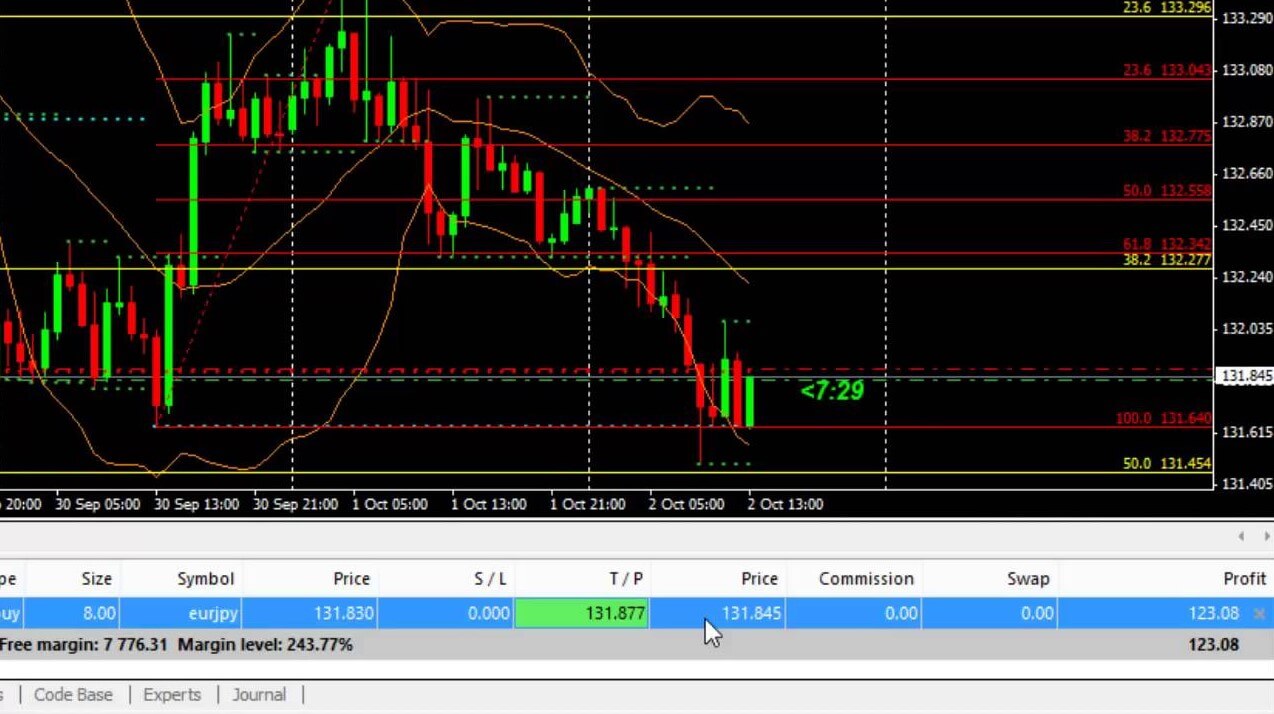
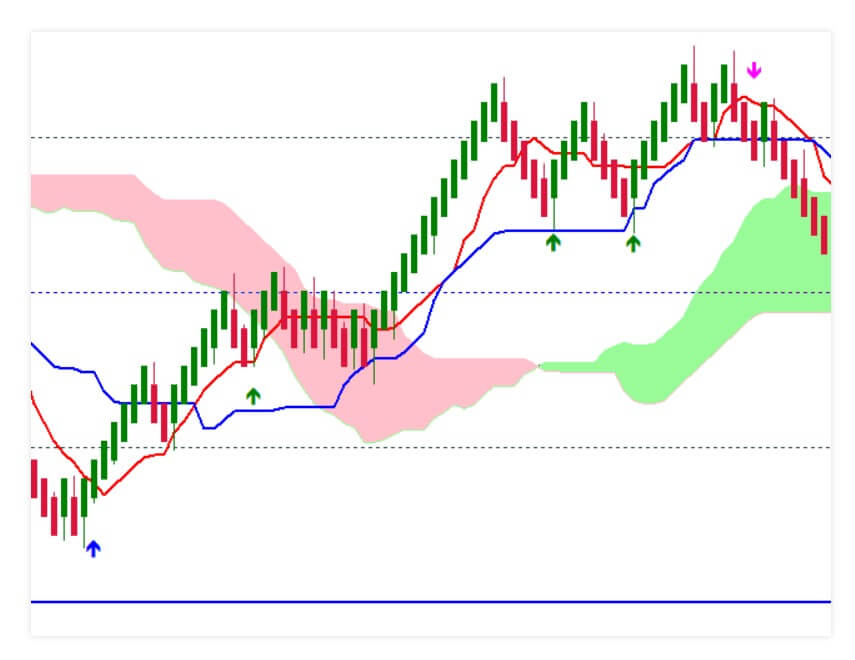
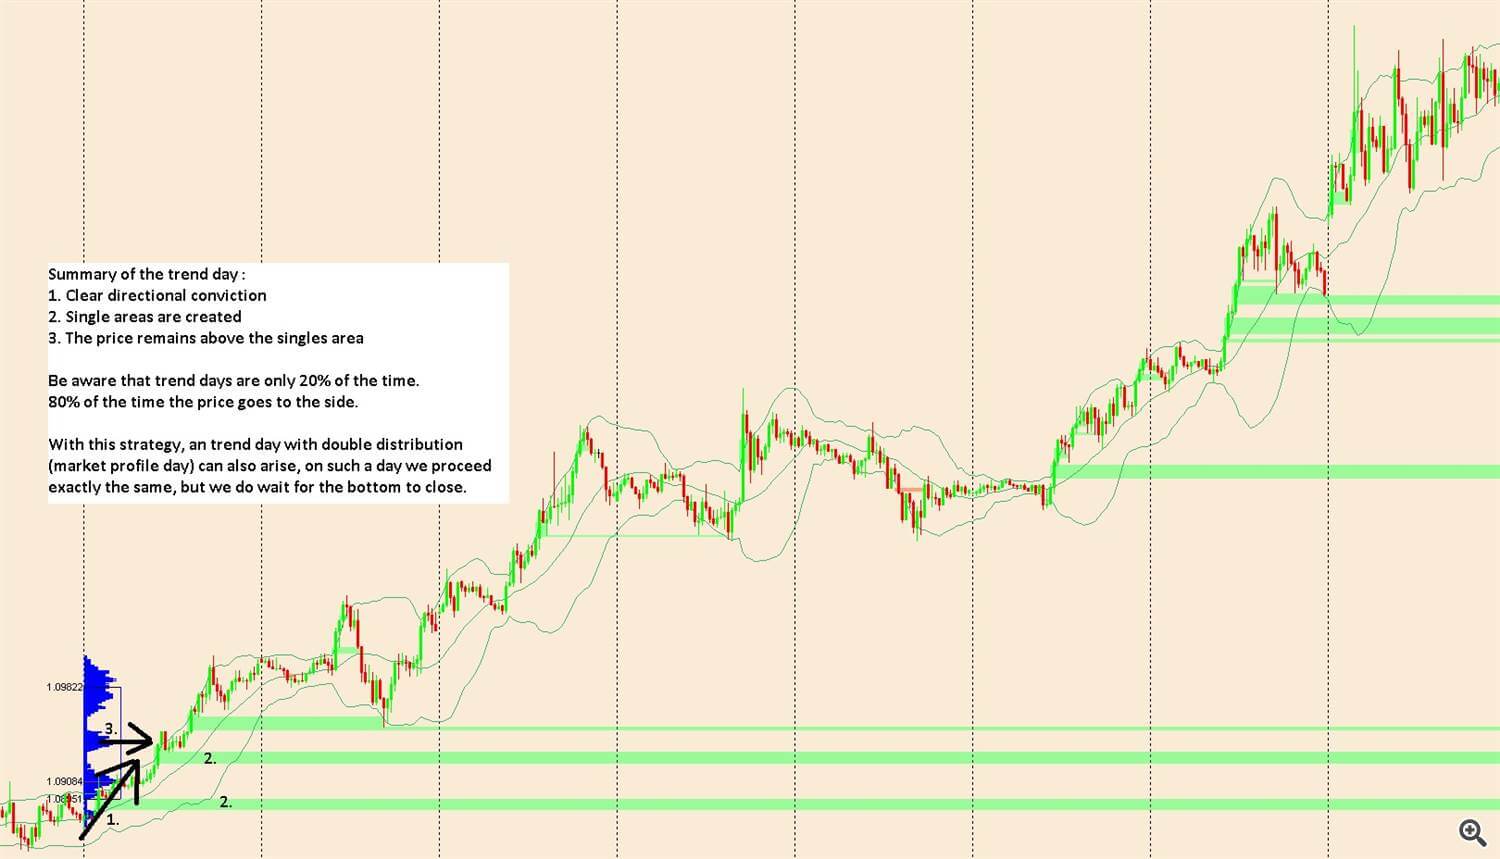
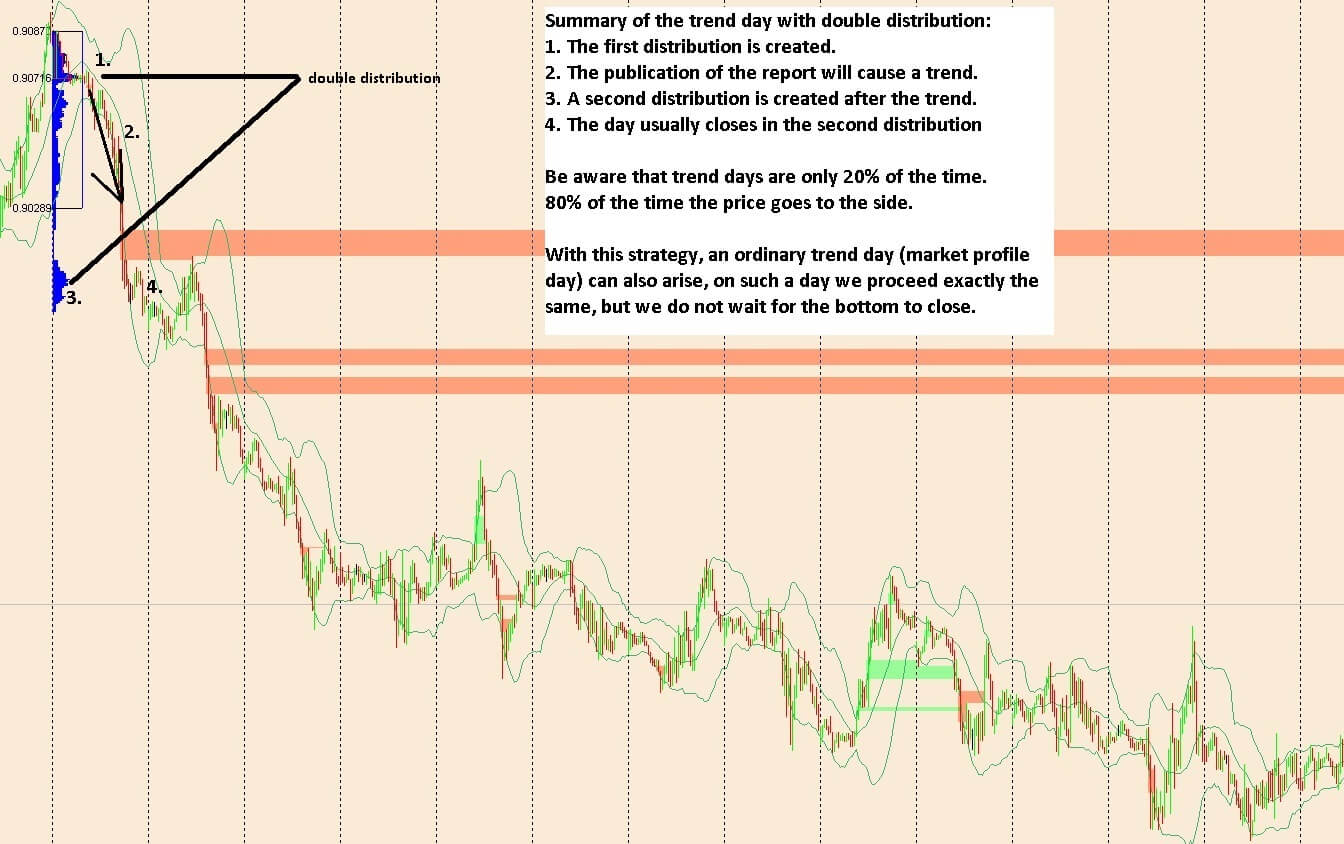
The author points out: Used as support/resistance zones, but be careful not always. Usually, it works very well on trendy days. See market profile days: trend day (Strategy 1 – BUY – third picture) and trend day with double distribution (Strategy 1 – SELL- third picture).
Practical use of the Market Profile Singles Indicator
So let’s imagine the strategies that the author himself recommends. Of course, it’s up to you whether you use these strategies or whether you trade other strategies for the singles area. Here we will review the following ones:
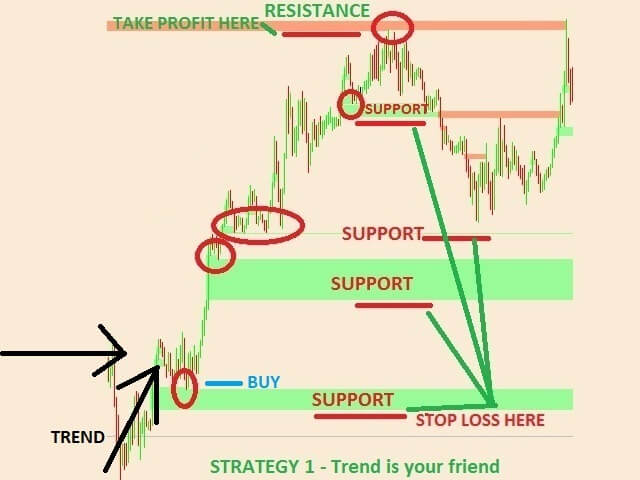
- Strategy 1: The trend is your friend
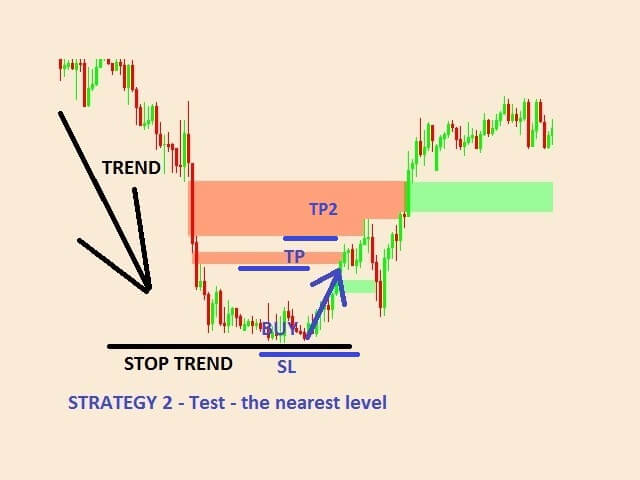
- Strategy 2: Test the nearest level
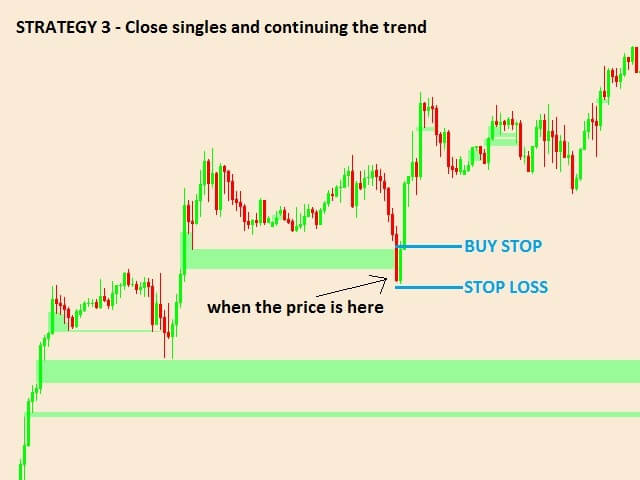
- Strategy3: Close singles and continuing the trend
The author comments that these three strategies are common and repeated in the market, so it is profitable to trade them all.
The recommended time frame is M30, especially when using Strategy 2.
It is good to start the trend day and increase the profit, but be aware that trendy days happen only 15 – 20% of the time. Therefore, the author recommends mainly strategy 2, which is precise 75-80% of the time.
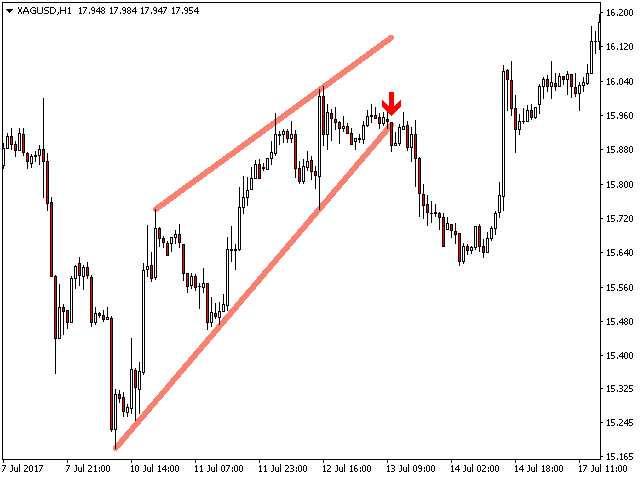
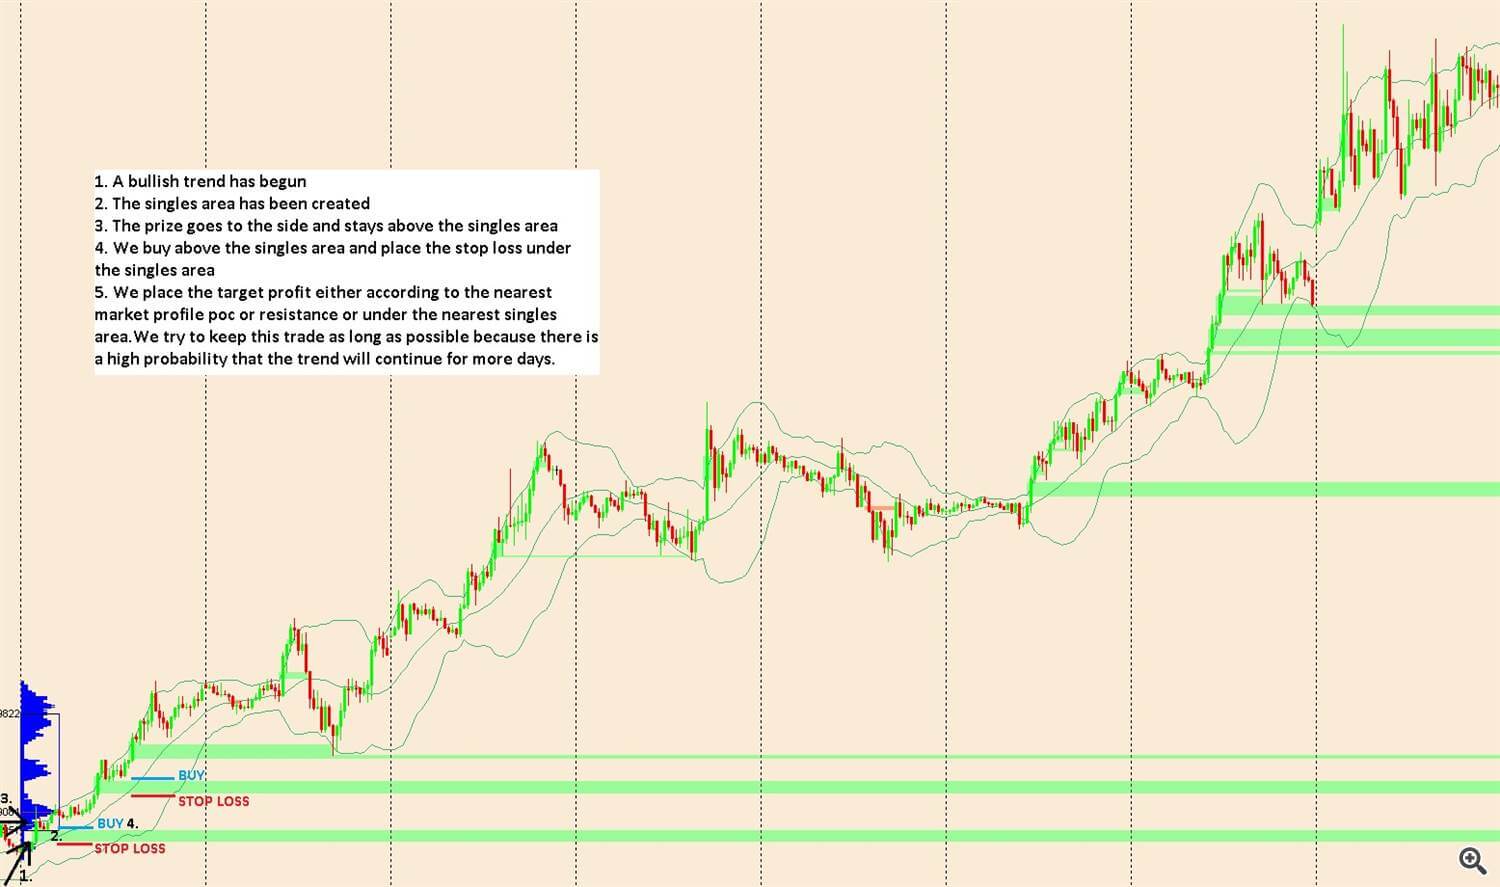
Strategy 1 – BUY :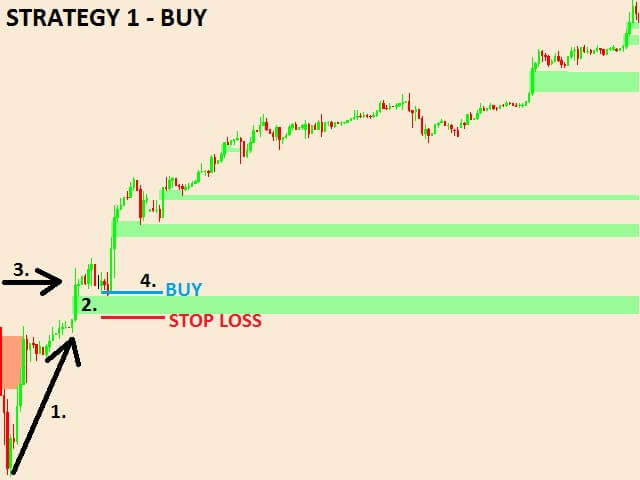
- A bullish trend has begun.
- The singles area has been created.
- The prize moves sideways and stays above the singles area.
- We buy above the singles area and place the stop loss under the singles area.
- We place the profit target either according to the nearest market profile POC or resistance or under the nearest singles area. We try to keep this trade as long as possible because there is a high probability that the trend will continue for more days.
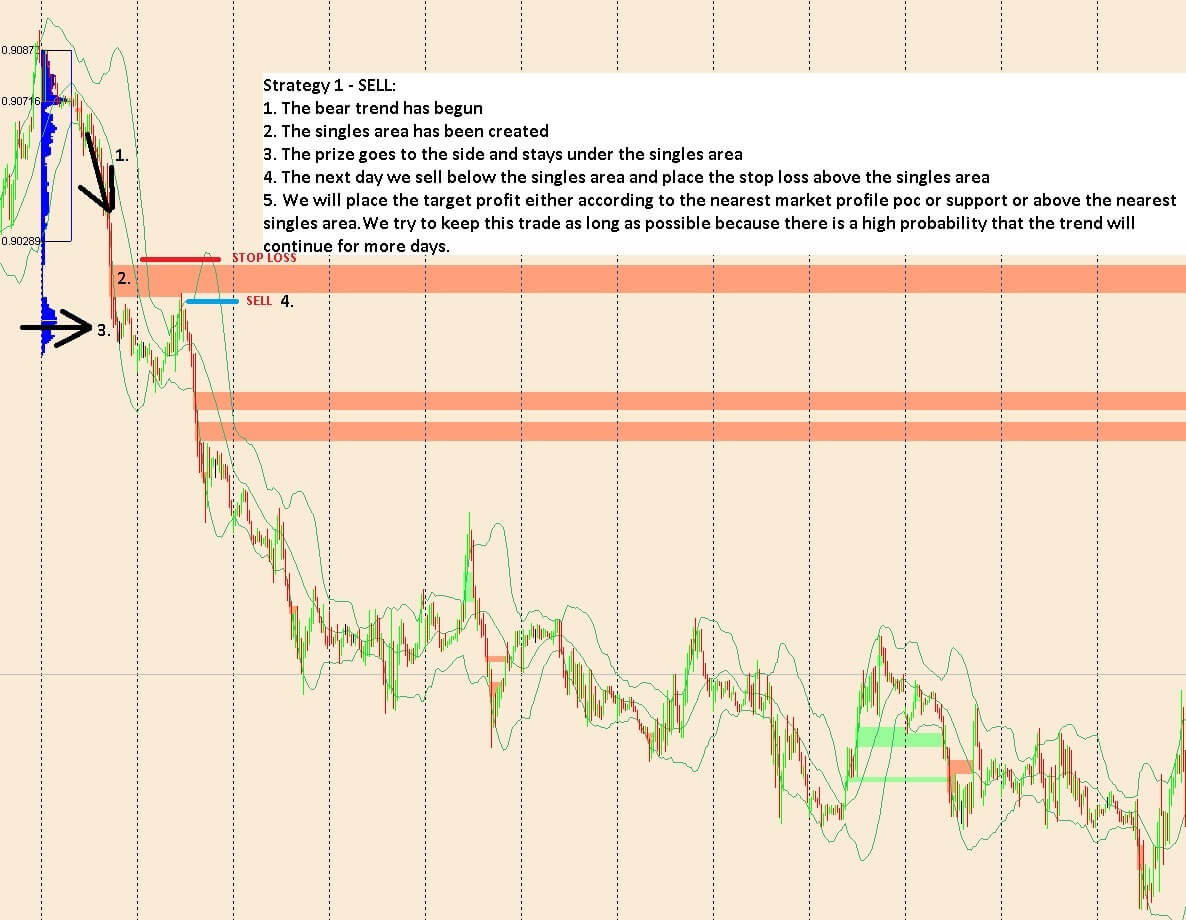
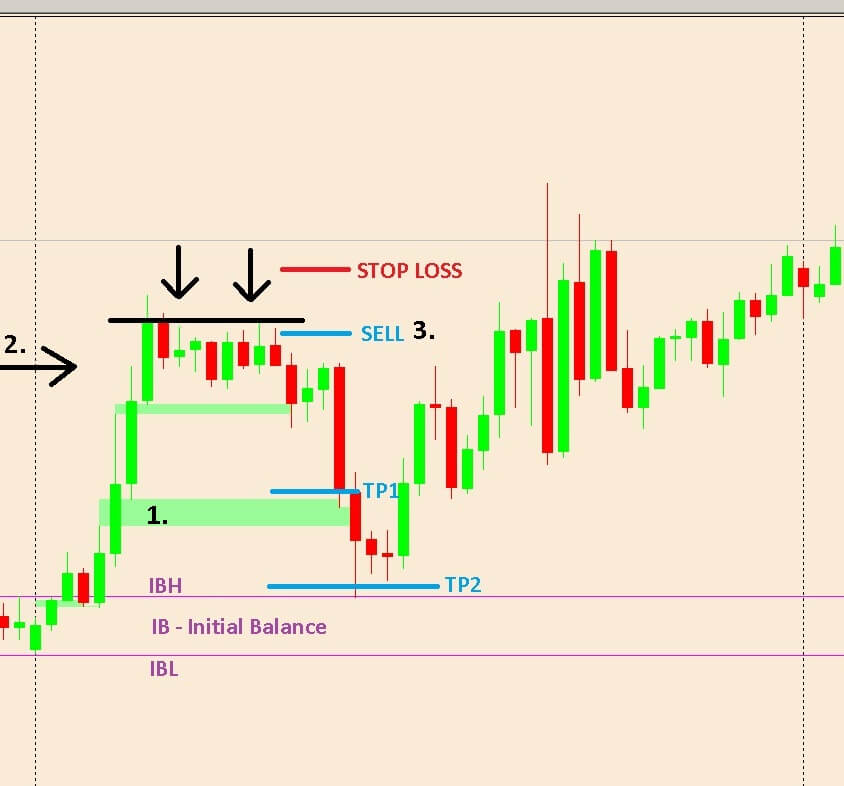
Strategy 1 – SELL :
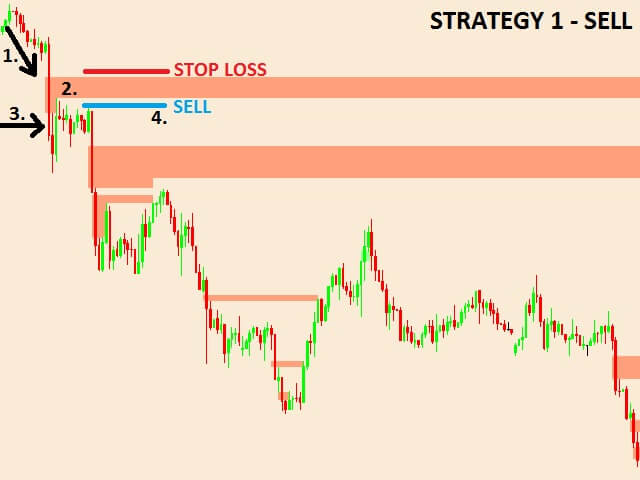
- The bear trend has begun.
- The singles area has been created.
- The prize goes to the side and stays under the singles area.
- We sell below the singles area and place the stop loss above the singles area.
- We will place the target profit either according to the nearest market profile POC or support or above the nearest singles area. We try to keep this trade as long as possible because there is a high probability that the trend will continue for more days.

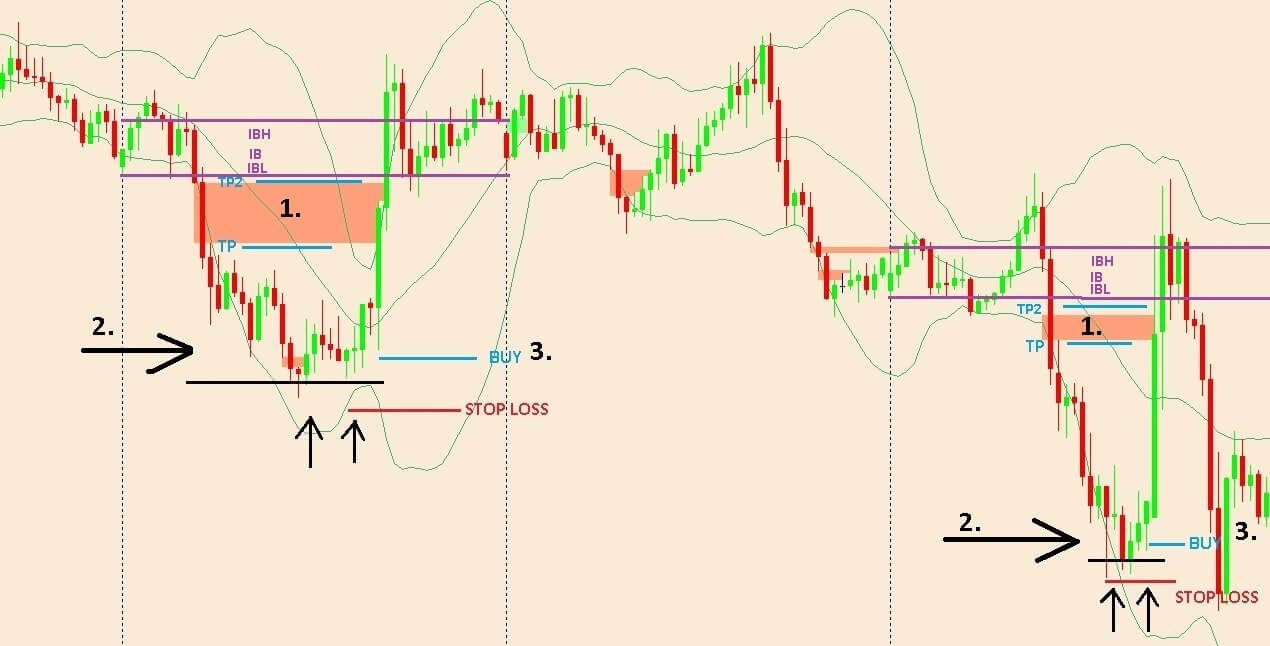
Before we start with Strategy 2, let’s explain the Initial Balance(IB) concept. IB is the price range of (usually) of the first two 30-minute bars of the session of the Market Profile. Therefore, Initial Balance may help define the context for the trading day.
The IBH (Initial Balance High) is also seen as an area of resistance, and the IBL (Initial Balance Low) as an area of support until it is broken.
Strategy 2 – one day – BUY:

This strategy will take place on a given day.
- There is a singles area near IB. (a singles area was created on a given day)
- The price goes sideways or creates a V-shape
- We expect to return to the singles area or IB. We buy low and place the stop loss below the daily low (preferably a little lower) and place the target profit below the IBL (preferably a little lower).
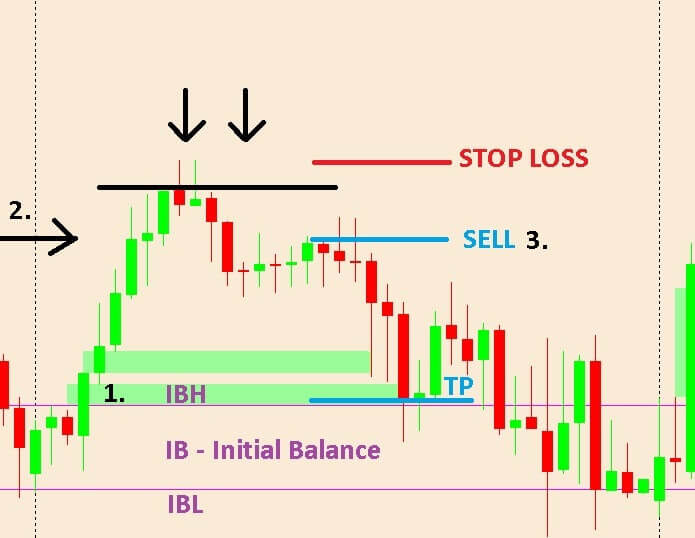
Strategy 2 – one day – SELL:
This strategy will take place on a given day.
- There is a singles area near IB. (a singles area was created on a given day)
- The price goes sideways or creates a reversed font V
- We expect to return to the singles area or IB. We sell high and place the stop loss above the daily high (preferably a little higher) and place the target profit above the IBH (preferably a little higher).
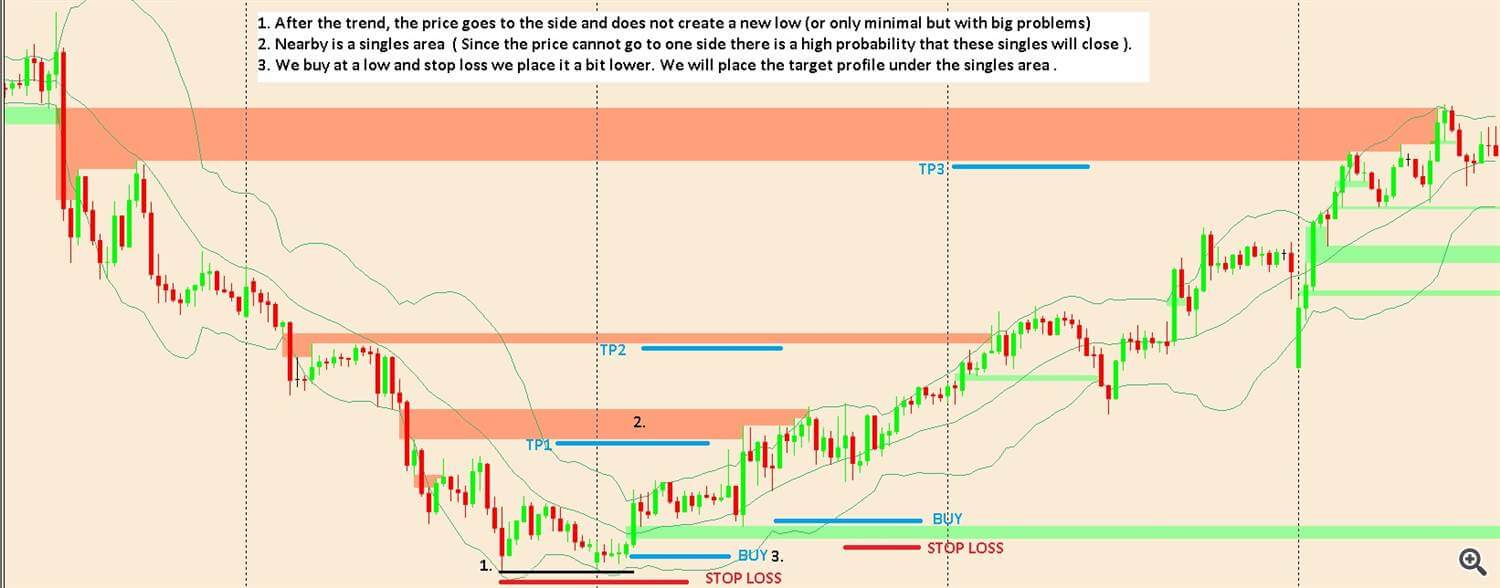
Strategy 2- more days- BUY:

This strategy takes more than one day to complete (Singles were created one or more days ago)
- After the trend, the price goes sideways and does not create a new low (or only minimal but with big problems)
- Nearby is a singles area (Since the price cannot go to one side, there is a high probability that these singles will close).
- We buy at a low, placing a stop-loss order a bit lower. We will place the target profile under the singles area.
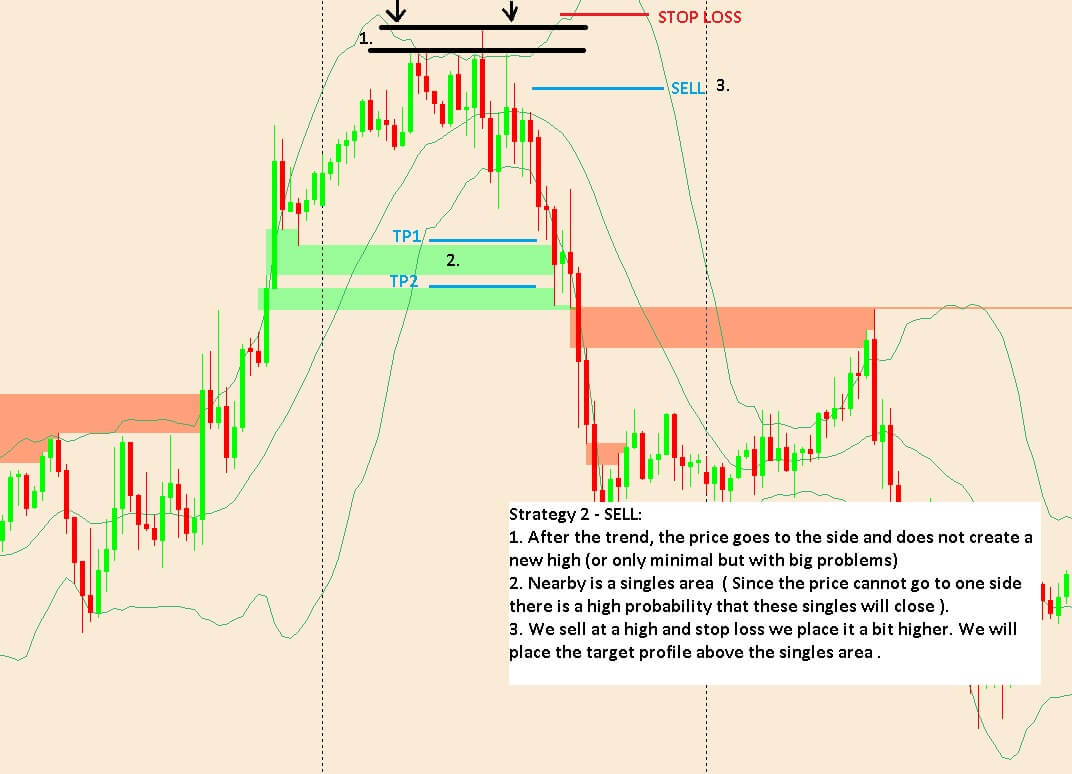
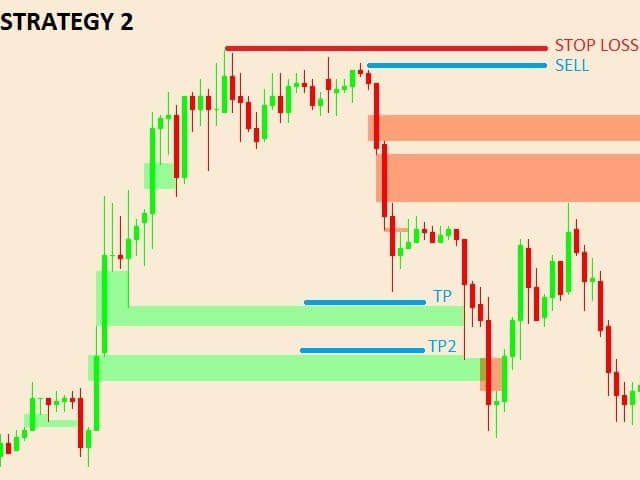
Strategy 2- more days- SELL:
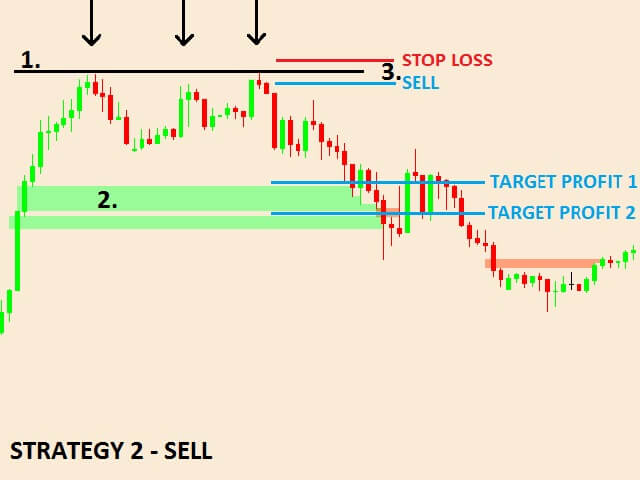
This strategy takes longer than one day (Singles were created one or more days ago)
- After the trend, the price goes to the side and does not create a new high (or only minimal but with big problems)
- Nearby is a singles area ( Since the price cannot go to one side, there is a high probability that these singles will close ).
- We sell at a high, and we place a stop-loss a bit higher. We will place the target profile above the singles area.
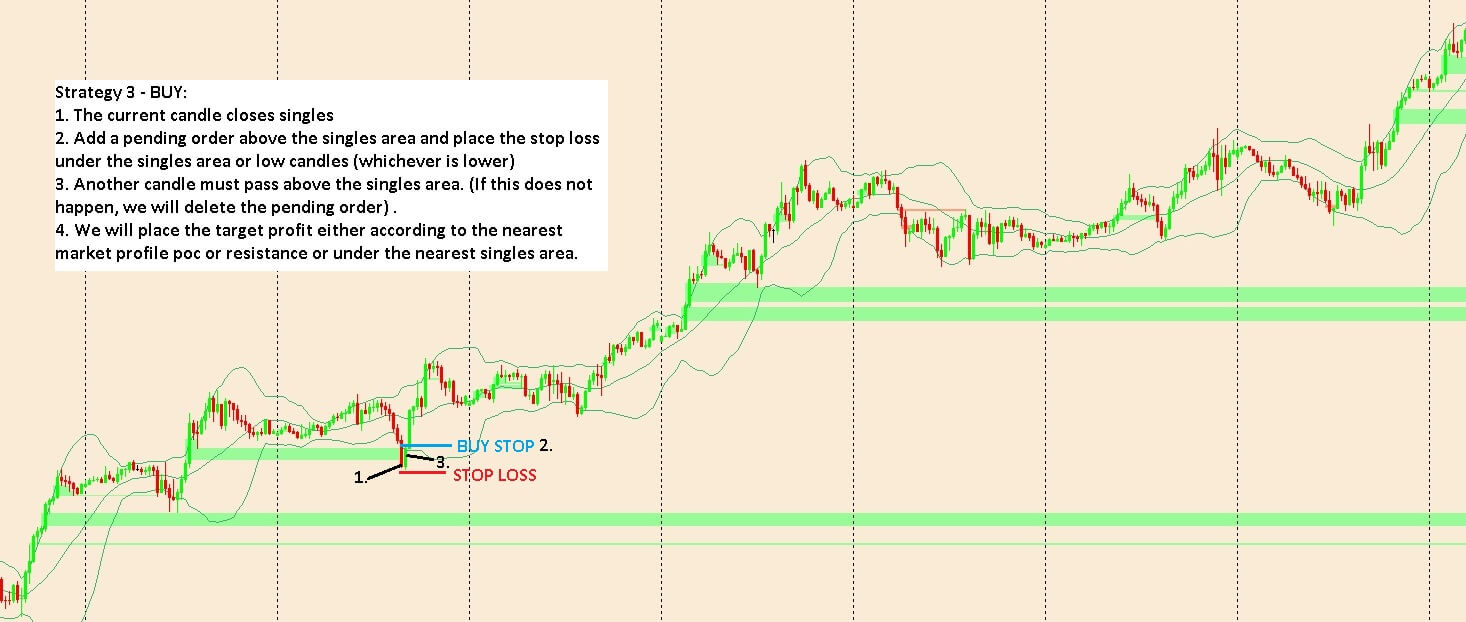
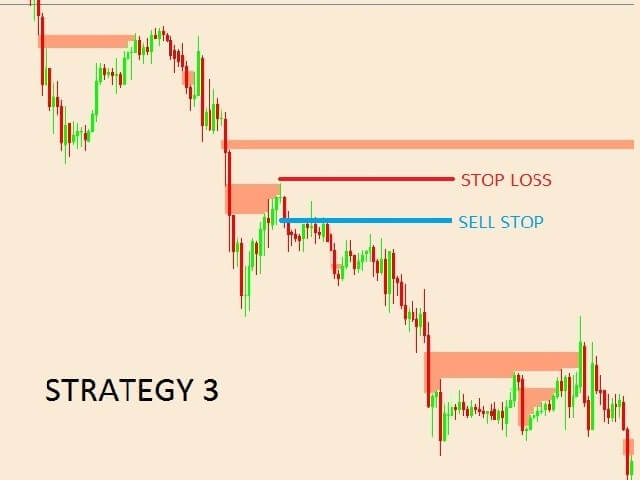
Strategy 3 – BUY:
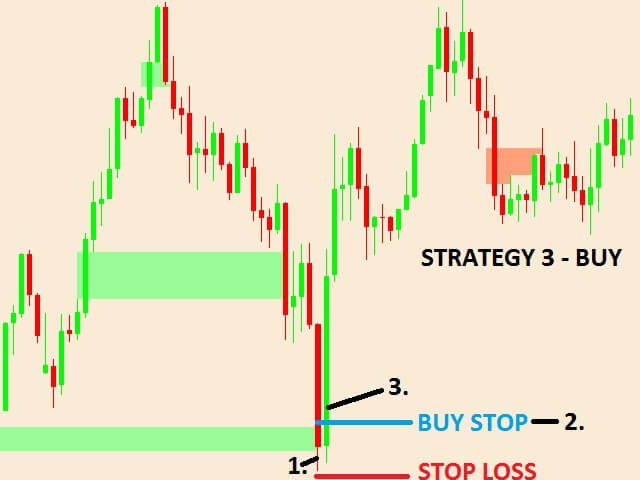
- The current candle closes singles.
- Add a pending order above the singles area and place the stop-loss under the singles area or the candle’s low. (whichever is lower)
- Another candle must occur above the singles area. (If this does not happen, we will delete the pending order) .
- We will place the profit-target either according to the nearest market profile POC or resistance or under the nearest singles area.
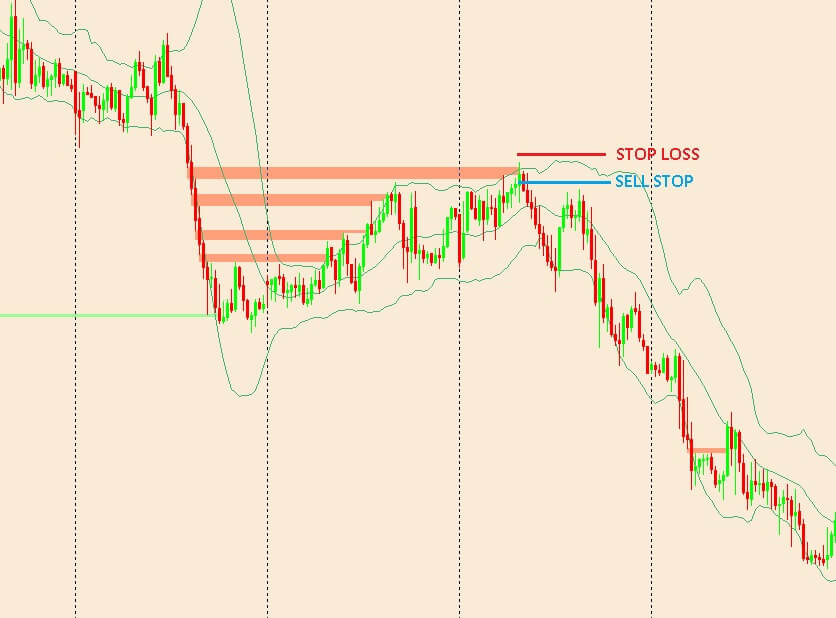
Strategy 3 – SELL: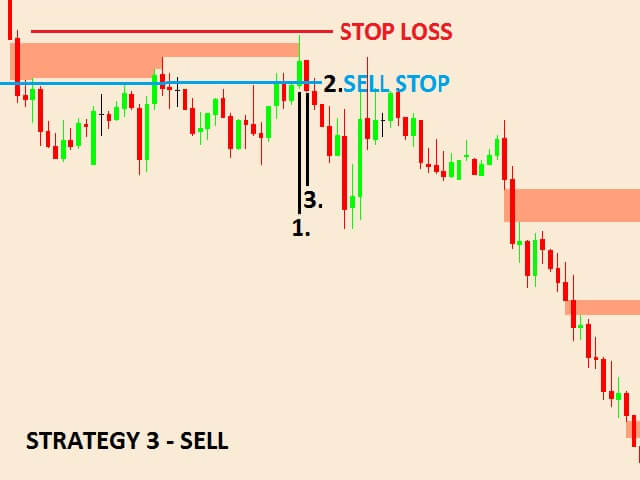
- The current candle closes singles.
- Add a pending order under the singles area and place the stop-loss above the singles area or candle’s high (whichever is higher).
- Another candle must occur under the singles area. (If this does not happen, we will delete the pending order) .
- We will place the profit-target either according to the nearest market profile POC or support or above the nearest singles area.
Discussion
These strategies look really interesting. As the author himself says:
It’s not just a strategy. There is more to it in profitable trading. For me personally, they are most important when trading: Probability of profit, patience, quality signals with a good risk reward ratio (minimum 3: 1) and my head. I think this is the most important.
In this, we must agree with the author.
Service Cost
The current cost of this indicator is $50. You are also able to rent the indicator. For a one-month rental, it is $30 per month. There is also a demo version available it is always worth testing out the demos before purchasing. Though.
After purchasing the indicator, the author sends two more indicators to his customers as a gift: Market Profile Indicator and Support and Resistance Indicator.
Conclusion: There are only 2 reviews for the indicator so far, but they have 5 stars and are very positive.
For us, this indicator is interesting, and it is a big plus that the author shares his strategies. The price is also acceptable since the indicator costs 50 USD = 5 copies (10-USD / 1 piece), and since the author sends another 2 indicators as a gift, this price is really worthwhile.
The author added:
By studying the market profile and monitoring the market, I came up with an indicator and strategies we would like to present to you. Here you can try it for free :
MT4: https://www.mql5.com/en/market/product/52715
MT5: https://www.mql5.com/en/market/product/53385
And here you can watch the video:
Also, a complete description of the strategies and all the pictures can be seen HERE :
Other completely free of charge tools:
https://www.mql5.com/en/users/tomo007/seller#products


 AlphaBeta FX (or, in short, ABFX) was founded in 2009. Their first office was based out of India, but this broker quickly expanded and operated as the first market-making firm to service the greater Asian region. ABFX has a physical presence in 7 different countries, mainly thanks to its technologically enhanced experience, precise execution methods, and advantageous trading conditions.