Categories
Forex Market Analysis

Daily F.X. Analysis, October 01 – Top Trade Setups In Forex – Manufacturing PMI in Highlights! 

On the news front, the eyes will remain on the series of services PMI figures from the Eurozone and the U.K. Most of the data is expected to be neutral; however, the U.S. Unemployment Claims and Manufacturing PMI will be the main highlight of the day. Claims are expected to perform better, while the ISM Non-Manufacturing PMI is expected to report negative figures. Mixed bias prevail for the U.S. dollar today.

Economic Events to Watch Today  


EUR/USD – Daily Analysis

The EUR/USD closed at 1.17208 after placing a high of 1.17548 and a low of 1.16844. After posting gains for two consistent days, the EUR/USD pair dropped on Wednesday amid the broad-based U.S. dollar strength. Another major reason behind the fall in EUR/USD prices on Wednesday was the latest comments from ECB President Lagarde of talking up an idea of moving toward the average inflation targeting measure like the U.S. Fed to fight against pandemic recession. 

Lagarde said on Wednesday that ECB was considering following the footsteps of the U.S. Federal Reserve to ditch its current policy that sets the target of inflation below but close to 2%. The debate over whether ECB should follow the Fed in setting an average inflation target and let inflation run above 2% target came in as analysts suggested that the central bank was running out of tools. Another reason could be a low appetite for cutting interest rates below zero. These dovish hopes kept the market risk sentiment under pressure, and the Euro currency suffered that led to declining EUR/USD pair prices on Wednesday. 

Meanwhile, at the data front, the German Import Prices in August rose to 0.1% from the projected 0.0% and supported Euro. At 10:59 GMT, the German Retail Sales for August also rose to 3.1% from the anticipated 0.4% and supported Euro. 

The French Consumer Spending for August rose to 2.3% from the anticipated -0.2% and supported shared currency. The French Prelim Consumer Price Index (CPI) for September declined to -0.5% against the projected -0.3% and weighed on Euro. 

At 12:55 GMT, the German Unemployment Change in August came in as -8K against the forecasted -7K. At 14:00GMT, the Italian Prelim CPI for September declined to -0.6% against the forecasted -0.5% and weighed on single currency Euro. 

On the U.S. front, at 17:15 GMT, the ADP Non-Farm Employment Change showed a job creation of 749K against the forecasted 650K in September and supported the U.S. dollar. At 17:20 GMT, the Chicago Purchasing Managers Index (PMI) advanced to 62.4 from the forecasted 52.0 and supported the greenback. At 17:30 GMT, the Final GDP for the quarter came in as -31.4% against the projected -31.7% and supported the U.S. dollar. At 19:00 GMT, the Pending Home Sales also rose to 8.8% from the projected 3.1% and supported the U.S. dollar.

Despite the strong economic data from Europe, the pair EUR/USD continued declining on Wednesday as the focus has been shifted towards the U.S. dollar and its strength. The strong greenback managed to keep the pair under heavy pressure on Wednesday amid several factors supporting U.S. dollar gains. Furthermore, the U.S. dollar also gained its strength as the hopes for a new round of U.S. stimulus measures finally increased. Steven Mnuchin, the U.S. Treasury Secretary, said that the talks between Democrats and Republicans over the next round of the coronavirus aid package have resumed. This raised optimism in the market that both parties will reach a consensus soon given Tuesday’s statement of Lagarde in which she reiterated that she had high hopes that both parties will reach a deal by the end of this week. The broad-based greenback’s strength kept weighing on the EUR/USD pair on Wednesday.

Daily Technical Levels

Support Resistance

1.1686       1.1772

1.1630       1.1802

1.1600       1.1858

Pivot Point: 1.1716

EUR/USD– Trading Tip

The bullish bias of the EUR/USD continues to play in the market as the pair is trading at 1.1740 level. On the higher side, the EUR/USD pair may find resistance at 1.1750 level along with a support level of 1.1716 level. A bearish breakout of the 1.1715 level can extend selling bias until the 1.1694 level today. Overall, the price action of the EUR/USD pair will be highly influenced by the series of manufacturing PMI figures not only from the Eurozone but also from the U.S. economy. Bullish bias will be dominant upon the breakout of 1.1750.


GBP/USD – Daily Analysis

The GBP/USD closed at 1.29232 after placing a high of 1.29424 and a low of 1.28051. Overall the movement of the GBP/USD pair remained bullish throughout the day. The GBP/USD pair continued its bullish streak for the 6th consecutive days on Wednesday despite the broad-based U.S. dollar weakness. The upward momentum of GBP/USD could be attributed to the renewed Brexit hopes and positive comments from Haldane. 

On Wednesday, the U.S. Dollar Index remained flat at 93.92 despite the strong macroeconomic releases on the day. At 17:15 GMT, the ADP Non-Farm Employment Change from the United States rose to 749K against the expectations of 650K and supported the U.S. dollar. At 17:20 GMT, the Chicago PMI also rose to 62.4 from the expected 52.0. At 17:30 GMT, the Final GDP for the quarter showed a contraction of -31.4% in the second quarter against the projected contraction of -31.7%. At 19:00 GMT, the Pending Home Sales for August rose to 8.8% against the forecasted 3.1%. All these positive data from the U.S., but still GBP/USD pair managed to post gains on the back of high Brexit hopes. 

On Wednesday, the Cable moved higher as the latest headlines out of Brexit negotiations were positive. The E.U.’s chief negotiator Michel Barnier praised the improved atmosphere around the post-Brexit deal on Wednesday. The member states ordered France to back down from its demands to secure status quo access to Britain’s fishing grounds. Barnier said that a breakthrough could be made during this week’s round of negotiation as both sides had been able to engage more closely on fishing and state aid issues.

Apart from Brexit renewed hopes, the comments from Bank of England’s chief economist Andy Haldane also provided support to the rising GBP/USD pair. Haldane said that Britain’s economy was being held back by the overly pessimistic views about the coronavirus crisis. He provided some relief when he said that none of the conditions that would lead to negative interest rates had been met. 

It means his comments ruled out the option of negative interest rates in the current period when the country is facing a healthy and robust wave of coronavirus pandemic. These positive comments from Haldane supported British Pound that pushed the GBP/USD pair on the upside for the 6th consecutive days.

From the U.K., the BRC Shop Price Index for the year dropped to -1.6% against the forecasted -1.4% and weighed on Sterling. At 10:59 GMT, the Nationwide HPI for September rose to 0.9% against the forecasted 0.5% and supported the Sterling that added gains in GBP/USD pair. At 11:00 GMT, the Current Account Balance from the U.K. showed a deficit of 2.8B against the forecasted deficit of 1.0B and weighed on British Pound. The Final GDP for the quarter showed a contraction of -19.8% against the forecasted contraction of -20.4% and supported the local currency GBP that ultimately provided added support to GBP/USD pair’s gains on Wednesday. At 11:02 GMT, the Revised Business Investment for the quarter came in as -26.5% against the forecasted -31.4% and supported the upward momentum of the GBP/USD pair.

Daily Technical Levels

Support Resistance

1.2821       1.2902

1.2781       1.2943

1.2740       1.2983

Pivot point: 1.2862

GBP/USD– Trading Tip

The GBP/USD is consolidating with a bullish bias at 1.2875 level, having violated the sideways trading range of 1.2770 to 1.2725 level. Most of the buying trend was triggered amid stronger Sterling and weakness in the U.S. dollar. The Cable has formed an upward channel on the hourly chart that may support the pair at 1.2827 level along with a resistance level of 1.2909 level. Bullish crossover of 1.2900 level can open up further buying room until 1.2998 level today. Let’s consider taking buying trades over 1.2827 level today. 


USD/JPY – Daily Analysis

The USD/JPY pair was closed at 105.436 after placing a high of 105.802 and a low of 105.400. The USD/JPY pair broke its 7-days bullish streak on Wednesday and declined on Wednesday to its lowest level at 105.400. The USD/JPY pair managed to post losses on Wednesday despite the strong macroeconomic data releases from the U.S. 

On the data front, at 04:50 GMT, the Prelim Industrial Production from the United States in August rose to 1.7% from the forecasted 1.5% and supported the Japanese yen that ultimately weighed on the USD/JPY currency pair. The Retail Sales from Japan came in as -1.9% against the forecasted -3.2% and supported the Japanese Yen that exerted weighed on the USD/JPY pair. The Housing Starts for the year came in as -9.1% against the forecasted -10.0% and supported the Japanese Yen. The strong macroeconomic data from Japan pushed the Japanese Yen higher against the U.S. dollar and weighed on the USD/JPY pair.

On Wednesday, the U.S. Dollar Index (DXY) remained flat at 93.92 level but posted monthly gains in September by 2% and losses for the 3rd quarter by 3.5%. The steady U.S. dollar was due to the un-decisive presidential debate. Both candidates Donald Trump and Joe Biden took part in the first of third presidential debate on Tuesday and discussed issues like the coronavirus pandemic, Trump’s leadership, and the U.S. economy along with taxes. However, the debate failed to provide clues about the results of upcoming elections and weighed on the U.S. dollar that dragged the USD/JPY pair’s prices.

Moreover, the renewed hopes about the Stimulus package came under headlines after Steven Mnuchin said that the White House would hold talks with Democrats over the stimulus issue. Meanwhile, the Governor of Federal Reserve, Michelle Bowman, said that economic recovery from the pandemic crisis was bumpy because of the high rate of unemployment and persisting need for support from fiscal and monetary departments of the U.S.   

The President of Federal Reserve Bank of Minneapolis, Neel Kashkari, also called the U.S. economic recovery as grinding and told the lawmakers that it would remain the same unless a dramatic change or sooner than expected breakthrough in vaccine development. He said that to smooth the economic recovery of the world’s largest economy, a dramatic policy change was needed. The above comments from Fed officials also had a role in the downward movement of the USD/JPY pair on Wednesday.

Daily Technical Levels

Support Resistance

105.41      105.82

105.17      105.99

105.00      106.23

Pivot point: 105.58


USD/JPY – Trading Tips

The technical side of the safe-haven pair USD/JPY continues to be steady as it’s consolidating with a bullish bias to trade at 105.460 level, and the series for EMA is now extending at 105.750 level. On the lower side, the support holds at 105.300 level. The MACD also supports the bullish bias amid a stronger U.S. dollar and diminished safe-haven appeal. A bullish crossover of the 105.750 is likely to lead the USD/JPY price towards the next resistance level of 106.250. As we can see, the 50 periods EMA is also in support of buying; therefore, we should look for buying trades in the USD/JPY pair. However, bearish trend continuation and violation of the 105.300 level can open further room for selling until 104.900. Good luck! 


Categories
Forex Market Analysis

Daily F.X. Analysis, January 27 – Top Trade Setups In Forex – Safe Haven Appeal Soars! 

The Friday major U.S. stock indexes closed in negative territory as the coronavirus outbreak in China intensified. The Dow Jones Industrial Average dropped 170 points (-0.6%) to 28989, the S&P 500 fell 30 points (-0.9%) to 3295, and the Nasdaq Composite was down 87 points (-0.9%) to 9314.

In Asian trading hours, EUR/USD edged up to 1.1030, while GBP/USD fell to 1.3058. The coronavirus outbreak continues to dent market sentiment, with Canada and Australia confirming their first cases of the virus over the weekend.

Economic Events to Watch Today


EUR/USD – Daily Analysis

The EUR/USD currency pair continued its longest weekly losing trend since November 2018 ahead of German IFO data. As of writing, the EUR/USD currency pair is currently trading at 1.1029 and consolidating in the range between the 1.1021 – 1.1037.

As we know, the currency pair represented 0.26% losses last week as the EUR currency faced selling pressure on the same day. That was mainly due to the European Central bank was seen more dovish after President Lagarde said that the risks to the economy have turned to the downside.

After that, the German PMI figures were released better-than-expected but failed to give some bids to the EUR currency. However, the EUR/USD currency pair has been moving in a bearish trend since the last week of January. At the data front, expectations are on the peak that the German IFO reading for January will hit the highest level since June 2019. 

Whereas the headline German business climate index was expected to rise to 97.2 (mkt 97.0), its highest level since June, but it came as 95.9 and weighed on Euro currency.

The shared currency continued its downward movement after the release of weaker than expected German Ifo Business Climate, which indicated a slowdown in the German economy. The short-run technical bias is expected to remain bearish until or unless the prices trade below the ascending trend line. 

Daily Support and Resistance    

  • S3 1.095
  • S2 1.0993
  • S1 1.1009

Pivot Point 1.1035

  • R1 1.1051
  • R2 1.1078
  • R3 1.112

EUR/USD– Trading Tips

The EUR/USD is trading at 1.1026 area, having formed a Doji candle above 1.1015 support level, particularly on the 4-hour timeframe. The bullish Doji pattern is suggesting the probabilities of a bullish and bearish trend both in the EUR/USD. The German Ifo Business Climate reported worse than expected figures falling below economists’ expectations of 96.3. 

The EUR/USD can show bullish correction until 1.1060 and 1.1075. On the lower side, a breakout of the support level of 1.1015 can lead EUR/USD prices towards the 1.0945 area. 


GBP/USD– Daily Analysis

The GBP/USD currency pair flashed red and continued its 3-day losing rally mainly due to China’s coronavirus outbreak & hard Brexit fears. As of writing, the GBP/USD currency pair is currently trading at 1.3062 and is consolidating in the range between the 1.3052 – 1.3079. 

At the Brexit front, the representative of the European Union and the United Kingdom are trying to expand the indirect fears regarding hard Brexit. The Brexit Secretary Stephen Barclay said that they would publish their objectives for the negotiations in due course after leaving E.U. on January 31. He also said that the U.K. would have control over its rules, and it would not diverge for the sake of diverging but would start from a position of alignment. 

On the other hand, British Home Secretary Priti Patel repeated this morning that Britain would diverge from Brussels after leaving E.U. despite warnings from European Union that they could rule out a free trade deal.

On the other hand, the European Union has already given a warning to the UK PM Boris Johnson that he will fail if he tries to use the support of a U.S. trade deal to strike better terms with Brussels.

At the China front, fears of China’s coronavirus explosion have threatened the global risk sentiment by crossing national boundaries and possibly affected more than 30,400 people within a few days.

As a result, the U.S. ten-year treasury yields fell to multi-week low while surrounding 1.63%, whereas most of the Asia-Pacific stocks also representing the risk-off sentiment in the wake of holidays in China and Australia.

Looking forward, traders will closely watch the 2nd-tier U.S. data on the economic calendar before Thursday’s monetary policy meeting by the Bank of England (BOE), which will show a final chance for rate change in the wake of mixed data. After that, the EU-UK will formally be departed at 21:00 GMT on January 31, 2020.

Daily Support and Resistance

  • S3 1.2865
  • S2 1.2984
  • S1 1.3028

Pivot Point 1.3102

  • R1 1.3146
  • R2 1.322
  • R3 1.3338

GBP/USD– Trading Tip

The GBP/USD has violated the symmetric triangle pattern, which is now keeping the pair support around the 1.3065 area. Closing of Doji candle above this level is likely to keep the GBP/USD bullish until 1.3170. 

Above 1.3170, the GBP/USD may go after the next resistance level of 1.3160. Whereas, a bearish breakout of 1.3065 can lead the GBP/USD prices towards 1.2975. The RSI and MACD support mixed bias. Let’s look for selling trades below 1.3102 and bullish trades above 1.3044. 


USD/JPY – Daily Analysis

The USD/JPY currency pair was found on the bearish track and dropped heavily on the day because the Japanese yen picked up a bid in the wake of bad news regarding the China coronavirus fears threatened the market risk sentiment. As of writing, the USD/JPY currency pair is currently trading at 109.05 and is consolidating in the range between the 108.73 and 109.11.

At the China front, fears of China’s coronavirus have threatened the global risk sentiment by crossing national boundaries and possibly affecting more than 30,400 people within a few days.

On the other hand, the Federal Reserve meeting is scheduled to happen during this week, and traders are keeping their eyes on the Federal Reserve rate decision. The agreement surrounding the Federal Reserve is of a neutral stance with much of the hard work done last year, and traders are expecting stability in the monetary policy for now.

As a result, the U.S. ten-year treasury yields fell to a multi-week low while surrounding near 1.63%. In contrast, most of the Asia-Pacific stocks are also representing the risk-off sentiment in the market on the back of holidays in China and Australia.

A report came in that Singapore has reported four cases of the coronavirus that has killed 80 people in China so far, and the numbers look to be increasing with the time. As in result, most currencies are under pressure due to risk-off market sentiment; on the other hand, the safe-haven currencies like Japanese yen are looking bullish.


Daily Support and Resistance    

  • S3 108.4
  • S2 108.89
  • S1 109.08

Pivot Point 109.37

  • R1 109.56
  • R2 109.85
  • R3 110.33

USD/JPY – Trading Tips

The USD/JPY pair has violated long-held horizontal support level has already been violated at 109.250 level, and now, the USD/JPY is holding below this level. At the same level, the USD/JPY is also getting supported by the bullish channel, which can be seen in the chart above. 

Technically, the USD/JPY may find resistance around 109.250, which is the same level that provided support to the USD/JPY earlier. We can see selling below this level until 108.520. Moreover, the RSI and MACD have crossed over in the selling zone and are supporting the selling bias. 

All the best for today! 

Categories
Forex Market Analysis

Gold Trade Sideways – Volatility Lacks Amid Thanksgiving!

On Thursday, the precious metal gold traded in a tight $5 range trading range as investors assessed the impact of U.S. support of Hong Kong rebels on its trade agreements with China.

Demand for safe-haven assets like gold, silver, and Japanese yen increased as the U.S. President Trump signed the Hong Kong Human Rights and Democracy Act in early Asia, reaffirming support for Hong Kong’s pro-democracy protests after the majority of the City’s districts turned in favor of pro-democracy candidates with record voter turnout this week.

While China has frequently warned the U.S. administration not to interference in their personal affairs, therefore, President Trump’s move will likely hurt the relationship with China at a time when both sides are trying to reach a “phase one” trade deal.

On the positive side, the United States and China trade deal nearness and the optimism surrounding the United Kingdom December election result supported the market’s riskier assets and moved the greenback.

Besides, the greenback strength was robust U.S. data that decreased market speculations that the excellent time for the world’s largest economy will soon be over.

The traders will have a few data to watch due to the United States holiday regarding thanksgiving data; it means that the trade and political headlines will keep the market active.


Daily Support and Resistance

  • S3 0.6746
  • S2 0.6762
  • S1 0.6769

Pivot Point 0.6779

  • R1 0.6786
  • R2 0.6796
  • R3 0.6813

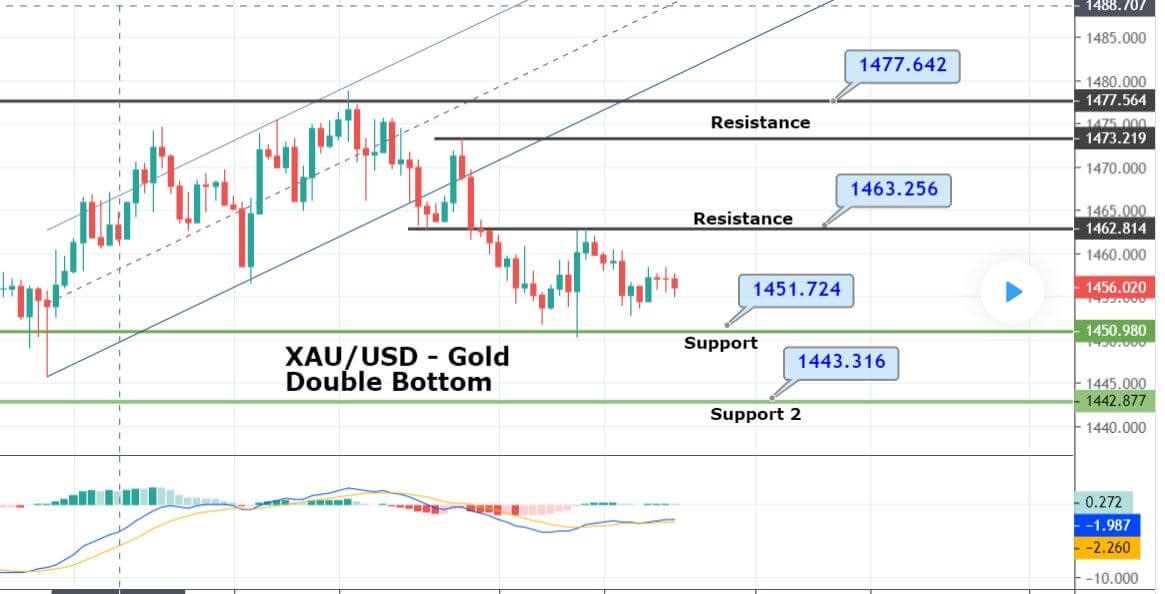
Choppy dealing in gold remains as the yellow metal still maintains the full range of 1,464 – 1,452. Due to thanksgiving holiday today, we may not see much moves in the market. We can try to cap above 1,452 as below this gold can find next support nearby 1,447. The overall trend is likely to be mixed today.

Categories
Forex Market Analysis

Daily F.X. Analysis, November 28 – Top Trade Setups In Forex – Happy Thanksgiving! 

The U.S. dollar kept trading within a tight range on Wednesday, amid thin trading before the Thanksgiving holiday. The ICE Dollar Index closed broadly flat on the day at 98.31.

The British pound rose 0.5% to $1.2930. A U.K. election poll showed that the Conservative would retain a majority of seats in the parliament. The euro fell 0.1% to $1.1005, while USD/JPY gained 0.3% to 109.38. 

The Federal Reserve released the Beige Book, which stated that economic activity expanded modestly, the outlook remains positive, and growth is expected to continue into next year. Besides, theU.S. economic data, third-quarter GDP growth was revised to 2.1% (1.9% expected and previously estimated), and durable goods orders increased 0.6% on month in October (-0.9% estimated).

Economic Events to Watch Today

Let’s took at these fundamentals.


EUR/USD – Daily Analysis

The EUR/USD currency pair consolidates on the uncertain track and may face a hard time defending crucial support until the German inflation data blows past predictions, weakening dovish ECB expectations. Today, the German inflation data is scheduled to release at 13:00 GMT.

As of writing, the EUR/USD currency pair seems set for a possible break below 1.0994, which is the 61.8% Fibonacci retracement of the rally from 1.0879 to 1.1179.

At the USD front, the greenback got the support mainly due to the 3rd-quarter gross domestic product was updated higher to 2.1% from 1.9%, in the wake of positive consumer spending data. The Fed’s preferred measure of inflation, which strips out volatile food and energy prices, soared higher to 2.1% from 1.9% in the 2nd-quarter. The inflation gauge exceeded an expectation of 1.7%.

It must be noted that the upbeat data of the U.S. may push the greenback further high on the day. Traders will be likely to sell dollars over increases uncertainty as President Trump’s decision to sign the Hong Kong Democratic Bill has irritated the Dragon Nation, and fears have increased regarding side effects on the trade deal. This is evident from the 0.25% drop in the S&P 500 futures seen at press time.

Looking forward, the breakdown will likely remain elusive manly if the preliminary German consumer price index for November crosses expectations by a considerable range, creating the opportunity for the European Central Bank head Christine Lagarde to maintain her neutral-to-hawkish stance for some time.

On the flip side, the CPI is anticipated to drop 0.6% month-on-month in November, having increased by 0.1% in October. The EUR/USD currency pair may plan a notable bounce from $1.10 if the inflation figure crosses estimates by a significant margin.


Daily Support and Resistance

  • S3 1.0958
  • S2 1.098
  • S1 1.099

Pivot Point 1.1002

  • R1 1.1012
  • R2 1.1024
  • R3 1.1046

EUR/USD– Trading Tips

On the technical side, the EUR currency charted a bearish engulfing candle yesterday, strengthening the downside bias put forward by the lower high at 1.1097 established on November 21. On the technical side, indicating the route of least resistance is to the bearish. The 14-day relative strength index is suggesting selling conditions with as the RSI value holds below 50, and the daily MACD histogram is again printing deeper bars below the zero line, a sign of strengthening bearish momentum. Let’s look for staying bullish above or bearish below 1.1000 level today to target 1.1055 on the upper side and 1.0985 on the lower side. 

GBP/USD– Daily Analysis

The GBP/USD currency pair flashing green and hit the 4-day high to 1.2920, mainly due to the ruling Tory party, which will keep the helm of the United Kingdom with a vast majority. The YouGov Poll on the MRP model is highly appreciated for its forecasts regarding the United Kingdom’s result since they forecasted a suspended parliament in 2017. 

The poll suggests Conservatives gain 359 seats against the opposition Labour Party’s 211 seat estimate. Apart from this, It also shows that 43% of vote share will be allocated to the ruling Tories against Jeremy Corbyn-led Labour Party’s 32% expected share, which in turn indicates an 11-point lead of the Prime Minister (PM) Boris Johnson led Conservatives over the Labour Party.

On the other hand, the GBP/USD currency pair is found under pressure during the Asian session today. The GBP currency has initially fallen mainly due to expectations that the Tory announcement might leave a negative impact on the ruling party popularity ahead of the December Snap election. But now the GBP/USD is likely to find enough support below at the 1.2900 regions to bounce yet again. 

A report came from the Guardian’s journalist Owen Jones that the British Prime Minister Boris Johnson’s Conservatives have a significant majority over the Labour Party in the YouGov’s MRP poll.

Looking forward, the traders will just have limited data to trade as the United States enjoys thanksgiving holiday. Therefore, trade and political headlines will keep the market active.


Daily Support and Resistance


  • S3 1.2698
  • S2 1.2794
  • S1 1.2857

Pivot Point 1.2891

  • R1 1.2954
  • R2 1.2987
  • R3 1.3083

GBP/USD– Trading Tips

On Thursday, the GBP/USD has hit our previously suggested target level of 1.2880; in fact, it soared further to trade around 1.2940 level. Currently, the pair has entered the overbought zone, as we can see on the 2-hour timeframe, the RSI and MACD are holding near 70 suggesting chances of a bearish correction.

Therefore, we may see a slightly bearish trend in the GBP/USD below 1.29400 area until a 38.2% Fibonacci retracement level of 1.2900. Consider staying bullish above 1.2900 today to target 1.2945/65. 

 USD/JPY – Daily Analysis

The USD/JPY currency pair flashing red and dropped by 0.13% to 109.38, mainly due to fears regarding United States President Donald Trump’s decision to sign the Hong Kong bill. It may irritate China and could drop a negative impact on the trade talks. 

As a result, the safe-haven currency Japanese Yen has picked up buying. The USD/JPY pair is currently trading at 109.38, representing a 0.13% drop on the day. The pair has dropped more than 20 pips in the last 90 minutes or so. 

The U.S. President Trump signed the Hong Kong Human Rights and Democracy Act in early Asia, reaffirming support for Hong Kong’s pro-democracy protests after the majority of the City’s districts turned in favor of pro-democracy candidates with record voter turnout this week.

It must be noted that China has repeatedly warned the U.S. administration not to interfere in their internal affairs. Therefore, President Trump’s move will likely hurt the relationship with China at a time when both sides are trying to reach a “phase one” trade deal.

Looking forward, deeper declines could be in the offing if the Asian and European equities turn risk-averse concerning the latest political developments. 

At the USD front, the greenback found on the buying track during the United States trading hours on Wednesday, mainly due to official data, which showed the U.S. gross domestic product (GDP) increased 2.1% in the 3rd-quarter, driven by strong consumer spending. Notably, the pair hit a 6-month high of 109.61 before dropping on Trump’s decision to sign Hong Kong Democracy bill. 

Daily Support and Resistance


  • S3 108.42
  • S2 108.92
  • S1 109.24

Pivot Point 109.42

  • R1 109.74
  • R2 109.93
  • R3 110.43

USD/JPY – Trading Tips

The USD/JPY is trading at 109.425, and it has just entered the overbought zone as the RSI and MACD are stuck in the overbought territory. On the 4 hour chart, the USD/JPY has formed a tweezers top, which typically suggests chances of a bearish bias trend in the USD/JPY. 

On the downside, the USD/JPY may drop towards 38.2% Fibonacci retracement until 109.150. Besides Fibonacci, the bullish channel is also supporting the USD/JPY at the same level. So consider taking a sell trade below 109.500 today to target 109.200. 

All the best!