Categories
Forex Service Review

FXCharger Trading Robot Review

FXCharger is an Expert Advisor (EA) for the MetaTrader 4 platform. It is on the scene since 2016 and is updated in 2019 to look more professionally. According to external sources, the company behind FXCharger also has other domains and products such as FXMower.com, ForexBringer.com, ForexSeven.com, and so on. Some of these brands are out of business. FXChrger has performance charts uploaded on myfxbook.com and some of them are verified. Note that this EA still does not have wide popularity and according to the charts has good performance.

Overview

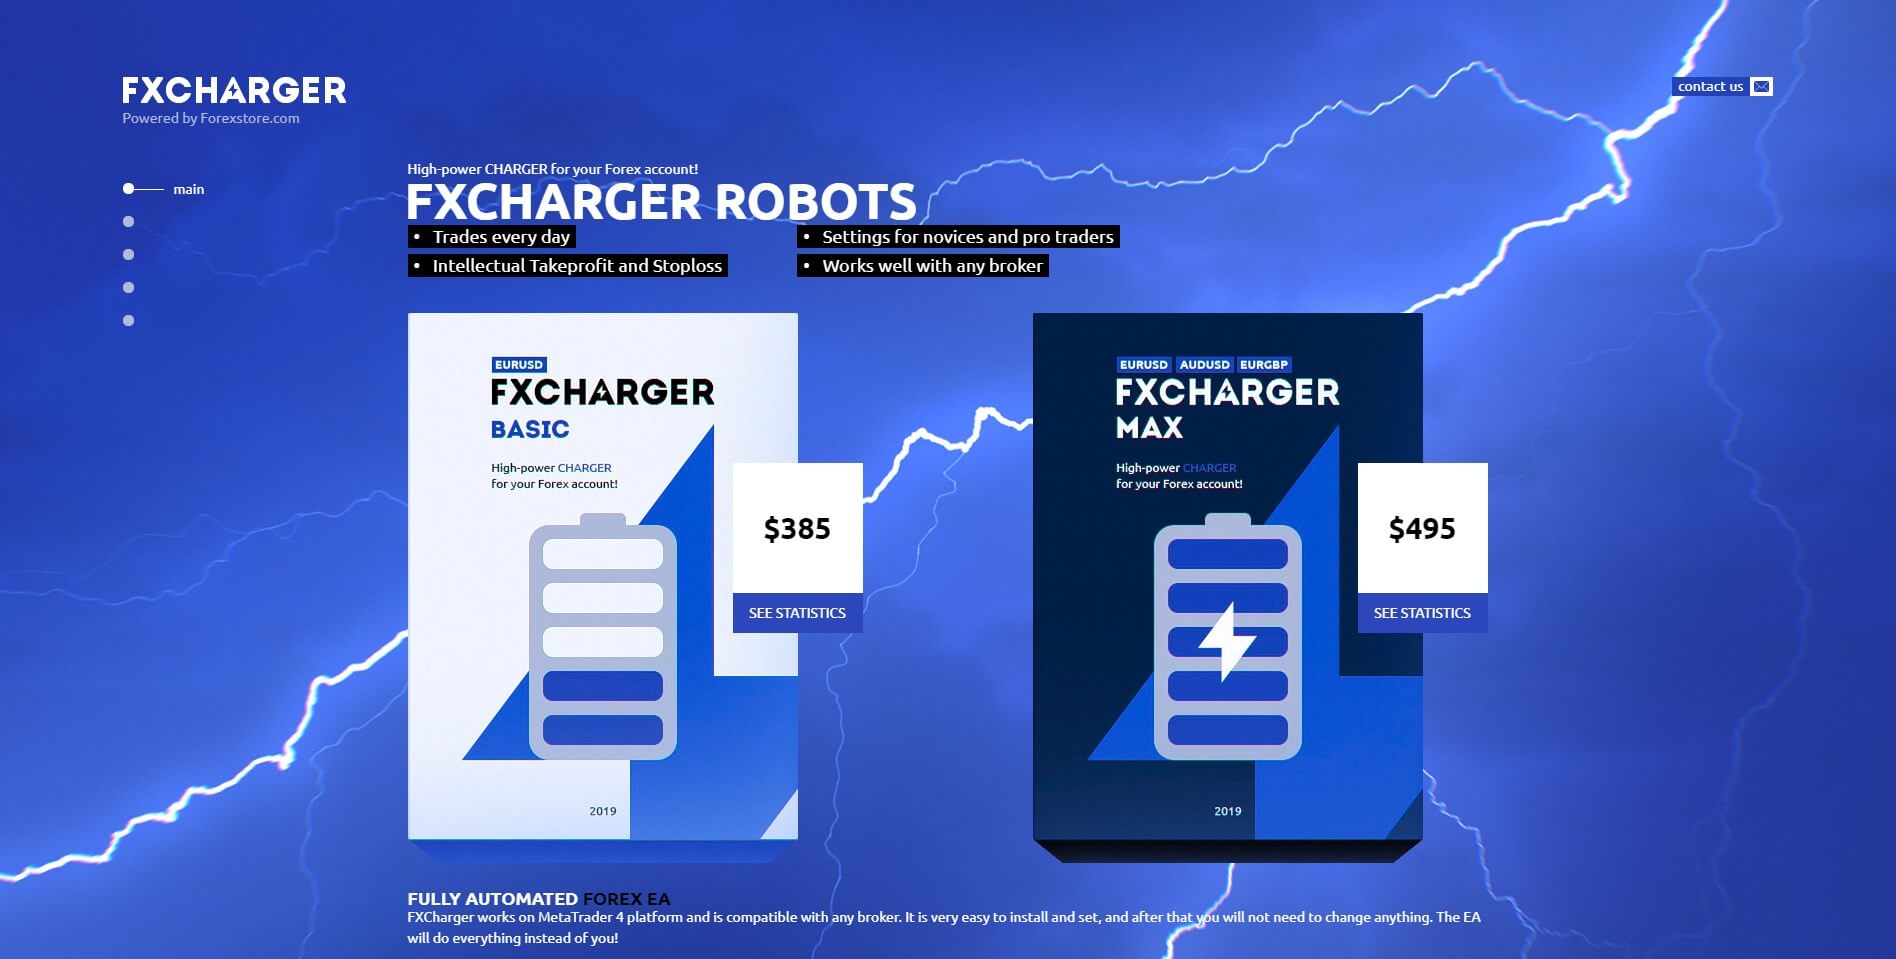
FXCharger is a martingale EA at its base but includes adaptive Stop Loss and Take Profit levels according to market conditions. We believe this is based on volatility but it could be some other indicator values. There are two versions, FXCharger Basic and FXCharger Max. They are essentially the same EAs except the Max version is also applicable for the AUD/USD and EUR/GBP currency pairs, not only for the EUR/USD as the Basic version.

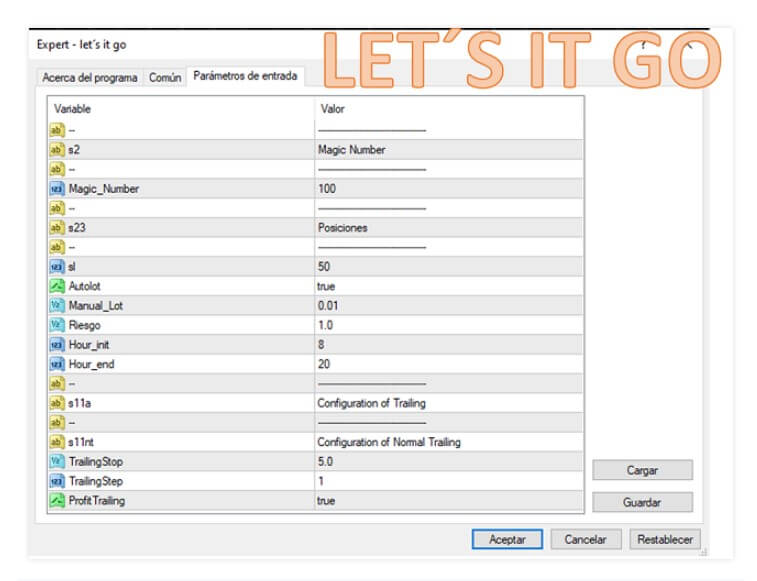
According to the developer, the EA is designed to have frequent trades, trades every day. This means the EA is also for the less patient, young traders that like to see results right away. The EA does not hold positions for long, it should end a trade in 1 to 4 days max. The EA setting allows the user to ser the maximum possible risk amount so every position has its limit to how much drawdown per position EA can tolerate. This function is more or less common with many EAs, although, for promotional reasons, the devs decided to state it as a special feature. Even if the EA is not connected to the market anymore for any reason, the Stop loss should be executed. This means the Stop Loss or Take Profit is set onto the broker server thus it is not invisible and acts like a normal Stop Loss set from the MT4.

Now, this setting could be crucial for martingale EAs. As with other martingales EAs, FXCharger has the same sudden drop patterns in the chart followed by gradual and smooth gains until the next drop and so on. Setting the low-risk tolerance could mean the trades will be closed before they can rebound to positives and Take Profit levels. As such, if this setting is not optimal, or better to say not by developer defaults, the EA performance could be very different.

On the website, there are 3 points where it is described (1) you will trade in profit thanks to smart Take Profit levels, (2) save deposit with smart Stop Loss, and (3) use reliable setting to get a stable profit. We cannot agree that even the best Take Profit leveling can make you profits but we agree that optimal Stop Loss protection can at least save you from complete account busting in a short time. FXCharger settings should not be tickled with is seems, as the devs have a refund policy in 30 days only if the EA is working by default settings.

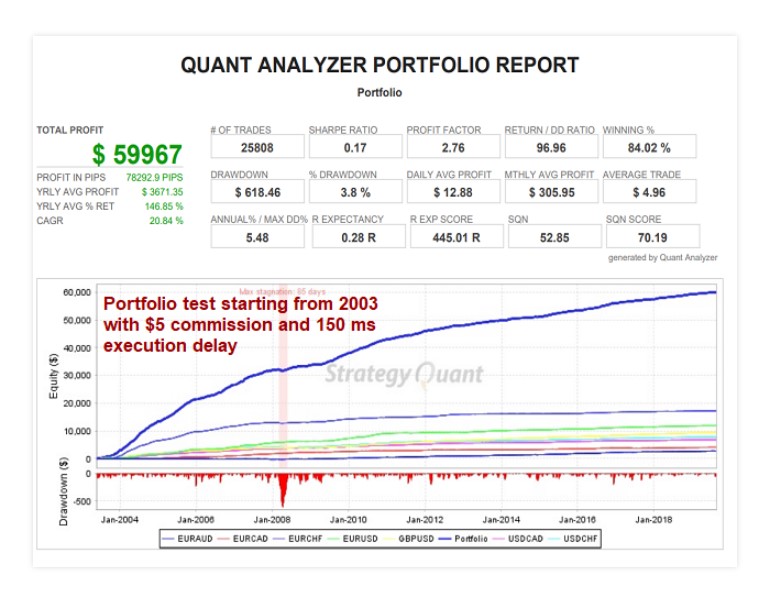
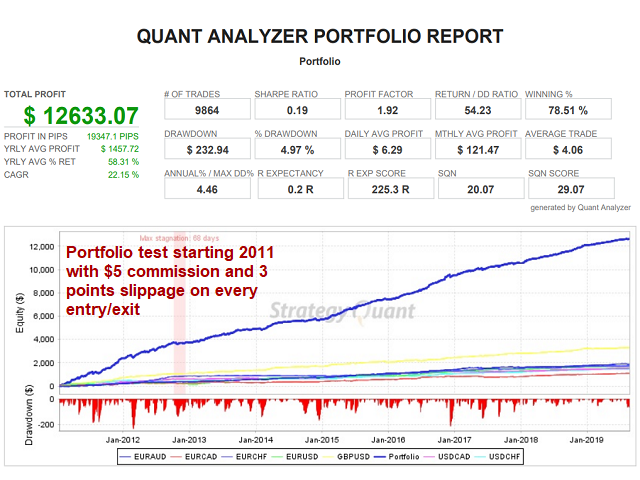
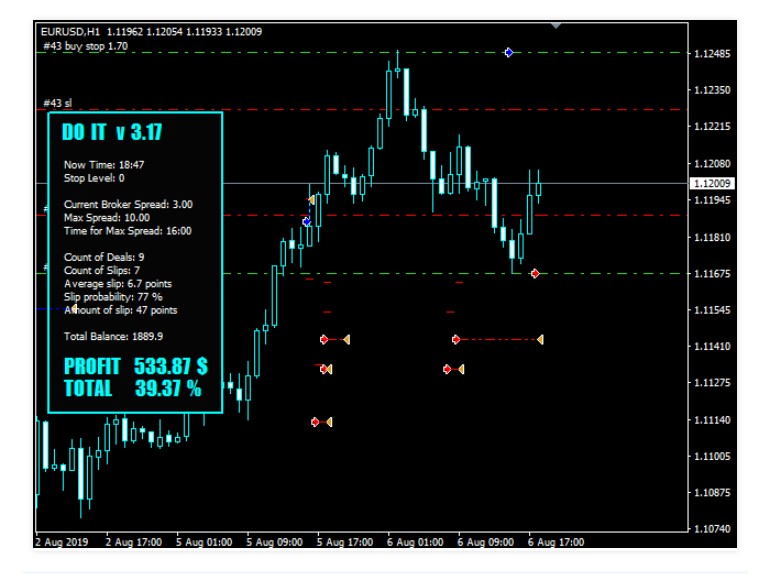
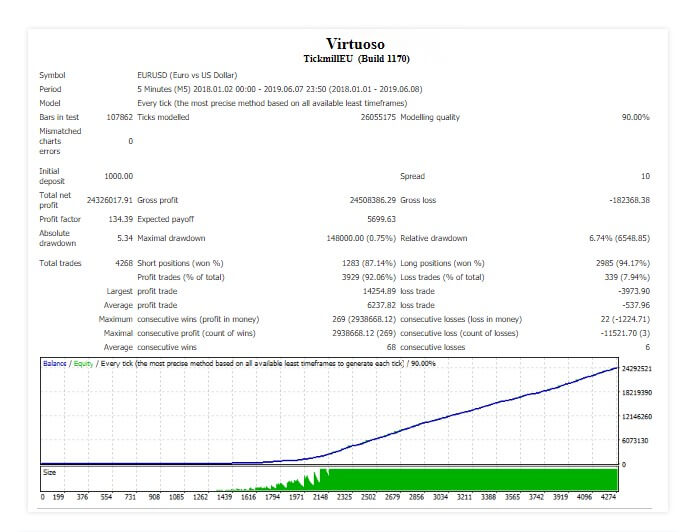
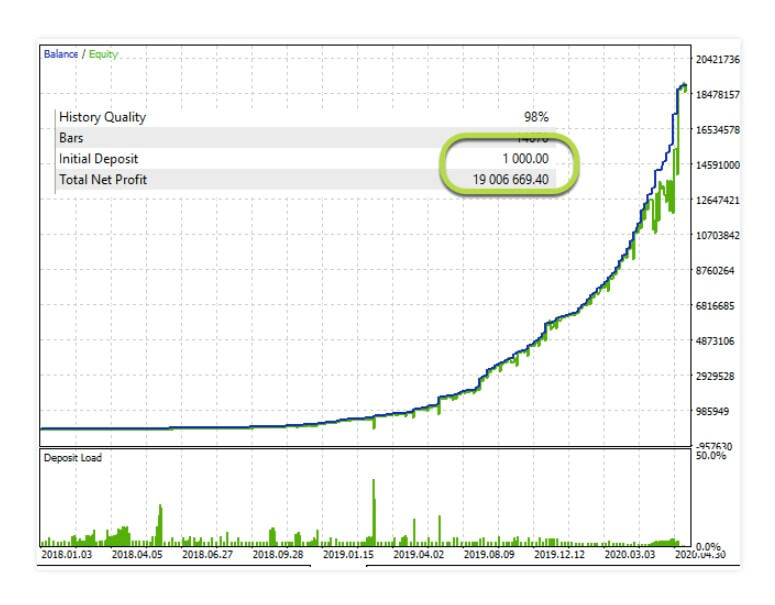
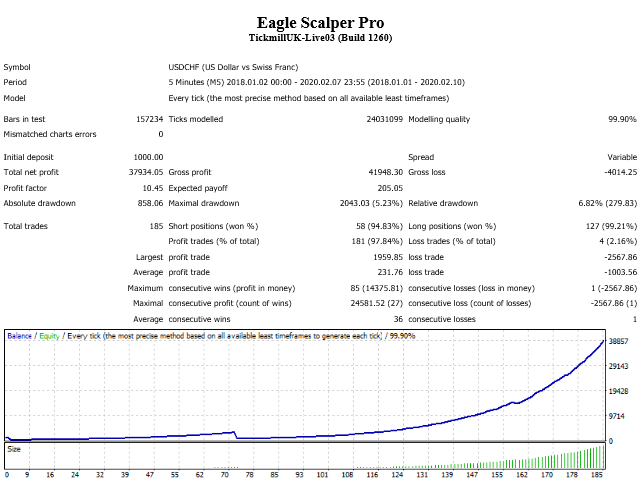
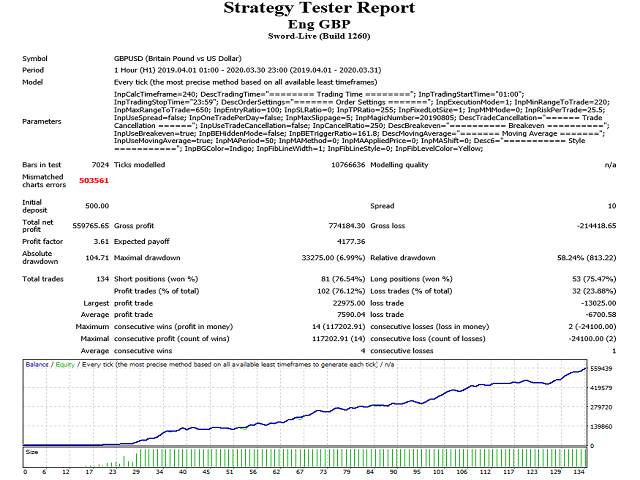
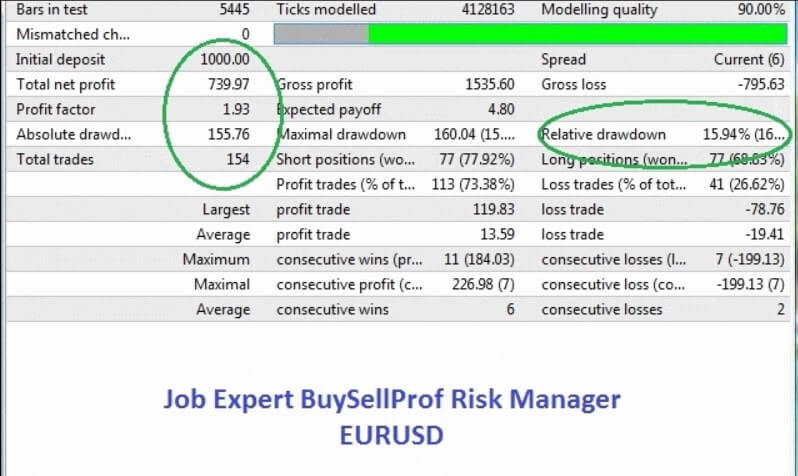
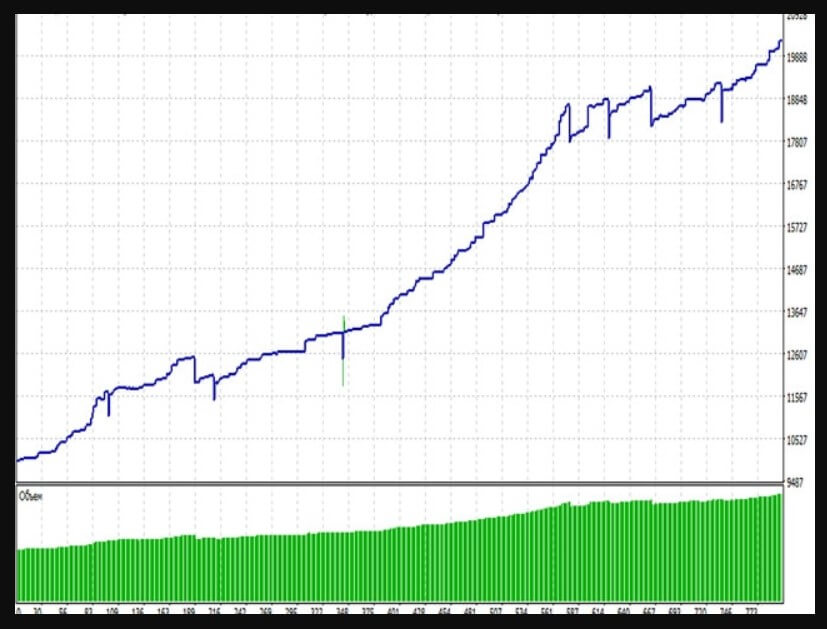
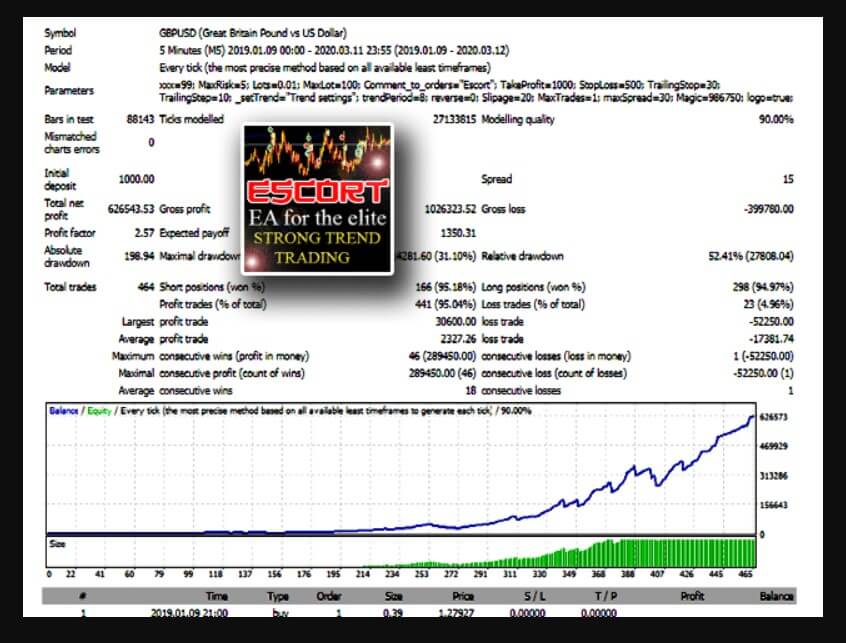
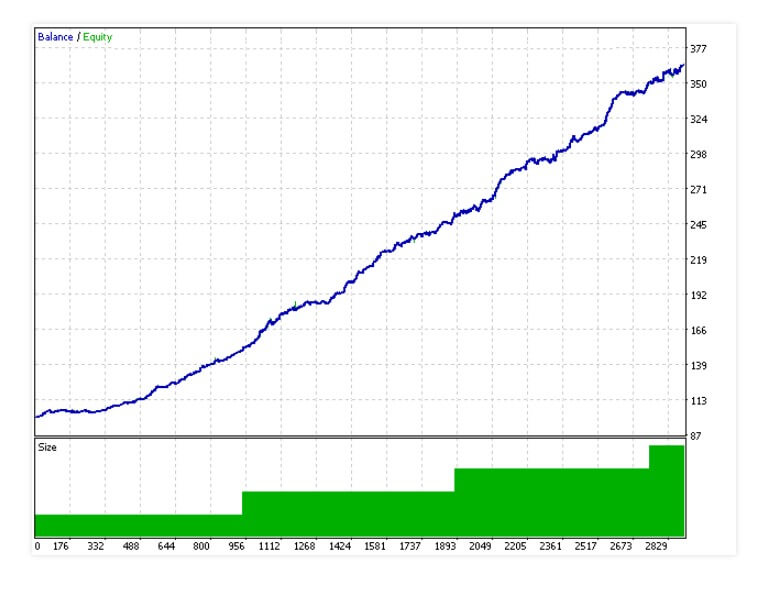
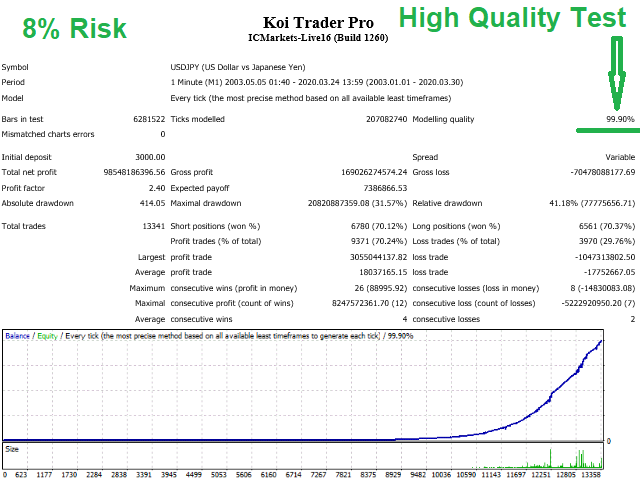
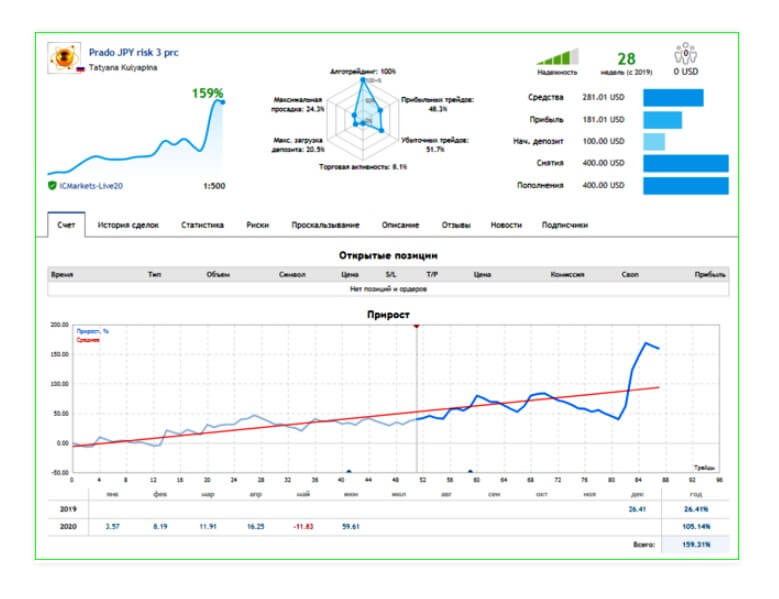
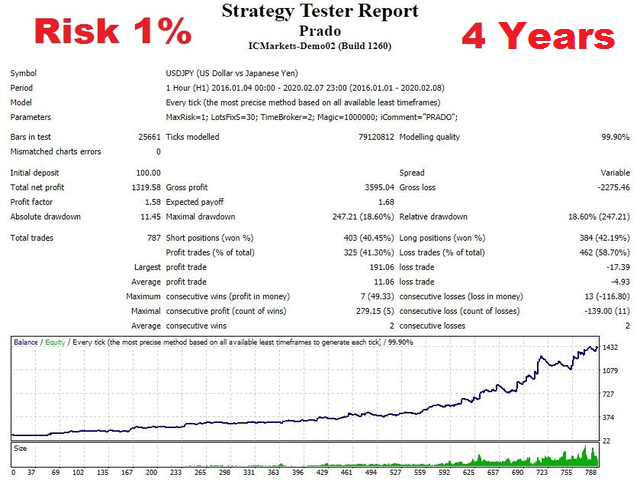
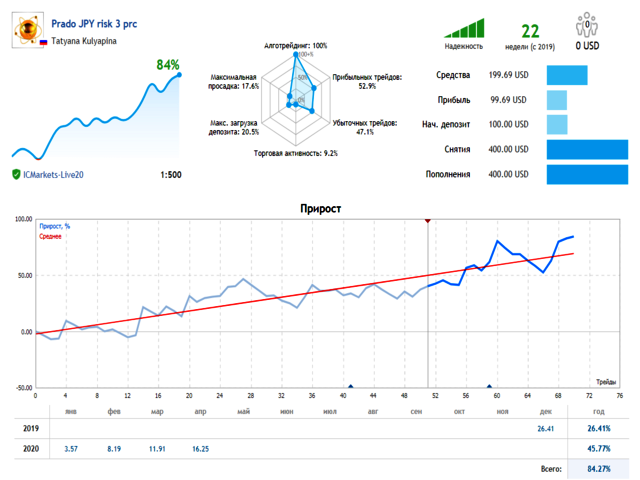
Myfxbook performance charts show high levels or return. The EUR/USD pair shows gains of 1528.63% since Merch 2016. Three dips are evident, showing the Stop Loss in effect and according to our estimates, even after FXCharger made about 1400% gain, in May it dropped to 1100% from one Stop Loss trigger, 4 Stop Loss triggers in that month would almost bring the account to breakeven. Drawdown is increased to 29.46% in 2020 since the EA performed poorly in January and February piling the losses up to -15% per month. FXCharger average trade length is 5 days, a bit longer than advertised, won 60% of trades, winning 55.59 pips on average, and losing -79.86 pips. The Sharpe ratio is very low with this EA, a mere 0.01, meaning the returns do not compensate for the risk taken. The year 2016 and 217 were much better for this EA, none of the months ended negative and in 2018 19 and especially the beginning of 2020 is disappointing. Still, the EA has a total positive gain. The broker used for the testing is FXOpen.

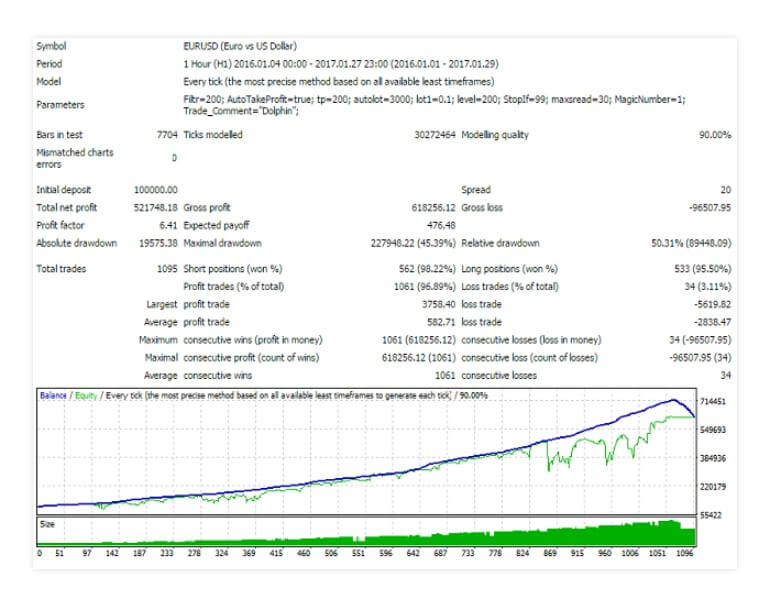
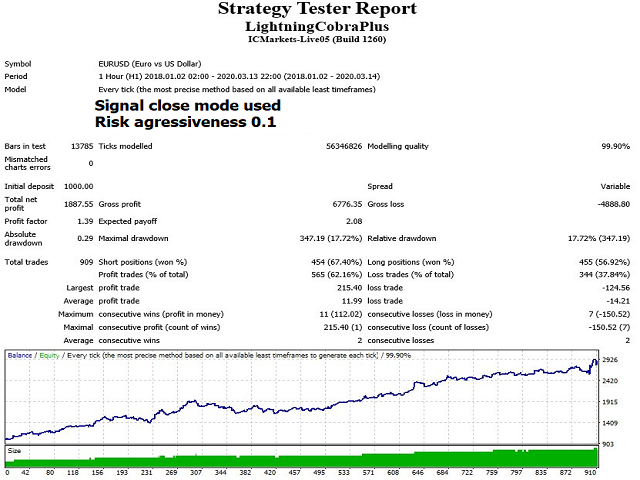
The AUD/USD testing gained 580% since min 2018 and 14% on average per month. In contrary to the EUR/USD, the 2018 and 2019 year are all positive for FXCharger but seems to be off since July 2019. The trade success rate is 60%, the same as with the EUR/USD with a bit better Sharpe ratio of 0.04. The average win per trade is 54.57 pips and the average loss is -62.08 pips. The exposure is set to private. The drawdown presented on the website is an extreme 54.72%. The EUR/GBP pair performance chart and analysis is not published.

Service Cost

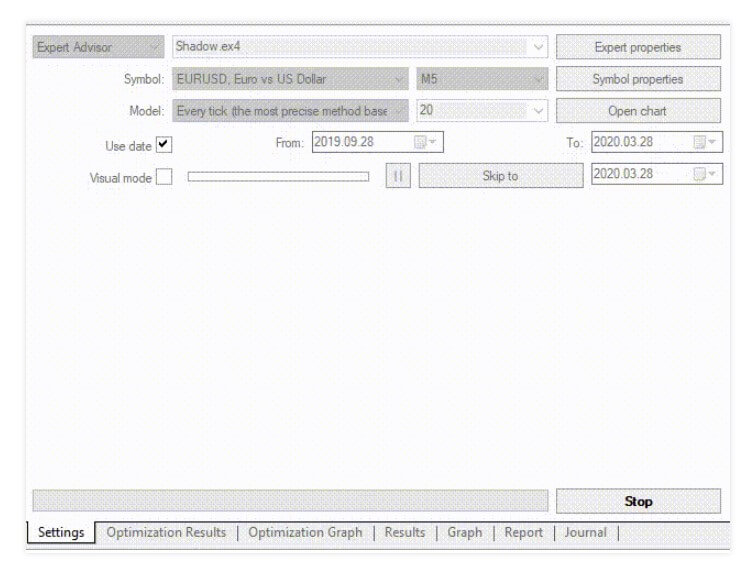
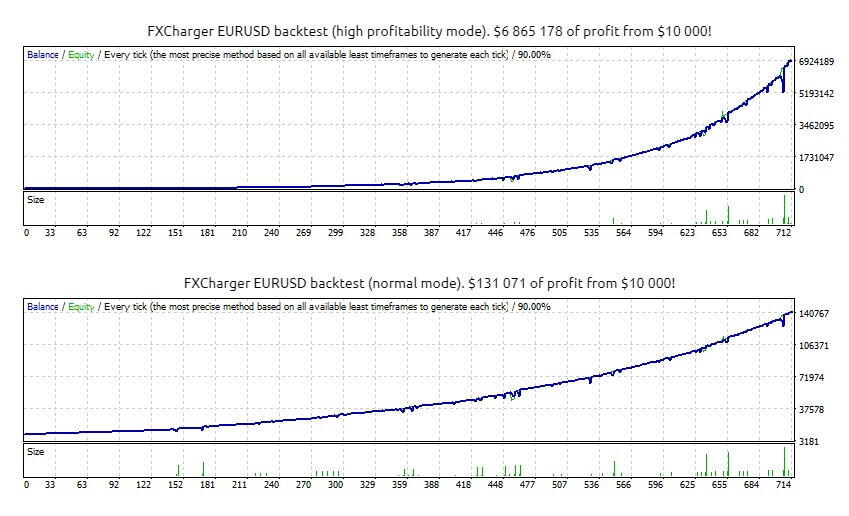
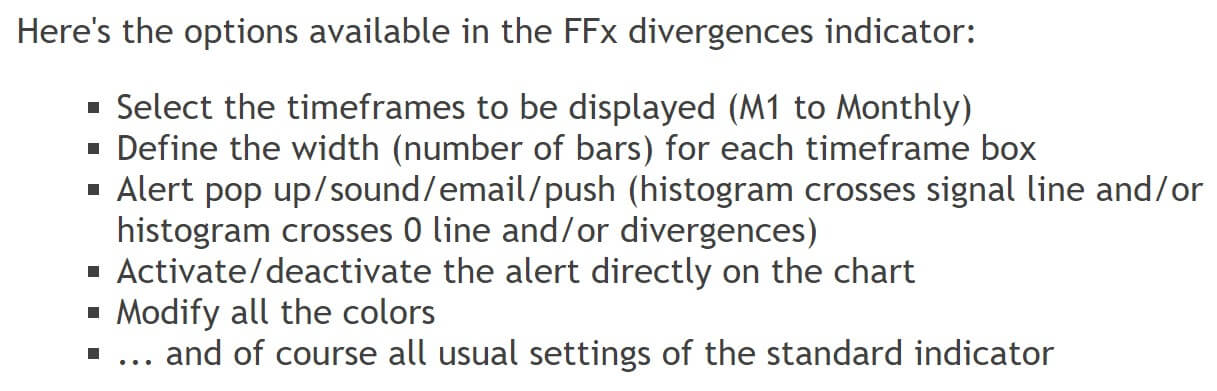
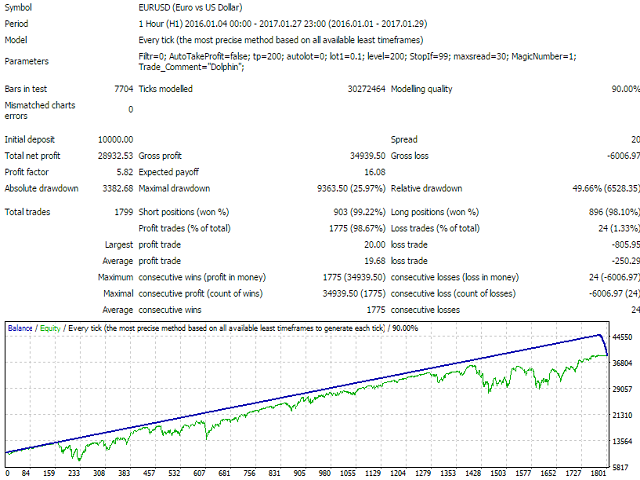
The FXCharger website will not disclose what indicators are used and the major content will be the statistics section. You will see multiple charts for the backtesting results for the EUR/USD, AUD/USD, and the EUR/GBP pair. FXCharger works on the 1-hour timeframe and has the normal and High Profitability modes.

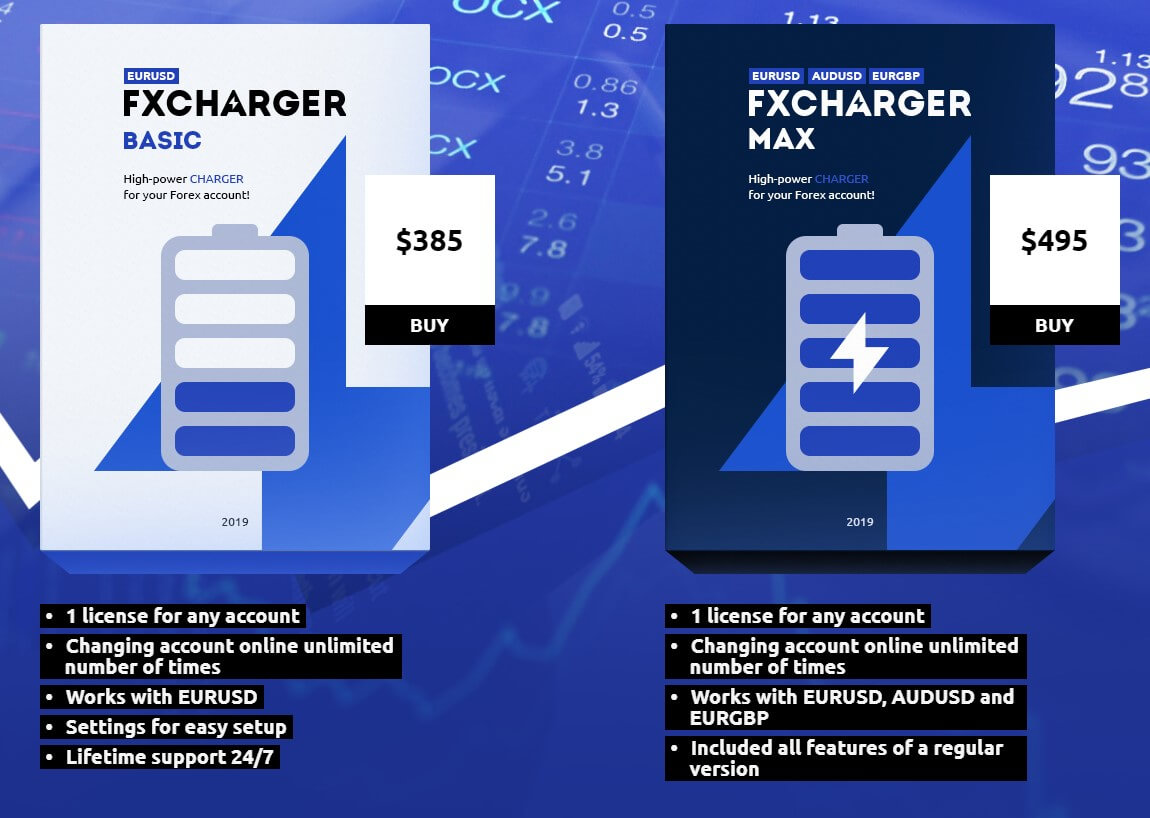
The cost for the Basic version that works only on the EUR/USD is $385, which puts this EA in the mid to higher price range. For this price, you will get one license for any account, unlimited account online changes, and lifetime 24/7 support. A 30-day refund policy is valid if settings are not modified. FXCharger Max version is $495 which is regarded as expensive. The Max version has the same benefits but works with the other currency pairs mentioned. No demo is available.

Conclusion

In our opinion, this website does not give out enough information about this EA given the price range and does not mention the martingale strategy that is applied. Users report mixed results from major benchmark sites. Some of them state the refund policy is just a fake promotion:

“Fraud, a liar company. 5 days ago I bought it on the forexstore.com. Thither are written that 30 day warranty for the EA, I wrote that the robot did margin call on the demo account , he’s wrote this is not enough for a refund. I question what the warranty applies to??? If i could not give an asterisk. Nobody take the https://forexstore.com page for anything. Company fraud and criminals.”

Another seemingly unhappy reviewer wrote:

“Other reviewer is right that this company and other sites own by this EA developer are luring people in by fake 30 day money back guarantee. Run away.”

Others, however, say the support is responsive and that they have solid results. The final rating is mixed but not enough for anyone at this price for a martingale EA, especially concerning the extreme drawdowns and inconsistent results in 2020. Another concern is the undisclosed exposure and no performance since 2019 on the AUD/USD pair. Finally, we can only see backtesting results and no live results for the EUR/GBP. The website does not set strong selling points and even the 30-day return policy validity is arguable.

This Forex service can be found at the following web address: https://fxcharger.com/

Categories
Forex Service Review

TickUnit Scalper Currency Strength28 Pro Review

TickUnit Scalper Currency Strength28 PRO is a new indicator type on the scene popular with the scalper trading strategies. It is designed for the MetaTrader 4 and published on 5th July 2019. Since then it has received frequent updates with very good additions such as to save tick data for faster recovery. The developer of this combo indicator is Bernhard Schweigert from Morroco and he has 12 products offered on the MQL5 repository, most of them are popular and have very high ratings from the users. He made a currency correlation/strength indicator using Tick-Units data on 28 currency pairs, or all of the major currency combinations. It belongs to the paid category and could be regarded as a complete trading system.

Overview

TickUnit Scalper Currency Strength28 PRO is a combination of Advanced Currency Strength 28 and Advanced Currency IMPULSE with ALERT, both of them, of course, is the developer’s separate product. Currency Strenght can be used on 11 different tick units, 1, 2, 3, 4, 5, 6, 10, 12, 15, 20, and 30 seconds. You will have the convenience to have a single chart for all 28 pairs trading under the subwindow. Now, since the indicator is used on the lower than M1 timeframe, up to 30 seconds, it is not the standard MT4 indicator. Advanced Currency Strength28 Indicator is used for the standard MT4 timeframes and is a separate product. Tick Unit Scalper Currency Strength28 is presented as the first tick unit indicator on lower timeframes than M1. As such, fas broker conditions are a must, also the spreads must be raw. A user manual is made and linked in the ‘Overview’ page. It is detailed with gif visuals, although not very clear, traders that have a bit of trading and MT4 knowledge will understand how to use this special indicator.

The feature list is interesting but now everyone will see the value-added just by reading the description. One would need to try the indicator first. Sensitivity modes will adapt to the trading style, be it super frequent or slow and steady. Alerts are possible for extreme values in the Currency Strenght meter so you will know when a very good opportunity arises. Each currency has special dynamics, so the indicator already has pre-set parameters for each, thus making optimal signals. Dynamic Fibonacci levels are used for the Price Action zones as part of the proprietary code for this indicator, and according to the signal is generated. The zones represent areas of Resistance and Supply and are recommended to add on, it Is another indicator.

A signal is very easy to follow, it will be shown in the window and with one click a chart will open the currency pair. Even though the pictures show the Take Profit levels, it is not very clear if they are calculated by the indicator or if they are just fixed values. Trades should know when to trade, the momentum will show when the market is flat and no currency stands out as the weak or strong. Also, the traders should avoid main fundamental analysis events or factors that could affect the market. This is common for most scalper strategies. This said testing is valid only if manually done.

The settings are very detailed, you can change the Alert parameters, set the sensitivity and timeframe, visuals change, and more. Bernhard Schweigert also packed the templates and profiles for the MT4 and also has a blog with many useful updates, news, and tips.

Service Cost

TickUnit Scalper Currency Strength28 PRO is not available to buy, only to rent for 3 months or 1 year. 3-month rent has a price tag of $98 and 1 year $148. A demo is available. The reason for this kind of charging is probably because of good ratings and sustainability for the developer in the long term. Scalping is very popular and this indicator is unique and not hard to use. The logic behind the strategy is sound but may use some popular techniques such as Fibonacci levels.

Conclusion

There are only 5 reviews for this indicator and sums up a rating of 3.8 stars. This is not enough to have a verdict. Some of the useful user reviews are:

“Very good indicator and signals, but one has to still do some more analysis to filter good and bad signals.”

“THIS INDICATOR WORKS AND I RECOMMEND IT. IT HAS MADE ME MONEY. AS I ALREADY SEEN ITS PERFORMANCE ON THE MOST POPULAR CURRENCY PAIRS…As with the other of Bernhardt’s indicators, this is a good one!”

Traders that have seen the indicator in cation with the demo can easily learn to use it and test it. Since the author has already made the templates and profiles, you should have a ready-made best settings for each currency. The rent price is small to pay if this indicator matches your fast-paced scalping trading philosophy, as it is specialized for these traders only. Whatsmore, using faster than the M1 trading period will require very high focus and stress that most beginners will have difficulty handling.

This Forex service can be found at the following web address: https://www.mql5.com/en/market/product/39366

Categories
Forex Service Review

Scalp Tools Support and Resistance Levels Indicator Review

Scalp Tools Support and Resistance Levels is designed to do one thing, to identify the Support and Resistance levels. Usually, indicators that are specialized to do one thing are the ones that do this very well. Most successful trading systems are composed of a few specialized indicators for every aspect of the system. Even though the indicator name has the Scalp word, it is not limited just for scalper systems, most Price Action systems will rely on the Support and Resistance levels. This word is probably included in the name of the indicator for SEO purposes.

Nevertheless, the indicator has a perfect rating, has been developed long ago, on 9th September 2014. The latest iteration is version 2.7 updated on 5th December 2017. Scalp Tools Support and Resistance Levels is, therefore, a relatively old indicator that belongs to the paid category on the MQL5 market. Martin Fischer from Germany, the developer of this indicator has 23 products total with mixed ratings and a good part of them is free.

Overview

The tool offered is advanced, with a few very interesting features. The calculation for the important market levels is calculated automatically on several timeframes regardless of the trading instrument. Therefore, the indicator is universal. The usage is self-explanatory and the publisher has a youtube video presenting the indicator in just 1 and a half minutes. What we can see is that the design of the tool is in the form of a window with a menu. Support and Resistance lines are one of the few other options.

Timeframes available are from M1 to Monthly, the same as the MetaTrader 4 platform for which the tool is made. Here you can set the High Low distance in bars, or a range for which the tool will calculate the levels. The minimal difference in pips is also a definition parameter and the history used in the automatic analysis is defined by the bars or candles number. Interestingly, the analysis has the option to calculate levels at the cursor, as you move it. This is a unique feature that requires some coding and creativity. All parameters have the + and – buttons for ease of use. Such design does not make the tool eligible for testing in the MT4 tester module, although the tool such as this works at the moment of inserting, there is no point in testing the Support and Resistance levels through the simulation.

You will see the levels based on the settings and the evident levels based on the Price Action. Since the tool can differentiate the levels on multiple and simultaneous timeframes (traders can set H1 and Daily Support/Resistance levels on one chart), it increases the versatility. This indicator also uses round price levels as important Support/Resistance points.

https://youtu.be/_0jZ2bTS1Ag

Settings available for the tool (additional ones) are visual and the autosave function. Visuals are of course about the line width, color, type, about fond size, and so on. The autosave has the option to save periods and the symbols or to save only periods. This is quite handy, a trader will have the previously set parameters for each trading instrument.

Service Cost

Scalp Tools Support and Resistance Levels price is $30 to buy and $10 to rent for 3 months. You will have 5 activations per purchase and the demo is available. Note that the demo works only on the separate link provided by the developer. The Free Demo button will not give you the version that works offline.

Conclusion

Scalp Tools Support and Resistance Levels has only 5 reviews, but all have perfect ratings. It seems the tool did not receive much attention and popularity despite the advanced design. The most useful review is by Hailey stating:

”This is the handiest indicator and I wish all indicators were built on this principle. Click on it to see sup/res lines, click on it to remove. The support/resistance lines are right on the money. I put it on virtually every one of my templates! I don’t know the developer and I’m not getting a kickback on a $10 indicator. Just telling what I see. Great indicator.”

From our perspective, the tool is very handy but does only one thing and one that many traders can do without the need for an indicator. Therefore, the price of $30 could be a bit steep for a beginner and unnecessary for an expert (who probably already has his Support/Resistance indicator). However, in case your trading Price Action system does not have such an indicator, and you would benefit from one, Scalp Tools Support and Resistance Levels is a good choice.

This Forex service can be found at the following web address: https://www.mql5.com/en/market/product/5965

Categories
Forex Service Review

Pattern 1-2-3 Indicator Review

This pattern is popular among the Pirce Action strategy traders, or more precisely, the 1-2-3 Pattern is a reversal signal distinguished by a zig-zag move at the end of a trend. This indicator automatically plots this pattern on the MetaTrader 4 chart (also available for MT5). Initially published on 28th September 2016 on the MQL5 market, the developer Pavel Zamoshnikov from Russia released a few updates at the request of users. It was updated with new functionalities and bug fixes finishing with version 3.5 from April 2019. Since the pattern is commonly sought-after, the tool received some popularity. The author has a large pool of released products consisting of 45 indicators, EAs, and signals.

Overview

The indicator is very specialized in what it does, but since the drawing of a pattern is subjective, this task is not easy to code and to give the right levels for drawing points 2 and 3. The base of the formula comes from the Zig Zag indicator that is adjusted through several conditional measures, some of which can be altered in the “Method for pattern triggering” parameter. The Overview page is clear, showing all that the indicator can handle. 1-2-3 pattern is drawn in real-time, and once it is completely formed an alert will be triggered, without any redrawing. A video presenting how the indicator work is great and short. These patterns can show on any trading instrument, be it in forex, equities, or crypto, while the indicator does not require manual setting adjustment for each.

If traders want to adjust the actual 1-2-3 numbers display, it can be easily done in the settings. Fibonacci levels are used in conjunction with the adjusted, non-repainting Zig Zag indicator, so the points are pinned to one of up to 5 Fibbonaci levels scanned by the indicator. These levels are also used to Stop Loss and Take Profit automatic placement and can be displayed with description if set so. A full alert component is used to signal the trader by email, push, or to a mobile device. If traders want a complete automatic solution, a new published Exper Advisor is containing the 1-2-3 pattern recognition from this indicator.

According to the author, the recommended timeframe is from M5 to monthly, although the greater the number of candles drawing the pattern the better and longer the trends are. However, it seems there are some limitations to useability. Intraday traders would need to focus on the EU and US trading sessions as the patterns are not reliable on other markets.

In the settings panel, you can adjust the number of candles for calculation, Zig Zag indicator depth, the method for pattern triggering (breakout from the 3rd point line or just touching), show Take Profit and Stop Loss levels and how they are calculated, some visual settings and how or when the alert will be triggered.

Service Cost

The Pattern 1 2 3 indicator can be bought for $30 with 10 activations without the option to rent it. A demo is offered in the separate link on the ‘Overview’ page. This price is relatively low comparing to other indicators doing the same or similar function but we have found some free versions elsewhere, just not exclusively made for the 1-2-3 pattern.

Conclusion

A total of 19 users gave this indicator a good rating of 4.6 stars and commenting often, showing high interest. This descriptive 3-star review shows not all are happy:

“After purchasing the indicator, I found a lot of problems. From a formal point of view, this is a good indicator. However, when used in practice, there will be too much noise, which is not practical. The formation of the trend is mainly after the completion of the 123 mode, that is, after breaking the 2 points horizontal line. If only 2 points of the horizontal line are needed. After the breakthrough, the market signal is stable and other signals are redundant. Any other signal warnings are noise. There are no such separate alert message reminder options set in the metrics. Your indication is that multiple message reminders appear with a switch and the sound is the same. This is not a very good difference, it is trouble…”

Just note there are only two reviews with a rating lower than 5 stars.

This Forex service can be found at the following web address: https://www.mql5.com/en/market/product/18523

Categories
Forex Service Review

FFx MACD Divergences Indicator Review

The MetaTrader 4 and 5 platforms come with one of the most popular indicators known to traders – MACD. FFx MACD Divergences build upon the already integrated indicator in the MT4 platform, extending the functionality especially useful for divergence strategy traders. This paid indicator is published on 4th July 2014 on the MQL5 repository and since then has no received much attention. The latest version has not changed since the initial placement and remains at 1.0. The author of this extension tool is Eric Venturi-Bloxs from Thailand. This author has no less than 52 products on the mql5.com, a good portion of that is free.

Overview

This extension indicator is simple. It adds hidden and classic divergences on the MACD averages and displays it in a single window for multiple timeframes. This way, traders that rely on trade filters based on higher timeframe divergences can have a glance if there is one. The display will show as many timeframes you set in the settings in multiple small subwindows. The addon on the tool is very simple but original and useful for the followers of the divergence strategies.

The settings available allows traders to set timeframes from M1 to Monthly, set the number of bars for each timeframe window, set alerts on various conditions, change colors, and so on.

Service Cost

The price of this simple and useful indicator is $10 for 5 activations and there is also a demo. The price is not high given the rarity of such tools.

Conclusion

User ratings are 5 starts but based on only 3 reviews since 2014. Still, it should be understood that this tool targets specific traders. One of the reviews perfectly describes how FFx MACD Divergences can be used:

“Woooooow!! love it! I trade low TF signals based on H4+Daily Divergence. Now when my indicator gives me a buy signal on e.g. M15 then I immediately see if there is higher TF divergence or not on the same chart. Trade Yes or No? Decision takes one second now. Thank you for this great tool and the cheap price Eric!”

The author developed similar small useful gadgets for other trading styles.

This Forex service can be found at the following web address: https://www.mql5.com/en/market/product/4900

Categories
Forex Market Analysis

Daily F.X. Analysis, July 16 – Top Trade Setups In Forex – ECB Policy Decision In Highlights! 

It’s going to be a busy day from a fundamental’s viewpoint, as the European Central Bank is due to release its rate decision. Furthermore, the U.S. will be releasing a series of high impact events like Retail Sales m/m, Philly Fed Manufacturing Index, and Unemployment Claims. Although ECB isn’t expected to hike the interest rate, the ECB press conference can drive movement in the EUR/USD pair today. Besides, U.S. events are expected to perform adversely for the U.S. dollar.

Economic Events to Watch Today 


EUR/USD – Daily Analysis

The EUR/USD pair was closed at 1.14114 after placing a high of 1.14473 and a low of 1.13900. Overall the tendency of the EUR/USD pair remained bullish throughout the day. The EUR/USD pair continued its bullish streak for the 4th consecutive day and reached a multi-month high level near 1.14500 level on Wednesday. The pair rose to the highest level since March 10 in the early Wednesday trading session. Nevertheless, it did not live there for long and was pulled back in the American session.

The upward movement of EUR/USD towards a multi-month high level was caused by the European Central Bank’s monetary policy meeting on Thursday. The lower move was triggered by a recovery of the U.S. dollar across the board. The U.S. Dollar Index (DXY) erased most of its losses and recovered from weekly lows, rose above 96.00 level, and gave strength to the U.S. dollar that eventually weighed on EUR/USD pair.

The risk sentiment was also up in the market by the optimism about the potential vaccine for COVID-19. As a result, the Dow Jones was up by 0.80%, and NASDAQ was up by 0.35%.

On the data front, the U.S. dollar was strong due to better than expected data released on Wednesday. The Empire State Manufacturing Index was published at 17:30 GMT, which showed that the index rose to 17.2 from the expectations of 10.0 in July and supported the U.S. dollar.

The Import Prices from the U.S. in June rose to 1.4% from the expected 1.0% and supported the U.S. dollar. The Industrial Production data was announced at 18:15 GMT, which showed an expansion in activity by 5.4% against the forecasted 4.5% and supported the U.S. dollar. The Capacity Utilization rate from the U.S. Roseto 68.6%from the predicted 67.9% and supported the U.S. dollar. It eventually weighed on EUR/USD pair in late trading session and forced it to lose its early daily gains.

In Europe, the key event ahead is the European Central Bank meeting on Thursday, in its last meeting, ECB made its biggest decision in June and left the rates unchanged and provided no stance to change further. The focus will be on the press conference, where traders will keep an eye on Lagarde’s speech to find fresh clues about the economic outlook. However, the tone is estimated to be positive, and Lagarde’s firm commitment to the full 1.35tn euros PEPP is also expected.


Daily Technical Levels

Support Resistance

1.1384    1.1445

1.1356    1.1480

1.1322    1.1507

Pivot point: 1.1418

EUR/USD– Trading Tip

The EUR/USD is taking a bearish turn after placing a high around 1.1446 level. The closing of candles below 1.1446 level can extend selling until the 1.1390 level. Closing of candles above 1.1390 level can drive buying in the EUR/USD pair, but in case, the bearish breakout occurs, we may see EUR/USD prices dropping towards 1.1365 level.


GBP/USD – Daily Analysis

The GBP/USD pair was closed at 1.25879 after placing a high of 1.26467 and a low of 1.25417. Overall the movement of GP/USD pair remained bullish throughout the day. The GBP/USD pair edged higher on Wednesday on the back of increased risk-appetite that made the U.S. dollar weak due to weakened appeal for the safe-haven currency. The risk sentiment was bolstered by many factors, including reports suggesting China’s economy was rebounding despite the COVID-19 pandemic.

As in result, Investors shifted towards riskier assets like GBP/USD currency pair as the world’s second-largest economy was continuously showing improvement while America was lagging. The latest US CPI data that edged higher by 0.6% was also not enough to boost the U.S. economy’s confidence.

The soft demand for the U.S. dollar due to an extended period of weak growth and the prevailing second wave of coronavirus induced economic downturn, helped the GBP/USD to move upward on Wednesday.

The Pound rose on Wednesday following the release of the latest U.K. Consumer Price Index for June that exceeded the forecasted 0.5% and came in as 0.6%. As in result, investors became more optimistic about Britain’s economic recovery.

The policymaker of Bank of England, Silvana Tenreyro, said on Wednesday that Britain’s economic recovery from the coronavirus lockdown would probably be delayed by the consumer’s caution towards viruses, decreased activity due to social distancing and rising unemployment. She added that behavioral responses mean that the U.K. economic outlook will continue to depend on the global and domestic spread of COVID-19.

She also said that she was prepared to push for fresh stimulus measures to aid the U.K.’s struggling economy. She said that a V-shaped economic recovery was unlikely.

On the data front, the Consumer Price Index for the year from the U.K. was released at 11:00 GMT, which showed an increase to 0.6% from the forecasted 0.4% and supported British Pound. The year’s Core CPI also increased to 1.4% from the expected 1.2% and supported GBP.

The PPI (Producer price index) Input for June from the U.K. decreased to 2.4% from the expected 3.0% and weighed on GBP. However, the PPI Output for June increased to .3% from the anticipated 0.2% and supported GBP. The RPI (Raw-material price index) for the year came in line with the 1.1% expectations. Most of the data came in better than expected and supported British Pound that gave strength to GBP/USD pair and made it move on the upside.

Besides, the Empire State Manufacturing Index rose from 10.0 of the forecast to 17.2 and supported the U.S. dollar. The Import Prices for June came in as 1.4% against the 1.0% of expectations and supported the U.S. dollar.

At 18:15 GMT, the closely watched Industrial Production for June rose to 5.4% against the expectations of 4.5% and supported the U.S. dollar. The Capacity Utilization Rate increased to 68.6% from the forecasted 67.9% and supported the U.S. dollar. The strong U.S. dollar failed to reverse the bullish momentum; however, it managed to limit the additional gains in GBP/USD pair on Wednesday.

Looking forward, GBP investors will be waiting for the release of the UK ILO Unemployment rate for May on Thursday. If unemployment rises, the U.K.’s GBP will show signs of losses. Meanwhile, U.S. traders will await the U.S. Retail Sales data. Any sign of fall in Retail Sales will undermine the U.S. dollar.


Daily Technical Levels

Support Resistance

1.2535   1.2638

1.2490   1.2696

1.2432   1.2742

Pivot point: 1.2593

GBP/USD– Trading Tip

The GBP/USD is trading with a selling bias at 1.2550 level, holding right above the support level of 1.2548 level. Downward breakout of 1.2548 level can extend selling until 1.2506 and 1.2479 support. The MACD and RSI both are supporting a bearish bias. On the higher side, the GBP/USD pair can face resistance at 1.2575 and 1.2595. Let’s consider taking Sell trades below 1.2533 level today. 


USD/JPY – Daily Analysis

The USD/JPY pair was closed at 107.233 after placing a high of 107.432 and a low of 107.116. Overall the movement of the USD/JPY pair remained bearish throughout the day. At 9:30 GMT, the Revised Industrial production for May from Japan came in as -8.9% against the expected -8.4% and weighed on Japanese Yen.

At 15:00 GMT, the NFIB Small Business Index for June raised to 100.6 from the expected 97.5 and supported the U.S. dollar. At 17:30 GMT, the Consumer Price Index for June increased to 0.6 % from the expected 0.5% and supported the U.S. dollar. For June, the Core CPI also rose to 0.2% against the expected 0.1% and supported the U.S. dollar.

On Tuesday, Federal Reserve Governor Lael Brainard offered a downbeat assessment of risk ahead. She said that the path ahead for the U.S. economy was under the clouds of high uncertainty, and the Federal Reserve should use forward guidance and large scale asset purchases for a sustained period to help the recovery.

In a virtual event hosted by the National Association for Business Economics, Brainard said that the pandemic was the key driver of the economy’s course. A thick fog of uncertainty still surrounded the U.S. and downside risks predominated.

The calls for further stimulus accommodation from the Federal Reserve by Brainard weighed on the U.S. dollar that dragged USD/JPY with it.

However, the uncontrolled rise in the numbers of coronavirus cases from the U.S. made investors cautious about holding the greenback, and hence, USD lost its traction and weighed on the USD/JPY pair.

The losses in the U.S. dollar were extended after many countries reported renewed lockdown measures to help control the virus’s spread. The California State, which is considered the most populous state of America, also imposed renewed restrictions and weighed on the U.S. dollar as its economic recovery would be difficult.

The cities and states imposed lockdown measures on the back of warning given by the World Health Organization that pandemic could only worsen if countries failed to follow strict precautions. In response to this, Hong Kong, Philippines, Hungary, Australia, and California announced lockdown measures. These restrictions imposed negative pressure on market sentiment as it will affect the global economic recovery.

Meanwhile, Beijing announced sanctions on Lockheed Martin for his involvement in the latest U.S. arms sale to Chinese-claimed Taiwan. This raised the ongoing tensions between the U.S. & China that were already heightened due to the South China Sea issue. The lockdown mentioned above restrictions and ongoing US-China tensions raised a safe-haven appeal that supported Japanese Yen and weighed on USD/JPY pair.


Daily Technical Levels

Support Resistance

107.10    107.43

106.94    107.60

106.77    107.75

Pivot point: 107.27

 USD/JPY – Trading Tips

The USD/JPY is trading with a bearish bias at 106.997 to consolidate within a wide trading range of 107.350 to 106.950. Recently the USD/JPY pair has crossed below 50 EMA, which extended support at 107.100 level, including now the same level is going to work as a resistance. The bearish breakout of the 106.900 level can extend the selling trend until 107.620 and 106.37 level. The MACD and RSI support bearish bias, and we may take a selling trade below 107.27 today. Good luck! 

Categories
Forex Service Review

Currency Strength Matrix Indicator Review

Currency Strength Matrix is a paid indicator published on the MQL5 marketplace designed for the MetaTrader 4 platform. It belongs to the trend confirmation category although it is used in conjunction with other indicators. It tries to differentiate by offering better information for Price Action, Reversal, and Momentum trading strategies, according to the developer’s words. The initial version was published on 5th July 2017 by Raymond Gilmour from the United Kingdom, author of just one more indicator called Cycle Finder Pro.

All are with positive ratings although the developer made these to use them as a sales funnel to his website, it seems. Nevertheless, the indicator is not overpriced, the last update was on the 2nd of April 2019. Most of the updates optimized the code for better performance, some of the early updates added functionalities such as better identify cycles, automatic reading price action for oversized bars, and some visual upgrades.

Overview

The MQL5 Overview page has good content and clearly shows how to operate the indicator. Yet the inner workings are not disclosed. What is presented are three modules, each with its representation and performance. The Trend Matrix module is a table that shows which currency pair is in the trend by plotting a 1 in the corresponding matrix cell. This way could be confusing at the start but once you understand that the left table side currencies are terms, you can know if the trend is up or down. However, the second module shows the strength of each major currency (8 of them). This table measures the score for each currency from -6 to 6 where 6 is the most extreme case of a strong currency.

The score is calculated using the relevance of other currencies plus the 1 or 0 from the Trend table. Comparing the scores traders will know which currency is the weakest and the strongest and thus have a better perspective when entering trades. The last part of the Currency Strength Matrix combo is the Momentum chart. Basically, this is the Strength table represented in a chart moving in real-time. By looking at it traders can see the momentum or where the trend is progressing to. Additionally, the chart will show the lines for each currency, the line crossing can be the trade entry signal confirmation.

Currency Strength Matrix can be used and in our opinion, must be used along with other indicators. It is a first step in the decision process since it shows the most probable currency pair having a strong trend, or are not strong enough for any trade entry. The user guide describes 3 types of trading. The confirmed trend is when all 3 modules show a clear signal on one currency pair. Pairs should be consisting of a strong currency with a score of at least +5 and a weak one with at least -5. For “early trends” traders can use the 0 level line crossing on the Momentum chart that will signal the currency gaining or losing strength.

One should also be careful to select currencies only gaining momentum from the extreme scores, such as -5 or +5. “Begging trend” trading is done by looking at what currencies are at extremes and entering a trade once they start moving out of the extreme zone. This method carries the biggest risk but traders may have entered perfectly into an early and long trend.

In the settings panel, traders can adjust the ATR multiplier used for oversized candles detection. A lower multiplier will detect more candles but smaller. Calculation frequency can be adjusted so the indicators will use more time until they update. The rest of the settings are more cosmetic, turning the panels on or off, changing the font size and color, and so on.

Service Cost

The price for the Currency Strength Matrix is $98 for 10 activations. To rent it for 1 month will cost $39 and for 3 months $59. A demo is available. Notably, the author is promoting a free indicator that comes along with this one called Easy Draw for easy market switching.

Conclusion

As for the ratings, currently, 16 reviews are giving an average score of 4.5 stars and 136 comments. This shows that the indicator has some popularity although it does not reach the level most authors would like. The quality of the code seems to produce issues to some traders, most of the updates are about optimization. Certain users complain about this:

“Not good for me and bad. I do not recommend it at all. The owner of the indicator is asleep. There is no support or update for this indicator. Which I did not benefit from.”

Overall, currency strength meter indicators are popular among traders and therefore many versions are doing the same thing as this one. Some of them are free and can be found online.

This Forex service can be found at the following web address: https://www.mql5.com/en/market/product/23149

Categories
Forex Service Review

Density Scalper Forex EA Review

Density Scalper is a very interesting scalping strategy Expert Advisor developed for the MetaTrader 4 platform and published on the MQL5 website. The scalping is defined by the Mean Reversion strategy, meaning the trades are made on the assumption the price of an asset is high or low enough for a reversal to happen. Therefore this is a reversal scalper EA that avoids “unnatural” market events during the day and relies on the simple laws of demand and supply to find the most accurate signals. The developer is Roman Lengert from Germany who initially published the EA on 10th October 2019 on the MQL5 market.

Overview

The latest version is 2.4 updated recently, on the 10th of March 2020 during the latest COVID-19 world market event. The base code and idea of this EA are not new from the author, the previous product called NY Close Scalper is using the same principles except Density Scalper is optimized for better slippage management. Therefore the release date does not mean the EA does not have enough forward testing done.

In the Overview page of Density Scalper, there are a few disclaimers first. Aside from the general, that the past and backtesting performance does not guarantee future performance, there is a note stating any flash movements may ruin the strategy implemented and therefore the EA works only during the calm market environment and used the Stop Loss level. The execution of the Stop Loss may be delayed depending on the broker during the flash crash or other major events.

Every position made by this EA has the Stop Loss set. Mertinglage, Grid, or other unsustainable methods are not used. Density Scalper works on the M5 timeframe on the following assets: EUR/USD, GBP/USD, EUR/CHF, USD/CHF, USD/CAD, EUR/CAD, and EUR/AUD. Other experimental currency pairs are AUD/USD, AUD/NZD, AUD/CAD, EUR/NZD, CHF/JPY, GBP/CAD, GBP/AUD. Interestingly, the author showcases the maximal drawdown in $ value per lot or $35-50 per 0.01 lots for 16 years. In percentage terms, we have noticed 3.8% up to 4.97% in a different condition and a bit shorter-term (since 2009). Still, this Drawdown level is very attractive considering very good performance.

Quant Analyzer is used to showcase the performance. Some notable backtesting facts are 84.02% winning rate, 3.8% maximal drawdown using fixed lot allocation (0.1), $4.9 average trade value, 146.85% average yearly gain (portfolio on multiple pairs tested from 2003 using $5 commission and 150ms execution delay). Backtesting from 2011 till the end of 2019 shows a 4.98% drawdown on complete portfolio trading, 78.5% winning rate, 58.37% average yearly gain, and 9864 trades for this time.

Roman Lengert puts some effort to leave a rounded up quality supports and leaves a link for users to have good settings and have live monitoring charts. The links are provided on how to set up all of his EAs too in a separate blog post. The content is very organized and of high quality, leaving the impression of a dedicated developer that also has great knowledge about trading. Since the EA is a scalper on the M5 timeframe, it is imperative to have a good broker with low spreads and slippage and fast executions. A VPS is also needed for constant running as the EA collects historical data for trading. In the event of market disruptors such as elections, BREXIT, etc, the EA should be off. Note that the EA is using the Breaking News Filter in the results, to filter news impact on the market. The link is provided and recommended to use in conjunction.

As for the settings, there are just a few related to Money Management and certain trading conditions. Lot type can be set to “fixed” or “increasing”, while the maximum spread tolerance can also be set to avoid trading in times of high dynamic spreads. There are also other uninteresting settings related to server time and so on.

Service Cost

The price of Density Scalper EA is extreme, $2000 to buy having 5 activations, $125 to rent for 1 month, $300 for two, $500 for 6, and $900 for 1 year. To some, the price is well worth the trouble. The developer is very supportive and posted that for users that rented the EA lately causing disappointing results, he will discount the price for future rents. The demo is available so you could test this EA. According to the quality work and dedication, the price may be worth it if you have good results.

Conclusion

The final rating of all Roman Lengert’s work is above 4 and for the Density Scalper, a perfect 5 star based on 8 user reviews on MQL5. This sample may not enough get a complete picture of user satisfaction although there is a good probability this EA is a great addition to the trading community. Some of the user praises are:

“I have never seen a better EA, Roman is a very good Developer and his support is great. Five Stars!!”

Or the latest one from March 2020 describes the service very well in detail:

“Best Scalper and developer out there on MT4. Roman is brilliant in providing full transparency on all his EA’s, backed up with live results across multiple brokers. I have been running it now for 6 months and all my results across all his EA’s mirrors his signals perfectly, unlike other scalping programs out there at the moment. Roman has taken care of building in loads of safety checks and balances on slippage and account protection in case of a market crash. He is also very active in its on-going development and always responds very quickly to any questions. 10/10.”

On the MQL5 analysis page using the AxiTrade live account, Density Scalper shows ongoing trading since the 23rd of March 2019, a total of 211 trading days. The average holding time is 49 minutes meaning the EA is not the classic scalper. The chart shows a growth of 40.9% for this time, 37.39% for 2019, and 2.55% for the part of 2020. The developer stopped trading since the COVID-19 volatility spike on the forex market. The reason lies in the EA’s unsuitability to run in this environment as there is no calm nighttime. In March, Density Scalper suffered a loss of 1.43% with a spike in Drawdown like in the crisis 2008/09.

This Forex service can be found at the following web address: https://www.mql5.com/en/market/product/40941

Categories
Forex Service Review

CentoBot FX Trading Robots Review

CentoBot is a platform that offers trading robots exclusively for their platform and brokers. The website is basic without much information about the robots provided and total obscurity about the company behind this service if there is one. CentoBot website looks like more as a landing page for the three brokers the robots service is connected to than any real automated software provider. The presentation will show how to register, how to set up a robot, and an account on their platform.

Whatsmore, there are 3 awards about offering “the best binary options robot” in 2016, the “Top quality” award, and “100% Confident”. These awards look like leftovers from website development page templates that serve just to fill in space, they are completely made up in a very uncreative way. All of the links on the page lead to registration, a marketing tactic used to lead visitors to registration without spending too much time reading.

Overview

CentoBot presents several of its top robots on its single-page website, including:

Cryptobot v2.0 is based on MACD and RSI indicators and works with popular cryptocurrencies. MACD and RSI are one of the most popular indicators although many newer iterations based on these are regarded as better. CentoBot dares to say that this robot generates 300% gains a month, a figure too high to be considered seriously.

Bitcoin Algo v2.1 uses past data on main cryptocurrencies to enter trades. The algorithm probably uses Price Action levels but there is no more information about this one.

Ethereum Rise v1.1 is specialized for Ethereum and uses the “CCU” (probably CCI) and Stochastic indicators. Note that both of these indicators are not designed to be used for crypto, both are developed decades ago before cryptocurrencies.

Crypto Majors v1.1 is literally described in the same way as the Cryptobot v2.0. Using the same MACD and RSI combination for major cryptocurrencies.
Altcoins Combo is specialized for altcoins. It is described as to use diversification as the primary feature.

The final option is to create your custom robot with indicators and strategies.

We went on and registered to try the demo that is offered. The registration will ask you to select 3 brokers, Binarycent, VideForex, and RaceOption. These brokers are all offshore, unregulated, and do not have positive user feedback on benchmark sites. Whatsmore, all of them are blacklisted in some jurisdictions. Once you register you can see some more robots on the list and the gains they produce. The gains are all positive and, according to the CentoBot representative, all are during a 2 to 4 weeks period. The worst top 10 robot gained 103% and the best is called xCryptoProfit with 253% gains.

You will have the option to “Unlock the robot” and “Robot Demo”. The Robot demo is false. What is presented is some slider movements on various crypto assets like the robot is in action and a chart with the balance and time axis. Of course, the demo will be over in a few seconds and an always positive report will show, usually the same gain numbers.

On top, there is a country and name initials where allegedly latest client results are shown. Interestingly, the US flag is there even though it is stated that CentoBOt does not accept US citizens. After the demo, you will be asked to deposit with the selected broker during the registration. The minimum deposit is $250 with the RaceOption, but the other 2 brokers have the same minimum deposit requirement.

Service Cost

We’re going to assume that each robot carries a different cost, but are unable to confirm this because costs are not shown until after an account is registered. Requiring an upfront registration is a common marketing tactic, but nonetheless, is problematic and could be viewed as rather sketchy.

Conclusion

It is evident that CentoBot, unfortunately, is just a funnel page for these brokers that probably belong to the same group. They have similar bonuses, offers, and marketing. The robot’s performance could not be measured and the gains presented are also most likely fake. CentoBot website does not try too hard to present a good cover and even beginners will see through the obvious manipulation.

This Forex service can be found at the following web address: https://www.centobot.com

Categories
Forex Service Review

Do It Multi-Currency Trading System Review

Do IT is an Expert Advisor developed for the MetaTrader 4 platform and is published on the MQL5.com by Ildar Kabirov from Russia. The EA is also available for the MT5. The latest version is 7.77 updated in March 2020. Ratings received are generally positive and there is a high activity in the comments section. Do IT is designed to be fully automated and specialized for Forex, and indices on the 1H timeframe.

Overview

The exact markets described for the EA are EUR/USD, GBP/USD, DAX30, USD/JPY, Gold, and SPX 500. The developer has a very good description page where the settings for the latest version and links for proper testing are published. To contact Ildar Kabirov he also posted a Telegram channel. This EA does not use Martingale, Grid or Averaging trading methods as they are often criticized by traders, for a reason. If your broker uses FIFO execution Do IT should still work fine.

The main features of the EA are the use of only pending orders on the broker’s server, high slippage and spread filter, weekend closure, trades are time-limited with a fixed Stop Loss and search algorithm for signals. There is a detailed instruction guide for settings parameters. Users can set how tolerable the filter for slippage and spreads will be, how much exposure (risk) will be per trade, set the virtual or real Stop Loss fixed amount, Take Profit and Trailing Stop set up, set working hours, and so on. A newsreader or filter is also available but you will have to set it up using the webpage containing the Investing.com news raw list. This list is easier to include in the EA reading that is displayed on the MT4 chart.

The most interesting part is the settings about the deviation. Do IT seems to be entering trades based on the price deviation during a certain period. Whatsmore, the channel deviation is used as a step signal for entering new trades. The ATR indicator is also used for trades entry in combination with the Parabolic SAR. SO based on the demonstration video, Do IT seems to be waiting for the low period of volatility to set pending orders on the channel, with the set Take Profit and Stop Loss levels. When the volatility spike occurs, pending orders get triggered in one way and the EA is then waiting for the Take Profit to close the trade or for the timeout. Based on this, the EA can be categorized as a trend and as long term scalper.

https://youtu.be/gSU1jIISKB8

As for the performance charts, the developer has published some very good results. The EUR/USD pair on the H1 timeframe showed 97% winning trade and 9% Drawdown for the whole year. For 10-year period testing, using the 99.90% precision modeling, showed 3.7 M profit from initial 1000 deposit, 10.28% Drawdown, and 89.7% winning rate in the money. For the USD/JPY pair, Do IT performed similarly. 93.7% profit trades with just 1 consecutive loss. Drawdown is a bit higher than with the EUR/USD to 13%.

On the DAX 30, the performance is still above 90% winning trades, but note that for the whole year the number of trades is 66, unlike USD/JPY with 286 total trades or EUR/USD with 275. Gold/USD has even more impressive results with 95% winning trades although we have noticed 3 losses that resulted in a noticeable dip in the balance. A large number of small profits contribute to this high percentage although when a loss is incurred, it is several times larger than a winning trade.

Service Cost

Do IT EA belongs to the higher price range. For $990 you will have 5 activations. It can also be rent for $490 per year. The demo is available so you will have a chance to test it before buying. The EA is best used on brokers with small slippage and spreads even though it is optimized for the H1 timeframe. In recent developments on the Indes and Equities market, the EA has shown poor results given the increased slippage, spreads, and volatility caused by global events like the COVID-19.

For this reason, the developer introduces additional protection modules (recovery mode) such as average profit trailing in recovery mode, protective fixed breakeven for recovery mode, and graphical visuals. The latest developments are extreme, as such every EA is finding difficulties to cope with extreme values. It is great to see the developer working on implementing additional safety in a very short time. Owners of Do IT can expect great support and an official channel on Telegram.

Conclusion

Do IT has a very good rating of 4.6 stars based on the MQL5 repository and 45 user reviews. The comments are fresh and generally, the EA is popular. Note that there are some Russian language commentary and reviews but they are positive. From the negative reviews, we could see traders complaining mostly about the big losses once they occur:

“The order quantity is too small. Loss is too big.”

“Backtesting before 2010 will tell. Will not be usable for a long time. If the market conditions change slightly, EAs that fall during non-optimized periods will fail. Fortunately, the author seems to be always optimizing for now, so he’ll be fine as long as he keeps doing it. Small profit, big loss.”

In our opinion, this EA price is just too high to be sold on a larger scale. There are more affordable EAs that have been on the market for many years showing consistent results and updates. Also, once the abnormal market events occur, the whole year of profit trades may be countered with just a few losing trades. Still, for the ones that can afford it, the strategy used on this EA is used by trend traders, has good logic behind it, the ratings are also very good and the support is there.

This Forex service can be found at the following web address: https://www.mql5.com/en/market/product/43883

Categories
Forex Service Review

FX Power Currency Strength Meter Review

FX Power for the MetaTrader 5 (MT4 also available) is an indicator presented as “the first currency strength meter with a complete history across all timeframes”. Essentially it can be used standalone or as one of there indicators that compose the author’s Simple Trading System. The FX Power indicator developers are the Stein Investments team from Germany. The latest version is 3.76 updated in March 2020 and the first version is published in 2016.

Overview

Using this indicator requires some basic knowledge about the values of the currency relation measurements or the Delta. Although the logic is simple, the use of this indicator requires you to follow a certain strategy, and by this we mean it is not intended for scalpers on the 1 or 5M timeframe. The author has composed a very nice page about the indicator and a youtube video describing all the features of his indicator. The main purpose is to measure movement power or currency strength against others, although it has other purposes that could be used, such as quick chart switching from a single window.

The main features of FX Power are:

  • The non-repainting, real-time display for all brokers
  • Multiple timeframe selection that is not by default
  • The movable panel display suitable for higher resolutions
  • Automatic configuration
  • Alerts
  • EA friendly

The author presents some usage tactics but in our experience, if the indicator is used standalone and not as part of the Simple Trading System, it is completely irrelevant as the indicator should be in-line with the trader’s custom system. Also, the indicator does not represent all in one trading solution. However, Stein Investments presents 3 possible scenarios:

  1. Tradeline crosses. Each line represents a currency.
  2. Use the combination of two time periods to confirm a cross.
  3. Use currency combinations, if two currencies are getting stronger than one, the signal is more probable.

The indicator has a great and intuitive way of changing analysis timeframes from a control panel list box. The panel alone is very nicely coded, has very useful tools. The currency strength has several modes of display in this panel, as a HeatMap, DeltaMap, Symbol, Compact, and Equalizer. The Equalizer will display currency power similarly as music tone equalizer power meters, Compact will shink the panel to show only major single currencies with their Delta value, Symbol view that will show only the currently active chart currency pair, and the most interesting DeltaMap that will show an 8×8 matrix using the 8 majors and the pair combinations with the respective Delta value – excellent for searching trade opportunities on both directions.

Clicking the crosshair located on the panel will show all 8 currencies on the indicator chart if you want to see the relation to others. According to the author, the Delta peaks, or values above 6 or below 3, are considered as good exit indication, similarly to the RSI oversold and overbought levels. The Delta panel is moveable across the MT5 and can be placed anywhere you like with the drag and drop.

Settings for FX Power are very nicely categorized and have a plethora of options for each. Starting with the analysis period, you can select many non-default ones such as 8H, 10 minutes, 3 days, or 2 years. Customizing the panel and indicators looks is easy offering the line style, color for each currency, and similar. Alerts customization is also great with a good understanding of the trader’s needs. In this light, you can set up your alerts on line cross, certain level (Delta or currency) trigger alert be it low or higher threshold. Mobile, email, or sound notification alerts are optional.

Service Cost

The price tag for the FX Power meter indicator is $49, the same is for the MT4 version. Renting it is possible, $29 for 3 months or $39 for the whole year. There are 10 activations offered after purchase. A demo is available. The price is right at the point, the indicator is high quality and useable. Of course, there are similar ones for free if you are picky, but probably not the same quality or options.

Conclusion

The indicator received great reviews. The MT5 version has only 3 user reviews from the MQL5 repository but the more popular MT4 has an almost perfect 4.9 ratings from 70 reviews. The ones that left 1 star were hard to find and totally irrelevant, like this one:

“VERY DANGEROUS discretionary trading approach you can burn all your deposit if you don’t be skilled enough. You need a plan a money management strategy and an exact entry signal approach. BE WARNING WITH THE DISCRETIONARY TRADING SYSTEM THEY CAN BE CATASTROPHIC ESPECIALLY IF YOU DON’T BE SKILLED”.

It can be said that this indicator does exactly the job it is intended to the point of perfection. The combination with other trading systems is great, it can serve also as a filter for entries, as an exit indicator or as trade entry. Our recommendation is to use as an opportunity scanner on multiple timeframes, just be sure to use the right one for your trading.

This Forex service can be found at the following web address: https://www.mql5.com/en/market/product/16252

Categories
Forex Service Review

EMA Cross Alert Signal Indicator Review

EMA Cross alert is a simple but paid category indicator created by Suriya Thammalungka from Thailand. The EMA means Exponential Moving Average, an indicator used very frequently in many combinations but mostly as a two-line crossing for trend following. The indicator is simple and is never updated since the initial version in June 2016 for MetaTrader 4. It is interesting to see this indicator in the paid category as it is too simple to belong here and the indicators used are basic.

Overview

Traders mostly use the 50, 21, and 100 period EMA for as the support line and in combination with a faster EMA for a signal. This is what the indicator’s main purpose is, to alert on the faster EAM crossing the slower. By default, you can insert as many EMAs as you want onto your chart in MT4.

Service Cost

To purchase EMA Cross Alert you will have to pay $19 for 5 activations, or $12 to rent for 3 months. A demo is available. The response to this release is absent. There are no reviews and no comments. The reason for this is the indicator simplicity, EMA already exists in the standard MT4 installation and the only this the author did is add the alert on the cross with an arrow. Other indicators like this exist and they are free. Therefore, there is no reason to spend $19 on this version. There are other simple products by this author (10), interestingly, none of them have received any rating or popularity.

Conclusion

There is nothing worth mentioning with this indicator except that is has the alert system on line cross. The alert can be turned off in the settings but there are no special notifications. Essentially, there are 3 settings, period for the first and second EMA, and the alert on/off setting. Based on the settings, the EMA will leave a visual arrow on the chart on the candle close on any timeframe. You can customize the periods giving you different uses. The author published a video with all the settings demonstration. Of course, it is nonsense to measure the performance of such a simple indicator.

This Forex service can be found at the following web address: https://www.mql5.com/en/market/product/16974

Categories
Forex Service Review

DAX Robot CFD Trading System Review

DaxRobot is an automated trading product associated with the Daxbase.com broker. It is intended to work with CFDs offered by this broker. The features or the inner workings of the DaxRobot is completely obscured. There is no useful info about this robot and all signs points to be another sale funnel page similar to the Centobot we have already reviewed.

Overview

The DaxRobot website could be described as a 15-minute project without any new, non-template content except for the fake rewards and 3 step guide to registration (the same as with Centobot). Since the lack of information is even more pronounced than with Centobot, it is possible the visitors to this page already come from a marketing email or link with some unethical form of marketing. No one would invest is DaxRobot with just reading these 3 steps unless receiving some prior information.

If you register you will see the classic registration form and you will be able to open accounts in USD, EUR, Bitcoin and Litecoin. DaxBase broker will offer a 5% bonus if you choose the cryptocurrency, probably since there is no way of charging back them once they are sent, unlike with the Visa or MasterCard using fiat currency. There are 10 top robots list that you can select. The most successful one called CryptoADX 2.0 shows a profit of 364% gain. According to the support chat representative (the same one as with the Centobot) the timeframe for this measurement is 2 weeks. Of course, the gains this high could only be possible with extremely reckless money management and very catching several extreme market movements.

The lowest-performing one is the RVI and MA with a 96% gain. There are no details about any of them except for a few lines about how they operate. So for example, Crypto ADX 2.0 is based on the ADX indicator, probably for filtering, and RSI and Stochastic indicators. The minimum deposit requirement for this robot is $500. The number 4 on the list with allegedly 226% gain is the Ichimoku Crypto v2. This one is designed for BTC/USD, LTC/USD, and the rest of the major crypto. The trading is guided by 4 indicators, including the Ichimoku, and based on the trend breakout strategy.

All of the robots have the robot demo mode. This demo mode is fake and is just another manipulation step. Once the demo is run, the animation will show some sliders on various currency pairs to move, and below a balance, the chart will show how the robot is opening and closing trades in profit. The demo animation will last for a few seconds and always show some profit. The chat representative confirmed with us that this is just an animation, which was unexpected. You will also have an option to create your custom robot based on the MACD, RSI, Stochastic, RSI, ADX, and Aroon indicator. All of the indicators have timeframe settings of 5, 15, and 30 minutes. You can select which ones are used and on which trading asset. There is the option to save this robot although all this is probably just a gimmick like the rest of the website.

Service Cost

Interestingly, the authors described the Ichimoku indicator as “created in Japan and has been under-estimated by traders in the West due to the lack of guidance on how to actually use it”. Of course, this is a manipulation line targeted at beginners that could be scared away by the somewhat complex Ichimoku indicator looks. The minimum deposit requirement for this robot is $250. The rest of the robots have interesting strategies. The number 5 on the list, HP cycles robot is described to work on the momentum strategy using the Hodrick and Prescott cycles.

Conclusion

A few words about the DaxBase broker you will be registered with, in case you really want to open an account with this robot service. This is an unregulated, offshore CFD broker owned by Finance Group Corp. (FCG). This group is known for many scam reports and is blacklisted by many state official bodies such as the French AMF, FMA of New Zealand, etc. Whatsmore, the group owns many more binary options and CFD brokerage brands that serve as the sales network for the same shady company. DaxRobot is just another sales funnel that uses automated trading popularity to lure beginner traders.

This Forex service can be found at the following web address: https://www.daxrobot.com

Categories
Forex Service Review

Candlestick Patterns All Pairs Indicator Review

Candlestick Patterns All Pair is an indicator developed for automatic pattern recognition and plotting them on the MetaTrader 4 chart. The tool belongs to the paid category on the MQL5 market and is developed by Denis Luchinkin from Russia. He has over 20 published products but without notable popularity or ratings. This tool is published on the 23rd of March 2017 and has not been updated since. The candle patterns are used as predictive signals and could be reversal, trend, and sometimes scalp strategy elements.

Overview

This tool has a single purpose and this is the automatic plotting so you do not have to search for the pattern. 29 patterns are included in the database for recognition applicable to all forex currency pairs and timeframes. Notable features are the 5 additional settings for instruments, plots an arrow so you will know if the pattern is bearish or bullish, each pattern can be disabled if you consider it unreliable and has a handy table which shows the last patterns on all 28 major currency pairs and timeframes. This way the table will show traders what are the latest opportunities and possible Price Action movements. If you want to hide the table it is done with a click of a button.

The tool is simple and does the job well, the patterns are correct and precise. If you want to search more history you can set the candle values in the settings. Timeframes can also be turned off or on so you can have only 1H and 4H timeframes available, for example. Some visual settings are also optional like the text size, color, and so on. The patterns included are mostly common and considered as reliable although some may be missing such as Double through, still, some of them may be visible only on higher timeframes. The database contains Advance Bloc, Belt Hold Line, Counterattack Lines, and others that are not that used, then the Dark Cloud Cover, Doji, Engulfing, Evening Star, Gap, hanging Man, and Hammer which are commonly used.

Others patterns are Gravestone Doji, Harami, Inverted Hammer, Long Legged Doji, Mat Hold Pattern, Morning Star, NeckLine, Piercing, Separating Lines, Shooting Star, Side By Side, Stalled Pattern, Tasuki Gap, Three Crows, Three Line Strike, Three Methods, Three White Soldiers, Tweezer, and Upside Gap Two Crows. Once you pull in the indicator you will see the pattern and the name with the accompanying arrow depending if the pattern is bullish or bearish. The “Ago” column in the table shows how many candles have passed since the pattern appeared.

Service Cost

The price for the Candlestick Patterns All Pair tool is $25 to buy for 100 activations or $10 for a 3-month rental. A demo is available as the MT4 automatic install if you are registered in the MQL5 market.

Conclusion

The ratings are absent and a few comments are suggesting this tool is not popular. In the comments we have noted several users asking for alerts and other updates but the official update has not been released since. So, the developer may have abandoned this tool. If you are a fan of patterns, you could find other indicators such as this one for automatic plotting for free, although the price of $25 is not too much. Since the demo is offered, you will know if Candlestick Patterns All Pair works.

This Forex service can be found at the following web address: https://www.mql5.com/en/market/product/21853

Categories
Forex Service Review

BlueDigitsFx Spike And Strike Reversal Review

BlueDigitsFx Spike And Strike Reversal is a composite indicator for the MetaTrader 4 platform developed by Ziggy Janssen. This MQL5 repository developer is the owner of 6 published products with solid ratings and popularity. The indicator, as the name suggests, is a reversal strategy signal provider in the paid category. It is also aimed to filter fake reversal signals from the market using another module integrated. The overall quality is great and could be a good addition for traders relying on reversals, provided they have some additional tools. BlueDigitsFx Spike And Strike Reversal was published on 12th November 2019 and has not been updated ever since. Still, it does not mean it does not have the support, it is just a few months old but already has received some attention.

Overview

Two modules are integrated into this indicator. One has multiple indicators, aggregating the reversal confirmation signal. Essentially, it is a prediction indicator, not to be confused with confirmation indicators that lag. The second is the oscillator based on which the arrows are made for trade entries. One important fact about this indicator, it is repainting and this issue has been reported by some users. The repainting issue is not always a bad thing, to some traders’ philosophy, the market conditions can change and thus the signal also changed, the indicator has changed its “mind” as a real person would.

However, the problem lies that you will not have valid measurements when backtesting as that historical false signal before the indicator changed is not recorded on the chart. Repainting may mean the indicator never misses and is always positive on the outcome. Some additional indicators that lag and confirm the signal are essential for repainting indicators, and such case is also with the BlueDigitsFx Spike And Strike Reversal. Bollinger Bands are also used judged by the settings, although just for the channeling.

The main features of this reversal indicators are easy to follow signals, you will basically have arrows for sell and buy, cannot get more simple than that. It has the filtering ability, although we are unable to confirm if this feature is transparent or just integrated, thus decreasing the value of the indicator in conjunction with the trader’s system. Signals are generated on bar close only, works for all symbols and timeframes, has the full alert module with all the features, and is compatible with EA development. The features are not packed with redundant content, which signals the author is authentic with the approach, not a salesman. Similarly, clear content is about the usage guide. The trade entry signal revolves around the -6 and +6 value of the swing. Take Profit level is also determined with the swing low and swing high.

The trade exit is naturally evident with another arrow in the opposite direction. All this makes this indicator well rounded up although, note that is should be used as an addition to a system, as the developer also suggests. For best results, other system products by Ziggy Janssen is suggested, but it could be any reversal system. The product is called 1,2,3 system and is published on the MQL5 repository. The timeframe suggested is H1 and above although lower can also be used with less precision, meaning the indicator is not ready-made for scalpers and we are unsure if any setting change can make it so.

Settings are simple, traders will not have much to change here so optimization should be easier although it also limits the optimization scale. Nevertheless, you can change the calculation period, the filter period, the signal method, and the Bolliger Band parameters on the period and deviation.

Service Price

The price of BlueDigitsFx Spike And Strike Reversal is now high, $30 to buy, and $15 to rent for one month. If the MQL5 market is correct, 68 activations are available once you buy, more than enough even if you change your computer every year. A demo is available too.

Conclusion

Based on the reviews, this indicator only received 2 low ratings form users that did not like the repainting fact. Others are very satisfied. One review describes well how the indicator contributed to his trading:

“I don’t usually leave reviews and I’m not a big fan of most indicators, but THIS ONE… Ziggy knocked it out of the park! Don’t use it as a stand-alone indicator, but with price action and weekly pivots, it’s incredible for me. Having alerts to give me a heads up for price reversals, which is how I trade, is a dream come true. Ziggy makes himself exceptionally available and cares about your experience with his indicators…This indicator is exactly what I wanted to keep my charts clean but effective. I’d would give more stars if they were available! Thanks, Ziggy!!”

In our opinion, the indicator should be first understood and tested for repaints yourself. Even if it does, forward demo testing is needed. First of all, it should be assessed if this indicator is synergetic with your system. On the side note, the BlueDigitsFx Easy 1 2 3 System received a perfect rating out of 33 reviews, which is not easy to achieve, it should be considered as a possible system that works with this indicator.

This Forex service can be found at the following web address: https://www.mql5.com/en/market/product/43438

Categories
Forex Service Review

True Direction Oscillator Review

True Direction Oscillator or TDO is a trend gauging oscillator type indicator using a simple but effective formula. The developer is very open and transparent on how the indicator works and the Overview page has professionally made content. TDO has been initially published on the MQL5 market on 23rd November 2015 and since has received many updates. The latest version is v9.1, freshly updated in February this year. The author of this very interesting and popular indicator is Muhammad Al Bermaui from Egypt, showing great dedication to support his work.

Overview

The latest updates include optimization of the code and buffers, making the indicator require fewer computer resources and some additional ease of use and visual enhancements. The number of reviews and comments is great, making this indicator one of the most popular on the MQL5 market. It belongs to the paid category although the price is not high, especially for a quality indicator.

TDO is an enhanced momentum indicator based on the Price Rate of Change (ROC) except the formula is improved to work equally on bullish and bearish momentum. Therefore, the formula is disclosed as:

  • Center = (A + B) / 2
  • TDO = 100 x (A – B) / Center, where A and B are price levels

For trend traders, TDO is a great addition. Based on the presentation, the indicator is universal, using the formula on every trading instrument is valid. The timeframe is also universal, thus it can also be used in certain scalping strategies and has a good way of having an exit signal, not just rend confirmation. TDO will draw an arrow on the chart once the trend is confirmed, and does this based on 5 different TDO periods alignment in the same direction, bullish or bearish. This is done to prevent false zero-cross signals as per developer words. Additionally, TDO is confirmed to be non-repainting.

To facilitate with Take Profit and Stop Loss management, TDO features a panel with buttons to turn on the Linear Regression channel or Standard Deviation channel, giving the traders precise levels for this purpose using one of the best mathematical methods for measuring volatility highs and downs. Also, you can add Grid levels (rounded up price) and the automatic Support and Resistance plotting on the chart. A well rounded up solution for those using the Price Action strategies.

The developer has a very neat “table of contents” providing the readers a link to the TDO demo, User Manual, FAQ, Video library, and an EA development guide on the TDO indicator. All of the guides are clear and well written. TDO is simple to trade, an arrow will point and confirm the trend, the arrow in another direction could also mean the exit and the appearance of a new trend. Scaling in, or adding a position to already open trade in the same direction, is suggested once the TDO panel lights are aligned.

Of course, you can set alerts when this happens and also on additional parameters so traders will not miss the opportunity. The video provided shows that the indicator has a histogram that draws only once all of the TDO signals are aligned, showing the “True” trend. Using this histogram can also be a good exit or continuation strategy.

Four color palettes are offered in the settings listing and you can also have a quick symbol changer on the chart, allowing traders to have easy switching for all major 28 currency pairs on a single chart window. If 28 currency symbols are not enough, you can add more in the settings using the “;” separator. If you have too many symbols, you can arrange them in custom formation like 3 rows with 10 symbol buttons or similar. Timeframes switching is also designed similarly, right below the symbol buttons with the option to show up to 9 timeframes.

The mentioned channels are also customizable in the settings where you can change values for the calculation period, and also to set the channel as a ray, extending well beyond the last price level for prediction purposes. Grid settings are optional and the same is for the Support and Resistance automatic plotting.

Service Cost

TDO is priced $50 to buy with 1000 activations. Therefore, traders purchasing this indicator will never run out of licenses. Renting is possible for 1 month for $10 and 3 months for $30. A demo is provided but works only on the EUR/SUD pair with full functionalities, a separate link for it is provided. The price for a great trend indicator is never an issue, especially when we see support form the author and extremely good rating.

Conclusion

TDO has a rating of 4.9 out of 388 reviews and has 552 comments to this date. This is hard to achieve, we had to search a while to find bad reviews, we have found one that signals that TDO might be lagging for some:

“These signals are mostly wrong. Not sure what everyone is talking about. The panel constantly changes and the arrows are mostly wrong.”

Out of the good reviews, to the point is the one from bubienok:

“True Direction Oscillator and Bermaui Deviation Percent are perfect for intraday and also trend trading. Excellent work Muhammad.”

TDO is probably one to go for trend or swing traders, it goes very well with other indicators from this developer, but it can also be a great addition to any system.

This Forex service can be found at the following web address: https://www.mql5.com/en/market/product/12914

Categories
Forex Service Review

Virtuoso Expert Advisor Review

This EA is based on several trading algorithms and designed for major currency pairs. It is not known how it works or what is the strategy behind it. What is certain is the absurd price and the extremely low rating raising the question if this is a serious offer after all. The latest version is 2.4 updated in October 2019 with the additions of controlling module that adapts to trading conditions. Also, some new settings are added for better risk management. The initial version is published on 11th June 2019 by the developer Aleksandr Shurgin from Russia.

Overview

Virtuoso overview page on the MQL5 website does not tell much about this EA. It is designed for the MetaTrader 4 platform. I t has the protection form flash crashed and some trailing stop management features. VPS is recommended and some automatic optimization for broker commission and volatility is included in the code. It seems that the generation of the signal is based on the channel strategy although we could not extract more details from the settings.

According to the performance charts and the video, this EA seems to be working on trending major currency pairs on the M5 timeframe. The results and the growth chart is extreme without any dips and extremely low drawdown. They are perfect in a sense it raises suspicion. The backtesting modeling is not the most precise, only 90% is used, and this is not serious for any investor. Drawdown is only 0.75% on the EUR/USD pair for more than 16 months. The winning rate is 92.06% and 68 average consecutive wins. Only 2 consecutive loses on average are made for this period. Similar results are for USD/JPY, GBP/USD, USD/CAD, and AUD/USD on the Tickmill broker servers.

Virtuoso settings parameters are extensive. Users can control the Start and End trading time, control the signal period for several modules, manage volatility filter sensitivity, some additional validators and confirmation indicators usage, lot management, Stop Loss management including trailing Stop Loss, Slippage/Spread filtering and so on. Obviously, the developer does not want to disclose what indicators are used and therefore the settings could prove very difficult to understand, at least the ones related to the “signals”.

Service Cost

The price for Virtuoso is no less the $30,000 to but and $3600 to rent for one year. The first option is probably never intended to be serious. No one should buy an EA that has rating this low and obscured way of function. A demo account is offered and definitely a must given this price.

Conclusion

User reviews are terrible, Visrtuoso has 1 star based on 5 reviews. Unfortunately, this EA will probably never rise to normal levels, it is not even considered for a demo. It is needless to say it is not popular, all of the reviews are bad. The latest one from Joby K:

“Every Day is a LOSS, this Virtuoso is making loss everyday, In backseat, drawdown in a month is 10%, but in real 40% loss per day, this Virtuoso people are making us fool, how to get a refund from Virtuoso, I am not going to trade anymore, I need my subscription cost at-least”.

The deeper has other products with much better ratings but this one is probably abandonware.

This Forex service can be found at the following web address: https://www.mql5.com/en/market/product/35189

Categories
Forex Service Review

EA for Any Levels Indicator Review

Most of the EAs follow a certain method or strategy, but it is uncommon to see an Expert Advisor made for traders to make their custom automated trading system. EA for Any Levels Indicators is such a product published on the MQL5 market. It is coded for the MetaTrader 4 platform and recently published, on the 14th of March 2020. The developer of this EA is Vyacheslav Nekipelov from Russia, selling 16 other products on the same market that do not have much popularity but they are useful and simple. There are no updates to this EA yet but it can certainly be upgraded with many ideas.

The EA can be regarded as a building platform for your system and it is not complicated to set everything up. Of course, there are limitations to what you can achieve, however, there are so many combinations using just the MT4 default indicators. If you are creative, this tool could be the base of everything you do in Forex, and it is affordable too.

Overview

By a level indicator in the name of the EA, it is meant indicators that have measurable levels that can trigger an action for the EA. In most cases, it is to enter a position and execute other directives of the algorithm. For example, one of the indicators can be the RSI for exits or reversal entries. MACD for trend confirmations although for divergence it is not possible to automate. CCI and other line cross indicators are easily implemented.

The Overview page will give you instructions on how to set the EA and the addition of indicators. The file name of the indicators you want to insert has to be typed in the relevant field of the EA setting panel. This string is called “Indicator name”. The indicators folder is ..\MQL4\indicators by default where you can see the exact file name. Indicators that are not by default MT4 installation in this folder can be found online and added to the folder.

These custom indicators can also work with the EA for any levels indicators, they just need to have level cross values for action triggering. Each indicator has its settings such as periods, timeframes, minimum/maximum levels, and so on. These parameters need to be inserted into the EA fields called “Number of indicator parameter” and “Parameter” from 1 to 5. MACD which has 3 parameters ( each the 3 Moving Averages period setting) needs to be filled up. By default MACD setting they are 26, 12, and 9. Once done, you will need to set the levels to trigger Sell and Buy trade entries.

One of the MACD trend confirmation signals is the zero line cross. At this point, the EA will enter the Sell or Buy order depending on the direction of the MA. Since the cross value is 0 at the Zero line, this value is typed in the “Buy level” or “Sell level” field. For the RSI indicator, for example, these levels are 30 for Buy and 60 for Sell since these levels are the default Oversold and Overbought zones of the RSI indicator. The EA does not support levels for the position exists, therefore you will not have a dedicated indicator for this. However, there is an integrated Stop Loss, Take Profit, Trailing Stop, and Breakeven methods for optimized exits. Sometimes the combination of these methods is better than most exit dedicated indicators.

The Stop Loss and Take Profit can be enabled or disabled. If on, you can set a fixed point value for each. Trailing Stop has it’s step parameter and is no different than the classic trailing we have with the MT4. The addition of the Breakeven will allow you to negate any risk you have with a position once it is in profit. The parameter for the profit value is defined in points at which the automatic Breakeven will set the Stop Loss order at the trade entry price. If you want to use the Take Profit distance in currency values, it can also be customized. The settings panel of the EA also has a lot multiplier parameter according to which trades will be multiplied. This is probably the Martingale method of increasing the stakes after each losing trade or maybe some other unexplained EA behavior. Other settings are related to visuals and trade information display on the chart.

Service Cost

EA for Any Levels Indicators cost is $50 and has 10 activations. It is also possible to rent it although if your trading is built on this tool you will probably want to have it permanently. For one month the rent is $15 and for 3 months $30. A demo is available and has been downloaded 41 times till the writing of this review.

Conclusion

The video and the screenshots attached on the Overview page do not disclose any EA backtesting performance. They are merely presenting some of the EA abilities, settings, and guidance. EA for Any Levels Indicators is a platform for the system traders to build with it and the performance depends on many factors. Traders that already have their trading system and want to automate it could try this EA, especially if all of the algorithm rules can be replicated. Overall, the EA is affordable, and will probably stir the imagination of traders of what they can build with it. For now, there are no comments or ratings by the MQL5 community.

This Forex service can be found at the following web address: https://www.mql5.com/en/market/product/47261

Categories
Forex Service Review

Delta EMA Indicator for MT4 Review

EMA or Exponential Moving Average is one of the most used and classic indicators for technical analysis. This indicator measures the difference between the closing candle prices and creates a momentum presented as an EMA in the MetaTrader 4 separate window chart. This idea is not new and is one of the classic ways of measuring momentum. The author made a simple indicator but it is very useful.

Steven Brown from the United States published Delta EMA for MT4 on 14th September 2018, updating it two times just to expand the alert options. The latest version is 1.4 from November 2018. Since the indicator is very simple, there isn’t much room for improvement, adding new functionalities will probably make a new indicator by itself. Still, the indicator belongs to the paid category on the MQL5 market and does not have much popularity.

Overview

The Delta EMA is displayed in a histogram form in a separate indicator window. This histogram will change colors depending on the values of the delta, this way a trader will have an indication if the momentum is suddenly increased. Momentum can be used for trend following strategies, scalping in some cases, and reversals. Trend following is mostly used with momentum crossing the zero line, but adding an overlapping, slower EMA can make the indicator MACD-like and provide another way of trend confirmation. Reversals are signaled by a change of the momentum histogram direction, signaling trend exhaustion and a start of a new one. Note that ranging situations are a bit harder to assess, in these situations the histogram bars are close to the zero line since the change of the price candles is very small.

The best way to filter sideways markets is by adding two horizontal levels to the indicator, creating a range inside which traders should avoid entering trades. Of course, this method would require some testing to find the optimal levels. Scalpers may find the momentum useful as the filter for all trade entries, waiting for the brighter histogram bar for entries in the same direction and quick exits once the momentum starts to diminish on lower timeframes. Our recommendation is to use this indicator in conjunction with other Moving Averages to create custom indicators specialized for a single purpose.

Settings available for this indicator are important, this extends the usability for various strategies and testing. Delta EMA for MT4 has only a few settings. You can change the period for the EMA of the Delta. The more periods, the smoother and slower the histogram will be. Delta factor can also be changed, from 0 to 1 – where the EMA becomes the current delta. The Signal Threshold sets the trigger value for the bright colored histogram bar when the extreme momentum happens. The rest of the settings are related to the alerts and delta printing to the terminal.

According to the author, the default settings of the indicator work well on the H1 timeframe while smaller Signal threshold values are good on lower timeframes. If you want to implement Delta EMA for MT4 into the EA, the Overview page will explain what functions are key to call. Although only users with some coding knowledge would need such information, it is good to see the developer is open for people who want to use this indicator for their EAs. There is only one picture presenting this indicator without any pointers for trading entries, exits, or similar. Beginner traders may find this simple indicator complicated and not obvious on how to use it.

Service Cost

It should not be hard or time-consuming to make this indicator but the price for Delta EMA for MT4 is $30 with 5 activations or $10 to rent for one month. A demo is offered where you can test various combinations or settings before buying. This is not a popular indicator, probably because it is not free, the simplicity of the indicator makes it available on the internet, and there is nothing unique about this one.

Conclusion

The rating is perfect although only based on two reviews. One scalper by the username of rainwalker123, is very satisfied with how the indicator performs on the M1 timeframe. There are no comments published. Steven Brown has 3 other indicators published on the MQL5 market and none of them received any rating, even though they are very interesting.

This Forex service can be found at the following web address: https://www.mql5.com/en/market/product/31721

Categories
Forex Service Review

Big Bang Adaptive Expert Advisor Review

This product does not leave enough information for a trader to understand what kind of Expert Advisor Big Bang MT4 is. Nothing is disclosed about the indicator used or the system, even the settings range does not point to a specific strategy used. However, the EA is new, from April 2020 and probably the Overview page will be updated. The updated version is already out on the MQL5 market, reaching label 1.2. The update contains major improvement, specifically the entry signal is improved and added the filter to only apply strong signals. This way the signals are more reliable although less frequent.

According to the price, it seems developing this EA was not easy. The author is Andrey Barinov from Russia who has the majority of his 14 products range on the market highly-rated and mildly noticed by the trading community. Big Bang MT$ is coded for the MT4 platform but the MT5 version is also published.

Overview

The EA is described as being adaptive, but we are unsure what drives this feature. Anyways, the system is based on the Price Action and Support and Resistance levels. The settings range is modest and this is described as having a powerful combination of simple settings and trading methods. One of the most interesting features it the recovery mode made. This module is made of two algorithms that have a manual control setting but it is not known how the algorithms are working. For the proper functioning of the Recovery Mode, you will need to download all history form the MT4 History Center. Therefore, the EA has calculations on multiple timeframes and probably uses “alignment” on several levels for trend confirmation.

Big Bang MT4 is not quite universal or applicable to any asset. According to the author, default EA settings are optimized for EUR/USD, GBP/USD, EUR/JPY, USD/CAD, AUD/USD, and USD/JPY. However, traders can try to optimize the EA to other assets. In our opinion, the settings panel does not offer enough customization for this purpose. The timeframe seems to be universal though. But it is very important to have history loaded form the History Center in the MT4. For backtesting, the timeframe must be set to M1. If for some reason you need faster modeling in the Strategy Tester, you can use M1 OHLC mode as it will be similar to “Every Tick” mode.

Settings come down to 6 parameters. Lot size setting defines if you want to use dynamic trade lot allocation or fixed lot. This option is a common feature, but this EA does not have Stop Loss or Take Profit levels changeable, they are defined in the code based on an unknown formula. Smart Recovery Aggression is a parameter that defines how risky Recovery Mode will act. This parameter range is from 0 to 1 with the default set to 0.5. It is unknown what this factor is changing in the strategy except it is triggered on drawdown. The next setting enables basket trading for drawdown recovery. This is defined by Max Additional orders clause. Basket trading is a form of Averaging where the sum of all opened trades acts as one aggregated trade.

Risk control is always inversive as the diversification increases, therefore this method of trading is preferable. Note that diversification can be tricky if correlated currency pairs are traded. A spread filter is another common feature in EAs, the one in Big Bang is no different, it will cease opening trades if the spread is higher than the defined value. Hidden Stops is aimed at brokers that could manipulate prices to trigger concentrated regions of Stop Loss orders. The EA using this option will set the Stop Loss in internal memory instead of to the broker server, and thus remain invisible.

The performance chart shows extremely high net profit gains. In a bit longer than 5 year testing on the EUR/USD currency pair, Big Bang MT4 realized over 105 Million based on 1000 initial balance. The lot allocation was 0.1 per 1000 of balance. This was tested on the H1 timeframe, however, we have noticed the rest of the report is missing. We do not know what is the drawdown, the structure of trading, and so on. What is noticeable on the gain chart is the small dips once a trade is lost. We can assume the losing trades are larger than the profit ones and that trades have somewhat equal gains. This could be a sign of a scalper although it is hard to conclude with the lack of information.

Service Cost

The author is certainly not modest about what it comes to pricing. Big Bang MT4 cost is $549 without the option to rent it. You will have 7 activations and a demo available. Interestingly, there is a pricing policy set by the developer, stating that the price will never go down, any discounts or other promotions. Every day the EA is bought the price will rise by $50 until a $1999 is reached.

Conclusion

The product is still new at the time of writing this review and has no comments or reviews left. The demo is downloaded 72 times till now, signaling some interest by the MQL5 community, although the price is probably the biggest barrier. The second one is certainly a presentation devoid of transparency. The best advice is to download the demo and test if you can repeat similar results. Then, forward test on a demo account.

This Forex service can be found at the following web address: https://www.mql5.com/en/market/product/48020

Categories
Forex Service Review

Eagle Scalper Pro Trading Robot Review

Eagle Scalper Pro is a new Expert Advisor published on the MQL5 market that reached significant popularity and user review rating already. The initial version was uploaded on the 10th of February 2020 and has been updated in March to the current 1.50 version. Updates are minor, just bug fixing and FIFO compatibility in case traders have this ordering method imposed by their broker. This EA belongs to the Trend Following strategy category and it is not frequently used the same as the scalper EAs. It does not use the Arbitrage method which is commonly frowned upon by brokers and traders alike.

The developer is Michela Russo from Italy, promotional and sales page is already made on https://tradingforex.pro/ where other products are also sold. The website contains classical sales phrases and no reviews whatsoever. On the MQL5 market, Michela Russo has 19 signals provided by EAs, among which is the Eagle Scalper Pro on the low-risk setting. The other 29 products published by this group have great ratings and quite a high level of user attention.

Overview

The Overview page about this EA designed for the MetaTrader 4 platform does not disclose much about its inner workings, however, two indicators are mentioned based on which the EA makes trade entries. Parabolic SAR and a Moving Average are the base, although the algorithm and filtering do not make it clear when all rules are aligned for an entry. This is especially evident in the youtube video attached. On the page are also some boundling methods notifying readers that if you buy this EA you will get Dragon Scalper Pro EA for free. We have checked this EA to find extremely high ratings and popularity on the MQL5 market.

Eagle Scalper Pro has low tolerance when it comes to execution or server latency, no more than 100ms is allowed. It is mentioned to have slippage resistance although we are not sure why latency and slippage are of high concern for a trend following strategy. In addition to Parabolic SAR and MAindicaotrs, the EA has integrated volatility meter of an unknown kind in conjunction with algorithmic clauses or rules for trend prediction. No pattern type indicators or methods are used. When put to test, the author describes that the EA has a high tolerance for unpredictable market events. This probably means it is not trading on volatility spikes.

Optimized currency pairs are EUR/USD, EUR/GBP, AUD/USD, and USD/CHF however, traders can test and optimize for other assets, the settings options are wide enough for various application testing. Once you download the EA, it will use the M5 timeframe and settings set for the EUR/USD. If you plan to customize the EA to your liking, here is what notable parameters you can adjust:

-Auto lot or fixed lot allocation, based on the account balance and risk defined as a percentage.

-Spread allowance filter, the maximum allowed for trade entry.

-Parabolic SAR settings such as the step, the maximum value of the indicator, price crossing SAR logic, reverse rules switch, SAR timeframe, and SAR exit rule on the opposite signal.

Moving Average settings, including the first and the second. Traders can select the MA type, periods for both MAs, and the MA indicator on/off switch.

-Algorithmic crossing rule that is probably meant for the Moving Averages crossing.

-Several settings for the EA working time customization such as the fixed start hour, close positions of Friday night, or when trading time is over, etc.

https://youtu.be/kjrbHD92-OI

-FIFO mode switch in case your broker imposes this rule.

-Max orders number.

-Enable only Buy, Sell, or both direction orders.

-Fixed Take Profit and Stop Loss orders.

-Several Bar counting logic and other variables that affect trades management.

-Trailing stop feature based on averaging and conditions to trigger only on profitable trades.

-Some color customization options.

Once you insert the EA to the MetaTrader 4 chart, Parabolic SAR, moving averages and buttons to close Buy, Sell and All orders will appear. Based on this you will be able to better gauge the settings optimization changes when testing. The performance screenshots show impressive results. Eagle Scalper Pro is backtested on the AUD/USD according to screenshots, using 99.90% modeling quality and M5 timeframe during the roughly 2 year period from 2018 to 2020. The main traits of this EA are high success rate, low drawdown, and a large number of consecutive wins. Maximal drawdown is just 6.24% while profit trades count for 91.92% of all opened. The average profit trade is 79.13 versus -219.3 average losing trade.

The final line is 42k net profit on a 1k deposit for this tested period. Now, statistics on the developer signal page for this EA using a low-risk setting, which is uploaded in the Comments section, is calculated for a short period, just 8 weeks, although they are fresh from 2020. During this p[eriod the EA made a 51% gain. 91.8% profit trades and 17.1% drawdown on the same AUD/USD currency pair. The growth chart has obvious dips specific for a deep Stop Loss levels that tolerate price reversals, which happen in 8.2% of cases and trigger a Stop Loss. 52 trades are made per week on average that are held for 6 hours. The best trade is $4.63 while the worst is $-15.85. On some occasions we have noticed that the video is showing Martingale’s behavior, increasing the risk after a losing trade. This is probably based on the high consecutive wins vs losses ratio, however, this info is not confirmed.

Service Cost

The price for Eagle Scalper Pro is $135 with 290 activations on the MT4 available. You can also rent it for $85 for 1 month, or $110 for one year. A demo is offered although there is a lite version of this EA for free.

Conclusion

Users seem to like products by this developer and such is the case with Eagle Scalper Pro too. Users rated this EA with the perfect 5 stars based on 12 votes. 12 reviews left although none of them give any details about the EA performance, just expressing satisfaction. As mentioned, you will also receive another paid EA for free that has great ratings, making this offer very attractive. Since optimizing and testing are supported bu great settings options, demo downloading is recommended before buying.

This Forex service can be found at the following web address: https://www.mql5.com/en/market/product/46147

Categories
Forex Service Review

Dolphin Grid Expert Advisor Review

This EA belongs to the Grid strategies with integrated averaging. It is developed for the MetaTrader 4 platform by Sergey Kruglov from Russia. The initial version was published on 6th February 2017 on the MQL5 market set in the paid category. It is updated once in late 2017 adding a few functional averaging parameters such as Averaging Point, Averaging Take Profit points, and Auto Averaging. Sergey Kruglov has 26 other products on the market but none of them have any notable ratings or popularity. He seems to develop mostly Grid-based EAs.

Overview

Averaging is a knows method that aims to cut the cost by opening new positions in the same direction as the trend generates losses. The logic is when the trend reverses a trader will have a lower average price entry that the initial and therefore have a shorter range to breakeven. It is also assumed there is an increasing probability of trend reversing as it is breaking through key price points. Dolphin EA Grid strategy seems to be a classical one, orders are located and separated at specific points. The Overview page does not mention a single feature or formula that could make it easier for the trader to understand how the EA works. One fact is certain, the EA does not have Stop Loss orders, only Take Profit. Since the averaging is used instead, Stop Loss orders do not have a logical purpose here.

Dolphin EA does not have any specific currency pairs or timeframes it excels in. Therefore, results could vary from extremely high losses to profits. The performance measuring will give you a lot to tinker with, even it is completely unknown what filters and indicators are used, several key settings are affecting the final result. Filter setting, for example, defines the range in points from the average. Then the mentioned averaging parameters that were introduced with the final version 2.0.

Based on other settings such as StopIf, Dolphin EA does have a sort of Risk Management, using the drawdown percentage. This setting will define the maximum drawdown level beyond which no more orders will be opened. Customizable MaxSpread filter is implemented so you can avoid news events or other high volatility moments. Money Management ability is defined by the AutoLot setting that defines the currency balance amount at which the EA will open 0.01 lot. It is simple, does not account for the volatility.

The performance screenshots show great results, expectedly, but there are some important figures. There are 2 screenshots based on the H1 timeframe on the EUR/USD pair calculated for every tick for approximately one year. The difference between the two is only in the settings presented and very different results, although both are profitable. The better performing test had Filter, AutoLot, and AutoTakeProfit defined while the other test had fixed lot management and other setting off. Modeling quality is 90%, Maximal Drawdown is a very high 45.39%. Dolphin EA also has a very high number of profit trades 96.89% but as it uses a high-risk strategy, the average losing trade is -2838 and average profit trade is five times lower 582. The final result is a fivefold gain relative to the initial deposit.

Service Cost

Dolphin EA has a published signal link in the comments page but it has been shut down, most likely because of the much different performance in real-time. However, the p[rice of this EA is only $40 with 5 activations and no option to rent. A demo is offered and has been downloaded only 149 times, meaning the popularity is low.

Conclusion

There are no comments left by users except by the author himself. Dolphin EA is unlikely to achieve the results published, as with most EAs, serious testing in real-time is needed and the author has not presented this on any benchmarking sites. There are more interesting EAs with more transparent results and descriptions.

This Forex service can be found at the following web address: https://www.mql5.com/en/market/product/20697

Categories
Forex Service Review

BBMA Dashboard Indicator Review

If you are familiar with the BBMA trading system, then this indicator or tool is the perfect addon. It is a specialized tool but can also be considered a complete trading system. It consists of multiple indicators designed for this algorithm trading. BBMA system is made by Mr. Oma Ally and the BBMA Dashboard tool is published by Alireza Yadegar from Iran. The system is relatively new, from mid-2016, and the tool soon followed a release on the MQL5 market, for the MetaTrader 4 platform. The developer regularly updates it, adding new functionalities, settings, design, and fixes.

The latest version is 6.1 updated in April 2020. The system and the tool already have some attention from the market. Alireza Yadegar has 9 other products that have similarities with this strategy, also some free and useful tools. BBMA Dashboard is in the paid indicators category although it is affordable considering it Is a complete system.

Overview

BBMA Dashboard has all the elements of the trading system, introducing the dashboard, alerts, and other features. The Overview page does not fully explain the system logic, just how the use the Dashboard. It is also useable by traders that have similar systems or just for having an overview of trading opportunities. Essentially, the system uses the Bolinger Bands indicator, Moving Averages types, and the rest of Money and Risk Management methods defined by the Stop Loss, Take Profit, and indicators. All of the elements can be customized, Moving Averages can be transformed into other types, not just the WMA (Weighted MA), EMA or SMA.

The system is a mix of Moving Averages, on multiple timeframes inside the Bollinger Bands channel. The signals are defined on the crosses, candle crosses, slopes, and other factors. Combining higher and lower timeframes a signal can be aligned, increasing its validity. At some points, the system is following reversals, breakout, and trend following strategies. Scalping is not suggested although it is not evident as inappropriate. On the contrary, scalping is possible with the latest edition that introduces MACD and Stochastic filter, allowing traders to scalp on reentry The Dashboard will show an alert when the WMAs are touching, when the candle is closing outside of Bollinger Bands, when the WMA5 is outside the Bands, and other aspects and rules of the BBMA system.

Having multi-timeframe signals will be essential therefore they are represented as green and red boxes for each timeframe and asset. A gray box means there is no signal, probably means the market is ranging or the price is in between the Moving Averages. The Dashboard is customizable, traders can select what asset will display, or use the automatic mode. Keyboard interaction is supported, also right-click context menus, making the Dashboard interactive and easy to use. Visually the frame of the Dashboard is adjustable by Y and X-axis, also the font, box dimensions, colors, and so on.

In the settings panel, traders have complete freedom. The main functional option is to select what kind of method or algorithm will be sued, as there are many combinations, from “Reentry” to “CSAK” (standing for closing candle beyond Middle Bollinger Band signal). Since the system has many elements, traders will have to find what method they find most appropriate to their trading style. Some of the options listed in the Overview page are Pip distance between the MA for the signal trigger, mid-Bollinger Band level filter, the latest Stochastic and MACD filter, and many alert clauses.

Service Cost

The BBMA Dashboard is specialized for the system that is commercialized by the inventor, that has presentations and classes in Malaysia. The system is easily assembled and the MT4 template can be found online. The Dashboard tool cost on the MQL5 market, however, is $80 with 5 activations, and $40 to rent for 3 months.

Conclusion

A demo is available will all the features on the demo accounts, so you can explore all the features. There are 2 reviews total until version 6.1, giving the tool a perfect rating. The reviews do not say much about the experiences with the Dashboard, but from other sources, we have found many positive remarks. The developer is very supportive as can be seen in the comments section, providing users with directions. He also has a telegram group for contact. If you are a BBMA system follower, the BBMA Dashboard is a must.

This Forex service can be found at the following web address: https://www.mql5.com/en/market/product/41366

Categories
Forex Service Review

Elliot Wave Indicator Review

Traders familiar with Elliot Waves know there are a few elements that need to be determined before executing a trade. This indicator is developed with the idea to trade towards the 5th Elliot Wave in conjunction with other indicators, as a part of the “Trade The Fifth” swing strategy. This is a commercialized product also published in the MQL5 market for the MetaTrader 4 platform. Other platforms are supported but on the owner’s website. The developer is Paul Bratby from Spain who is the presenter of this swing strategy using Elliot Waves, publishing one more product related to this group strategy ideas. The first version is published on 13th December 2019 and has never been updated to date. Elliot Wave Indicator belongs to the paid category but it is not available to buy, this is a subscription-based service with several options.

Overview

The author has not described this system, although there is a video on how to trade and about some of the system components’ roles. However, it is not enough for you to start away with trading and there is no guide. You will need to acquaint yourself with the Elliot Wave theory trading, or, if you are familiar, you will need to understand how the oscillators, zones, and Moving Averages are used. All these additional indicators are integrated into this product. For all the info you will probably need to dig the internet or subscribe to the service. We have a feeling the Overview page is deliberately devoid of any guidance to push for the sales.

Swing trading based on fractals, patterns, and Moving Averages is the core of this indicator-system. The features presented are also pointing out to some reversal and Price Action trading elements, such as the Pull Back Zones, and concentrated price levels. Elliot Wave Indicator has automatic Elliot Wave counting, meaning a trader will not have a subjective interpretation as the indicator automatically recognizes and plots the count. Elliot Wave theory is highly subjective, the waves can be smaller to some and bigger to others, it is a matter of perspective, hence even two traders use the same strategy, the results can be very different. This indicator removes this factor and will be the same. Pull Back zones are the reversal elements of this system using unknown formulas to plot them on the chart. They are colored probably relative to the probability calculations.

The oscillators are customized with additional markings that signal important trading conditions according to which traders may see false breakouts or the right setup to entry and even exit. For example, the Stochastic oscillator has yellow dots in the extreme value range that indicate a strong momentum of the trend and a real breakout. One more oscillator is implemented for confirmation called 5-35 Oscillator. As for the Moving Averages, it is not disclosed what are the settings for these MAs, although based on the screenshots they are forming a narrow channel and have the trend baseline function. This channel does not cover the price tops and bottom levels, it acts just as the ranging filter and trend confirmation.

The video is well narrated and explains a bit about the logic of the strategy but teases by not disclosing enough information to comfortably apply the system. Training is mentioned where you could learn more, of course, if you subscribe to the service. It is difficult to assess how successful this system is, the author does not have a signal offered on the MQL5 with this system or their website where we could confirm the performance. Still, the system does not rely only on the Elliot Waves, it is combining other indicators and, additionally, the Take Profit and Stop Loss levels. These levels are set according to the Target Zone plotted on the chart and tops of the MA channel, for example. Where exactly they are put is not disclosed, but experienced traders can effectively find the right for them regardless.

Service Cost

Users that subscribe to the service will receive additional support, videos, webinars, and the 3 hour Bootcamp where the system is presented fully. The price can be an issue to some as the 1-year subscription is $499. There is no option to buy permanently. Optionally, you can rent for 1 month costing $55, 3 months for $159, and 6 months for $299. There are no reviews still, although the product is relatively new on the scene. A demo is offered and has been downloaded 56 times to date, showing low popularity.

Conclusion

The Comments section is empty. Overall, the Elliot Wave Indicator system is specialized for the followers of the Trade The Fifth group, which may play a major role in why the system is not known on the scene. It is also expensive without any proof of results the group is having. Advanced traders usually do not seek complete trading systems. Elliot Wave strategies follow the concept but it is best to structurally find the right indicators and build your own.

This Forex service can be found at the following web address: https://www.mql5.com/en/market/product/44034

Categories
Forex Service Review

England’s GBP Expert Advisor Review

Eng GBP is a modest product by a Kuwait developer using a breakout strategy with Fibonacci levels. This Expert Advisor for the MetaTrader 4 is new, published on the 5th of April 2020 on the MQL5 market. It has no updates yet although it is evident Ahmad Alsaegh, the author of Eng GBP, is still testing new settings and uploads them in the Comments section. He has one other product also specialized for certain Indicies, using a similar breakout strategy. Eng GBP, as the name applies, is specialized for the GBP/USD currency pair although the author states it is suitable for all currency pairs. The Overview page does not have enough information about how the EA is working or anything about the set of indicators aside Fibonacci. According to the settings, it is clear additional Risk management tools are integrated.

Overview

Eng GBP is presented as having a combination of breakout strategies used with the Fibonacci levels, probably for breakout confirmations. It has been tested in different environments and has similar results, meaning it could be a universal system. However, the author is suggesting an H4 timeframe for calculation and H1 for trading. These timeframes can be modified in the settings. The higher timeframe is used for better reliability of signals while H1 could be more precise when entering a breakout. GBP has usually a higher ATR value than other currencies and the moving nature is more suitable for this EA as there are more breakouts with good momentum.

VPS is highly recommended although since the EA is not trading frequently during a day, it is not for the trading cost reasons but about having 24/7 access to the market without interruption. Shutting down the EA or the MT4 is not advisable as the information EA gathers when it is on will be purged, affecting the final performance. Eng GBP has an Auto lot mechanism based on the Equity percentage risk per trade or fixed trade size allocation.

As for the setting range, they are not revealing what indicators are used but there is enough room for customization and optimization most traders will need. Combining just two of the key setting will generate many combinations of how the EA can be applied. The EA has a feature for placing Market or Limit orders, meaning pending orders can act as a safety guard and trigger a trade only if the price level is reached. However, we are unsure how Limit orders can be useful for breakouts, they are more suitable for “buying the dips” or reversals than for following a breakout trend. Anyways, this could be a conflicting logic but the final result and other stats are what matters.

The setting that defines how sensitive the EA is and therefore affecting the frequency of trading is the Minimum & Maximum range to trade. This range is most likely connected to the reversal indicators used to detect a breakout. Higher levels will likely result in less frequent trades. The Entry ratio is the Fibonacci level to be used once a breakout is manifested. A trade will be set at this level. Eng GBP has Take Profit and Stop Loss orders integration, although they are also connected to the Fibonacci levels.

You will have to set at which Fibonacci level you want your Take Profit and Stop Loss orders to be placed at once a trade is executed. The setting line for these is called SL Ratio and TP Ratio. One Trade Per Day clause is used if you want to limit the EA trading, the implementation of such an option is probably to stop the EA entering a streak of losses caused by the market environment specific for that day.

Additional safety measure is the Trade Cancelation in circumstances the price does not follow the predicted direction, defined in percentage of the Fibonacci ratio. This ration can also be defined in the Cancel Ratio setting. Stop Loss management is not basic, the EA features a breakeven method praised by traders who keep attention to Risk Management. This concept will move the Stop Loss level to the trade entry price after Take Profit is reached, in the case of Eng GBP, this is a Fibonacci level customizable in the settings panel.

The final measure for greater reliability is the moving Average use for trend confirmation. As Moving averages are lagging indicators, they will probably cause the entry to be later than without it. In testing, this could affect the net profit result and a trader should assess if the Moving Average is negating some of the losing trades or it does more harm than good.

Service Price

The price for this Eng GBP is $39 for one month. At the moment there is no option to buy the product, only to rent it every month. A demo is offered and has been downloaded 22 times since release. If you plan to test this EA, be sure to download the configuration settings file uploaded by the author in the comments section. According to the results, this EA uses a solid strategy, even ambiguous, it could be worth your time to test it.

Conclusion

The performance chart attached to the Overview page suggests that the strategy tester was done on the GBP/USD pair, using H1 timeframe and during roughly one year period from 2019 till today. The test shows a lot of errors although the modeling is done for every tick. Note that the Moving Average filter was used in testing. Starting from the Maximal drawdown, the EA caused a very low 6.99%, which is very attractive to cautious traders.

The trade success rate is 76.12%, average profit trade is 7590 versus -6700 average loss trade, and making 4 consecutive wins on 1 loss. All this points to a good Money Management, combining low drawdown with constant gain without high exposure. The EA ended the test with 559765 net profit out of 500 initial balance. During the testing period, a total of 134 trades were made, meaning the EA is not for the impatient.

This Forex service can be found at the following web address: https://www.mql5.com/en/market/product/48073

Categories
Forex Service Review

Brazil System Premium EA Review

This is one of the most popular Expert Advisors that implement the Grid and the Martingale methods without using any indicators. Brazil System Premium is designed for the MetaTrader 4 platform and published on the MQL market in the paid category. This EA appeared on 11th October 2016 and has been updated many times, finalizing with version 13.0 from the 6th of April 2020. The updates contained bugfixes, additional functionalities, and optimizations.

The author of this product is Ramil Minniakhmetov, a well-known developer among the MQL5 community releasing 12 products and having 6 signal services. We are no sure if the review incentive by the author’s promise of free products is resulting in this high popularity, however, this kind of trading belongs more to the betting category than it is something analysts will think about using.

Overview

The base of the EA is not about predicting where the price will move, but about the mathematical construct that can generate profits, although not in the long term. Interestingly, the EA starts trading by opening opposite trade directions. Once Take Profit order gets hit by one trade, the process is repeated with an increased lot size. Finally, the trade sizes will stop increasing once the maximum Locked Orders are reached. It seems the nemesis of the system is the forex news. News Stop Trading module is therefore integrated that just suspends trading during this time. This process is fully automated once you plug in the news feedback links, as instructed by the authors on the Overview page. A guide for the Brasil System Premium is uploaded in the comments section. Optimal currency pairs are EUR/USD, USD/CHF, and NZD/USD set on the H1 timeframe. The minimum deposit is $3000 or 3000 cents if you use Cent accounts.

In the settings panel, you will see some parameters even though there are no indicators to adjust. Brazil System features Auto lot management dependant on the deposit or balance size. Lot multiplier is the key factor for trade size enlargements during the chain orders opening. A Trailing Stop is integrated, although there are no advanced calculations, just the fixed distance. Take Profit and Stop Loss are present so no trade will remain without maximum drawdown. New Cycle setting will enable the EA to work without limit and open new trades, while disabled limits the EA to a number trade series. Imp1DRAW settings are meant for the news websites that feed the EA when to stop trading. Once you plug in the EA you will see the panel on the chart showing main and news related settings currently applied.

The signal service which presented Brazil System Premium performance is disabled. The manual warns that at least 1 in 3 attempts to use the system will result in an account wipeout. It is recommended to use a broker with low spreads as the EA opens a high number of trades in a short time. The aggressive approach could generate 300 to 1000% gain per month. 30% of the weekly profit should be withdrawn until the initial deposit amount. Afterward, 10% of profits should be pulled out.

Some manual intervention can be of benefit once the EA enters a drawdown. If this happens the author suggests setting New Cycle setting to false for all pairs with drawdown, set Max Lock order to limit to 2 and the EA will close trades ASAP. To better manage risk, traders should not increase lots with growth, instead apply the Brasil Syste, to more currency pairs. Finally, since the system is not profitable in the long term, extreme utilization of the system in a short time could be the best approach for some traders who like to bet. In such conditions, Brazil System Premium could generate extreme gains, like 7500% in 12 weeks.

Service Cost

The Brazil System Premium has a price tag of $30 without any ability to rent it. A demo is offered and has been downloaded 8616 times. This price is in the low range, and since the system is unique with very high gain possibilities, it is worth the fun.

Conclusion

Many get-rich-quick traders will be attracted to this product, which can be seen by 180 reviews left, averaging 4.5 stars rating. One of the notable recent reviews states: “Fully martingale method with many parameters to set based on your risk appetite. Working great if you use proper money management. Ideally, $3000/currency pair for 0.01 lot to avoid a margin call.” Note that this EA should not be considered seriously if you plan to invest in trading.

This Forex service can be found at the following web address: https://www.mql5.com/en/market/product/18602

Categories
Forex Service Review

Advanced Price Movement Predictor Pro Edition MT4 Review

Given by the name one could think this indicator uses candle patterns or other non-lagging methods to predict trends. However, this is not true, this is a combo indicator for the trend following strategies using Price Action methodology. It is developed for the MetaTrader 4 client by Boris Armenteros from Spain, as the leader of the Barmenteros team. This team has some trading and coding experience having at least 15 products released on the MQL5 market. Advanced Price Movement Predictor is initially published in January 2014, however, it is not updated frequently.

The latest update was in September 2014 having a few minor fixes and alert additions. Note that this does not mean the product has lost support, the Comments section shows the latest activity in 2019 and the team has published ForexFactory thread for this indicator. This is a paid indicator with multiple formulas incorporated making it almost a complete trading system.

Overview

The service’s overview page does not tell much about the indicator formulas, it is mostly made as a guide for the less knowledgeable, with mild marketing elements. Shortly put, the author describes it as a short-term price movement analysis tool based on advanced math. By looking at the features list we have noted some key points. Support and Resistance levels are heavily used and that the indicator is self-adjusting making it universal for any timeframe and market. Again, the author is using vague descriptions highlighting complex calculations, advanced math, statistics, and probabilities.

The result users will see is simple. The indicator’s info panel will display if the trend is Up, Down or Flat. Therefore, even this is not highlighted in the Overview page, flat markets are detected also and, of course, useful for trend-following traders as these market conditions are unfavorable for them. Another feature of APMP is the automatic chart recognition of the Support and Resistance levels. These levels are displayed on the indicator panel also using the higher timeframes. If these levels overlap, the indicator will see it as the congestion point and more reliable level.

It is also possible APMP uses the Fibonacci levels as it is one of the most popular Price Action indicators. Stop Loss level can be placed in between the Support or Resistance points, as the author suggests, or in our opinion, another indicator should be used for this purpose, such as the ATR. A trailing stop is also one of the options for the trade exit. APMP is not designed to indicate the trade exit, so additional indicators should be added to the system. The info panel will display designated colored boxes for each timeframe, signaling the trader if there are any trends there. Traders can decide and create their own rules for entry or exit based on this.

Some users report that the indicator may use a linear regression method for trends among others. Since the linear regression channel can be extrapolated to show the estimated or predicted price movement domain, this may be the reason for the indicator name. However, the indicator can be measured in the MT4 tester, just note that the results do not account for the Support and Resistance levels. Doing this manually can also be a problem given the fact these levels are drawn in real-time and updated without a stamp on the chart. On the other hand, this indicator is EA friendly, so a part of his functionality can be tested if it is integrated into the EA.

Service Price

Advanced Price Movement Predictor Pro Edition price is $50 and provided with 5 activations. Interestingly, on the developer team website,m this indicator is $60 with several other versions for $45. They are all also available for the MT5 platform. Some features for this cheaper version are excluded such as “Intelligent finding of congestion zones”, “Price movement prediction of ALL timeframes” and similar. There is no possibility to rent this indicator and the demo should be downloaded for the barmenteros.com website instead of the MQL5.

Conclusion

User ratings show an average score of 3.8 stars based on 8 reviews. This is not great although we could not find any helpful bad review except one from Haki1215: “not good to use, I just use MACD Stoch ADX MA to trade much better.” APMP popularity is not low considering more than 140 comments left, however, user reviews are not good enough to boost it to stage. This is probably a great indicator for beginner trend following traders since sideways filter is integrated with the rest of fundamental factors. Experienced traders usually avoid such indicators where exact formulas are not disclosed.

This Forex service can be found at the following web address: https://www.mql5.com/en/market/product/2732

Categories
Forex Service Review

Buy Sell Professional Lighter EA Review

This is a free version of the BuySellProf Lighter Expert Advisor published by the same author and is designed to be for demonstration purposes. Interestingly, there is also a BuySellProf EA that has some more elements but BuySellProf lighter has a lighter price. The EAs are designed for the MetaTrader 4 platform and they are published on the MQL5 market. It is great to see the author is transparent about the EA functioning even though the indicators are not disclosed. There are guides for the settings and how to test the EA on the Overview page.

Overview

The developer of this EA is Yurij Batura from Ukraine, who is also the publisher of 18 other products on the MQL5. Few of them have received some attention from the users except for the full version BuySellProf EA with a perfect score. It is hard to define to which trading category this EA is in as it has several elements and a mixed approach to trading. The current version of the BuySellProf lighter free is 8.9 but know the base EA has been released on the 25th of March 2014. This free demo version is separately launched on the 13th of March 2020.

Right away it is presented that this is a multipurpose EA with interesting strategy, although Martingale is used too. IT is based on a 6 years old strategy that has been updated numerous times. Two methods are used, Locking and Hedging. By locking, the developer is describing a counter position that locks down gains or losses. Harmonic oscillations are also the guidance theory of this EA implying the cyclical nature of forex and other markets. Certainly, the hardest part is finding the right moment and trade it consistently. It seems the EA has good results with trending, high volume markets on the recommended major currency pairs. As this version is free and doubles as a demo, it will only trade a single market.

The trade cycle starts with two simultaneous trades at the defined points. These points are probably volatility or price ranges either calculated by an indicator or using the previous day data. The author does not describe the process correctly but the trades have Stop Loss and Take Profit levels fixed. Once one order is closed by the Take Profit order, the EA will place an opposite order on that position, with the idea of what goes up comes down and vice versa. SO in a way the EA is also a reversal strategy with specific elements.

The trades are followed by hedging positions with increased trade size using the Martingale method. This is done in expectancy for a reversal, as the price moves to the extremes, the more trade size will be. Measuring volatility is the key to the trend gauge and counter positioning. It is described that the EA is ada[ptiong to the situation like this, although we are not sure when is the moment of trade becoming too big for the account to handle. Note that with some brokers hedged positions negate your margin but this is not always the case. EA displays some information on the chart with the addition of functions to close all profit orders, unprofitable or all. By looking at the charts, it can also be said the EA uses a kind of Grid method for scaling in, at the Take Profit levels.

Stop Loss can also be using a trailing method. According to the settings panel, it does not have special options and is like the default from the MT4. For measuring the volatility the EA needs multiple timeframes history, so it is recommended to refresh by pressing F2. Some additional warnings are given as this is not the full version and the testing may show different results. One might question why using this EA version after all. However, The EA will work with real accounts, unlike the demo.

The settings panel has a few parameters, tampering with them will change the result but there is no option to adjust the volatility, for example. You can change Take Profit, Stop Loss, fixed lots for this version, and Magic Number. The rest of the parameters are present but are not functional in this version. They are Martinlot – the Martingale multiplier setting, MaxLots – maximum allowable trade size, and use of the Trailing Stop is disabled. Therefore, BuySellProf Lighter free is not a serious product but serves more as an attractor for the main, paid version. It is great to see the developer publishing a very detailed guide on how to test and set up the EA. These blog posts have pictures and explanations for every parameter, although they are made for the full versions.

You will not see the signals published on the MQL5 for this nor the normal BuySellProf EA. Interestingly, there is a screenshot of the gains made although the signal is not available anymore. What is presented in the screenshot slider is the MT4 Strategy Tester results on the GBP/USD pair for the past 20 months. Modeling quality is 90% with the initial 100 balance. The EA made only 48.41% successful trades but note that this strategy does not rely on this but the trade size management when scaling in. Therefore, the average profit must be greater than the average loss trade for this EA to have any meaning, and it is, 1.97 versus -0.62.

Maximum consecutive wins vs losses also do not have any meaning here, they are almost on par. The most important factor is the drawdown, and it is 18.3% according to the screenshot. By looking at the gain graph, the line Is in constant gain but there are noticeable drawdown spikes that many traders would not like since they remind of the Martingale method. The final net profit is 298.28.

Conclusion

There is one review and one comment for this EA, while the original EA has a perfect score out of 3 reviews. Unfortunately, this single review is a negative one stating:

“Very poor results in BT, not recommended.”

Traders should consider two major points about this product, it Is just a demo of the original EA and that the strategy does have risky methods in place.

Categories
Forex Service Review

CSM Currency Strength Meter Indicator Review

Currency Strength meter indicators are interesting to many traders and have many uses, not necessarily to enter new positions. CSM indicator is the work of Aliakbar Kavosi from Iran releasing the first version of CSM in March 2016 for the MetaTrader 4 platform and updated it twice in late 2019, giving the indicator a new code and better symbols integration with various brokers. This author is the owner of 18 published products on the MQL5 market without significant attention from the users. CSM is not free but seems to do other Currency Strength meters do, just with a small deviation.

Overview

This indicator combines two methods of calculation the currency strength, Absolute currency strength (ACS), and Relative currency strength (RCS). CSM is further extended with the option to select symbols on majors or minors with the addition of Bank for International Settlements (BIS) factor. It is not very clear what this factor affects but it is meant to adjust the currency values to represent more valid data. The uses are just as with other meters, traders that rely on line crosses or overbought/oversold ranges can naturally use for reversals or trend confirmation.

On the other hand, it is not for low timeframe scalpers, the data that this indicator is presenting in the window is too messy and unreliable in lower timeframes. Reliability is adequate at H1 and higher. Other uses are just filtering for both trend confirmation or following, for example, enter only sell position for currencies getting weaker or when the currency is in the set oversold range. The zero line can also be a factor for this purpose.

According to the author, this tool is handy when trading the news, if the difference between currencies is above 3 or 30% without the BIS factor, the signal is strong. BIS reporting could be a good addition to this indicator although the real value is expressed on how effectively it can be used. We have noted that the developer may not have extensive experience in trading, some sources on the Relative currency strength (RCS) published on the Overview page is from Wikipedia.org, which is not professional or specialized for Forex, especially for indicators. Providing suck link to the indicator Overview page is not a good sign, the author may lack practice and builds indicators based purely on theories. This fact reflected on the CSM popularity.

CSM will show a histogram and the currency lines chart. The Strength readings vary from 0.0 to 9.0 and are displayed in the right part of the indicator chart, beside each currency. A value of 9.0 is the strongest, and is the BIS factor is not used it will be shown as 100%. They will be automatically sorted to help traders find the strongest one easily. In RCS mode, CMS shows the strength of 8 major forex currencies, while in ACS mode the range is extended to non-majors. The settings panel will allow all this to be set, additionally visuals and toggles for each currency line, etc. CSM code is EA friendly according to the author.

Service Price

The price for this kind of Currency Strenght meter is $30 with 5 activations, 10$ to rent for 1 year and a Demo is available.

Conclusion

Probably the most interesting about this one is the mixed modes, Absolute currency strength (ACS), and Relative currency strength (RCS) with the addition of the BIS filtering factor. How useable is all this is unknown, there are no reviews by the MQL5 users. The two published comments are just not enough. Even if the rest of Aliakbar Kavosi’s products are not popular, it does not mean they do not provide value. It is recommended to try CSM before anything, especially if you are a trend following or reversal trader cautious about the fundamental analysis.

This Forex service can be found at the following web address: https://www.mql5.com/en/market/product/15258

Categories
Forex Service Review

Dragon Wire Forex EA Review

Automated solutions are very popular, robots are dominant actors on the forex market and they are also a good selling product, especially if they have constant results and risk protection. Dragon Wire seems to be a correlation strategy EA made for the MT4 but does not have the risk protection most investors would want. It is published by Marcelo Prestes De Oliveira from Brazil who did not present the EA in English or in a good way.

Overview

The provided service overview page leaves no useful information for traders, most of it is just marketing probably copied from some other website. The seller does not seem to belong to a particular group or a company and has one more product published on the MQL5 market without any notable attention from the MQl5 community. The latest version is 4.1 and it is the initial version published on the 24th of March 2020. There is no updates log. The seller also has two signals published but they do not come from the Dragon Wire EA, so we will have to rely on the screenshots posted on the Overview page.

Reading the presentation will give you the impression of a bad tv commercial for a hard-to-sell product. It is stated you will have gains of 60 to 110% per month guaranteed, it is universal for any timeframe and asset, optimized out of the box, undetectable by the broker, used by thousands, adaptable to market conditions, the official price is $1000 (so this is a copy version?), and so on. Apart from that, this is a pair correlation EA without any mentioned indicators or screenshots on the MT4 chart. Stop Loss and Take Profit are used as a virtual level, which is not visible by the broker server. This means the EA should be on 24/7 and most likely a VPS is preferable.

The seller uploaded 3 screenshots of supposedly Dragon Wire EA, although MT4 Strategy Tester is not used, Just Myfxbook.com account without any links to them. Two of the charts are on demo accounts and one on the real from Fort Financial Services broker. According to this chart, the EA made 55.49% for March 2019. The drawdown is 26.49% based on 4769 initial balance. Daily gain is 1.34% and that is all. We could not see the trading structure. On the demo accounts, the EA is risky, with 75.44% drawdown and 30.09% monthly gain. Interestingly, the EA is cut from operation after a considerable sharp balance drop.

Dragon Pattern in action.

Service Cost

Probably the best part of the Dragon Wire is the price. You would need $70 to purchase and have 5 activations. There are no rental options but you will have a demo free to download.

Conclusion

There are no comments or reviews about this one yet. Considering the low price, it is possible some traders even buy it. At the moment of writing this review, the demo has been downloaded 32 times. There is not a lot of settings you could use to optimize this EA so you can just set at default and test it in MT4. The results you will get will probably be high drawdown EA that eventually busts the account.

This Forex service can be found at the following web address: https://www.mql5.com/en/market/product/47616

Categories
Forex Service Review

Escort FX Expert Advisor Review

Escort is an Expert Advisor designed for the MetaTrader 4 platform and belongs to the trend following strategy type. Even the price of the EA is in the highest on the MQL5 market where it is published, there is very little information provided for it. The developer is Evgeniy Zhdan from Russia who has many products already published (127), also has a book on how to make EA for MT4 sold on Amazon. His EAs bear catchy names and a good part of them are very expensive. None of the products have significant user attention, even though they have great ratings from those that can purchase them.

Overview

The Escort initial version was published recently, in kate March 2020, and has not yet been updated. Note that many developers combine already made trading modules to create different EA combinations, increasing the sales range even though no new code is written. When products do not have much information about them, especially if they have a high price, they cannot be expected to be seriously considered by the community.

Escort EA works on the M5 timeframe which may imply that this is a scalper, but this is not the case. Strong trend movements are detected, probably using a volatility or volume indicator. It is also mentioned that the EA is using the recognition module for trend prediction. Prediction is always involved with the price patterns, be it in the form of fractals or Harmonic Patterns, and is not lagging information. Reversal indicators, most of them are oscillators, RSI is one of the most popular, are the other option for prediction or reversals. They are also not lagging indicators, although they do not foresee to far ahead.

Trend following usually involves Moving Average indicator types and they are lagging, since they need recent information to confirm a trend. Therefore, it is not clear what recognition module the author is talking about on the Overview page, but the EA may be using a pattern recognition module form the developer’s other products. Whatever the case, this is a fast-acting EA that requires a good connection, low spreads, and VPS is recommended. This means you should not expect trades to be held for long, it is probably similar to the scalping method. The author explicitly states that the Escort EA does not use any of the risky strategies like Martingale, Averaging, Grid, etc.

Escort Ea does not apply to any asset, the author recommends GBP/USD, EUR/USD, USD/CAD, EUR/JPY, and GBP/JPY currency pairs. The Risk Management module is implemented and contains the Stop Loss and position tracking, probably exit indicators based on the diminishing volatility. It is not disclosed anything about the methods or indicators used for any of the strategy element Eacort uses, but according to the settings range we can see Trailing Stop customization, classic Take Profit level, and some filtering options.

The complete settings range will now allow you to customize much that it directly affecting the trading strategy, just how “aggressive” it can be. One interesting parameter is Trend strength. This sets when the price move is not considered a noise but an emerging trend. A higher number will make the EA less frequent and will wait for a strong signal. Max Risk parameter defines how much volume each trade carries, relevant to the total account balance. Turing this off will use another clause for fixed lot allocation. Trailing Stop can be enabled and adjusted in pips, so it is probably using the classic trailing method as with the default MT4.

An interesting parameter is called “By trend or against”. It seems the author left this parameter to use the EA as a reversal strategy, although it is not meant to be. It is uncertain if anyone would like to use a very expensive EA for an opposite role. As a side thinking, anyone disappointed with the results of the EA can use the opposite methodology and have a better outcome. It could be regarded as a failure switch the developer left in case the user is not happy with his EA. Other settings are about what is filtered and how much in terms of slippage, spread, and the maximum number of trades.

Performance charts attached to the presentation page shows all currency pairs backtested on the MT4 Strategy Tester. They are tested on the recommended M5 timeframe, from the start of 2019 until Q1 2020. Fro the EUR/USD pair, modeling quality is 90% using every thick and 5% risk setting per trade. The success rate is 90.63% and the Maximal drawdown is 13.2%, while on EUR/JPY pair it climbed to an extreme 47.93%. So the EA does not have consistency in this key figure, even though the Stop Loss setting could be too deep.

However, another key figure puts more stains on this expensive EA. The average profit trade is 926.26 but the average losing trade is -5175.75. The average wining streak ratio is 19 to 1. All this points to a scalping like behavior but note that the EA made just 97 trades for the whole backtesting period. Finally, the EA is very profitable of course, with 65439 profit on the 10000 initial balance.

Service Cost

Escort EA ahs a four-digit price tag of $1945. If you want to try to go with a cheaper option, you can rent it for a year and pay $1760. You will have 30 activations and a demo version offered.

Conclusion

The interest is not high, given all the above, there are no comments by the users and just one review. The user who left the perfect review did not leave any comment. Escort EA is simply not worth the price in our opinion for several reasons. The presentation does not give enough info, the backtesting results involve high risk and inconsistent results, there is no published signal service generated by the EA and simply the price is too high. There are many other automated solutions with great performance, ratings, and are much more affordable.

This Forex service can be found at the following web address: https://www.mql5.com/en/market/product/47642

Categories
Forex Service Review

Fibonacci Retracement Pro EA Review

Fibonacci Levels are one of the basic elements of reversal and breakout strategies, commonly seen among the Price Action traders. Fibonacci Retracement PRO is a paid version of the EA built for the MetaTrader 4 platform. This EA has more features than the base version and has more factoring elements in the whole setup. Interestingly, they are both made in March 2020 and have the same price tag.

Overview

The developer of this EA is Vladimir Gribachev from Ukraine who has an amazing array of products published on the MQL5 market, all of them are either free or sold for $50. A total of 276 products are published, most of them have not received any notice from the MQL5 community. However, the details and the presentation of the products give away a professional developer with a transparent approach and hands-on experience in the Forex. Currently, Vladimir Gribachev seems to be banned by the MQL5 admins, probably because of too many messages. The basic version of this EA has already received a review with a perfect score.

At its core, the EA has the automatic chart plotting of the Fibonacci levels, with customizable parameters in the settings panel. For better controls, several features are added. Traders will have manual control over the trade entries, Fibonacci calculation on the closing prices, RSI filter, and ATR filter. Aside from these indicators, Zig Zag is used for Fibonacci levels calculation.

Zig Zag is known for marking the peaks and bottoms of the historic price movements, according to this the EA will set the Fibonacci range and update is if there are no open positions that use the previous Fibonacci levels. The RSI indicator is probably one of the most used indicators, mostly for reversals. Its role in this strategy is probably to filter price bar crossings of the Fibonacci level that end up as false signals. ATR is a classic indicator of the asset volatility, breaking certain levels can be a signal of a breakout. These breakouts could have binary functions, to close a reversal trade which is most likely to be a loser and to prepare another trade entry in the direction of a breakout trend. ATR can also be used as a calm market filter.

https://youtu.be/6_KUSgLKv0w

The Overview page discloses a few key parameters that greatly affect the Fibonacci Retracement PRO performance. Timeframe FIBO is the logical timeframe setting for the Fibonacci plotting. The Depth parameter defines the number of candles used by the Zig Zag indicator, who in return defines the Fibonacci levels. Higher numbers will be more adequate for “longer-term” trends as the Fibonacci ranges will cover a larger time section. Another factor in this modification is the Deviation, which is used for new price peak and bottoms recognition. The Deviation parameter is also adjustable in percentages, it will affect the Zig Zag and, therefore, Fibonacci levels. The Backstep parameter is another recognition adjustment that defines the minimum distance between two Zig Zag levels, so you would end up with too many in a short-range, usually happening during important news events.

Fibonacci Retracement PRO has other implemented features for Risk and Money Management. Partial closing on first Take Profit level is done using, of course, Fibonacci levels after which a trade is held until a second Take Profit level is reached. Stop Loss is applied in the same manner except moving to break even method is used once first Take Profit is triggered. Moving to breakeven after the first target is hit is one of the most efficient Money Management methods traders use in any strategy.

How much a partial closure will be, and the breakeven moment in pips can be adjusted. This way traders can customize according to their own ideas on how to manage their trades. Additional levels on the Fibonacci can be used for trade entries if set in the settings panel, by default it is at level 1. On the chart, you will also see some statistics.

Settings concerning risk per trade are managed by Risk per trade parameter. Lots parameter is the Auto lot allocation based on the set amount per which the lot will be calculated. From balance is the amount relevant for the Lots allocation. Other settings are related to the working time of the EA, you can set a week start and closing time on Friday where all positions will be closed. If you need to take some notes for each trade, you can type it the Orders comment parameter.

Service Cost

The price tag is like the other products by this developer set at $50 with 5 activations. To rent it for 1 month you will need $12.5 and for 6 months $25. The demo version has been downloaded 36 times in 20 days since the initial release of the EA. What we like about this EA is the fact it featured attractive Money management options and methods and a wide range of other parameters traders can use for optimization.

Conclusion

The overview page does not contain any performance screenshots, significantly reducing the attractiveness of the EA. There is a low-quality video attached showing very little and nothing useful, except for a positive gains graph. The page for the basic version of the Fibonacci Retracement is similar, without backtesting results screenshots.

This Forex service can be found at the following web address: https://www.mql5.com/en/market/product/47452

Categories
Forex Service Review

Lightning Cobra Plus EA Review

Neural Network EA is not easy to code and even harder to optimize. Even if the core idea is effective, the EA design or strategy can be inadequate. Lightning Cobra Plus is a Neural Network EA based on patterns, probably Fractals or candlestick patterns although it is not known for what period. It is made for the MetaTrader 4 platform and published on the MQL5 market. The first appearance was on the 7th of January 2020, therefore it is a new EA. Be aware that the EA is developed and published before the recent global crisis that is drastically changing 2020 and is never seen before. This means the AI data is not quite relevant to 2020 conditions.

Overview

As Neural Network is essentially math for pattern recognition using the data inserted, the new factors are not in the data. The latest update form 21st of March 2020 contains an improved order module probably, for this reason, marking the EA to version 1.8. The developer of Lightning Cobra Plus is Kenneth Parling from Sweden who is a member of CS Robots specialized company. He has 45 products in total on the market, some with solid ratings. This EA still has to gain some popularity.

The Overview page which does not tell much about the EA additional indicators, states that the neural core is fed with data before the recent COVID-19 pandemic. Since there are no mentions of other accompanying indicators that improve on the strategy, it means traders using the EA may rely on the already unoptimized AI core. Lightning Cobra Plus features virtual market orders that are closed once the opposite signal appears, also knows as OCO. Even though the EA is described as having a high-performance risk assessment system that adapts, it remains uncertain how “adaptable” it is today.

It has an automatic lot allocation implemented based on the account balance. In the case of server connection loss, the EA will retain the pending orders using internal memory. Stop Loss and Take Profit orders can be set to hard or virtual mode. If your broker forces FIFO ordering, you can adjust the Adviser with that option in the settings and it will adapt.

Lightning Cobra Plus seems to be optimized for the most traded currency pair, EUR/USD on the H1 timeframe. Low spreads and fast execution times are preferable, even the EA works on the H1. According to the author, the spreads play a large role in the overall performance. High leverage accounts and smaller deposits are advised with the risk set to $200/risk aggressiveness 0.1. Risk aggressiveness is a simple percentage-based lot allowance. There are no risky methods involved such as Martingale, limiting the number of opened orders to only per currency pair.

If you plan to use the EA on other pairs than EUR/USD you will have to find the optimal settings, firstly by using the pice calculation method with Open Prices or each tick. Other important settings are Weights. What are these factors remain unexplained, but according to the screenshots, there are 4 of them with the range from 1 to 200. If you want to change the working hours and disable Friday trading it is possible.

Service Cost

Neural Network EAs are usually more expensive, although Lightning Cobra Plus is in the mid-range with $99 to buy. You will have 5 activations and there is also an option to rent. One month rental is $15 and 3 months is $40. To some, it will probably be better to rent for just $15 and see it the EA has the real value now. The demo is downloaded 39 times meaning this EA has not reached the popularity boom and will probably stay in the outskirts.

Conclusion

In the performance screenshots, we could see that the modeling quality is 99.9%, on the H1 timeframe and the ICMarkets servers. In roughly 2 years of testing, the EA made 1008 trades, 62.9% of them being in profit and pulled 16.69% Maximal drawdown. The average profit trade was lower than the average losing one, 9.18 versus -12.21. The final result is 1253 profit for the initial 1000 deposit. These results show too high drawdown for the gains. It would be interesting to see the chart for the first quarter of 2020. There are no user comments or reviews available at this time.

This Forex service can be found at the following web address: https://www.mql5.com/en/market/product/45088

Categories
Forex Service Review

Line Sync Mirror Chart Review

LineSyncMirrorChart is a specific way of currency correlation representation tool designed for the MetaTrader 4 charts. The initial version is published in May 2016 by Vitaly Muzichenko from Ukraine, finalizing with the version 16.10 updated in October 2017. Updates added more features such as the ability to disable synchronization of all charts and Heikin Ashi chart type implementation. This tool is aimed towards Price Action trading strategies using the Support and Resistance, divergence, and reversals. LineSyncMirrorChart belongs to the paid products category on the MQL5 market and hasn’t received much attention.

Overview

By mirroring it is meant that the tool can plot multiple currency pair price charts into a single one. This correlation provides signals on many levels and interpretations, most of them are subjective. Price Action levels are not always clear, two traders can plot different Support or Resistance levels and see different Price Action patterns on the same chart. Comparing two or more price charts makes these patterns even more subjective thus making this tool very hard to measure or put it to the performance test. The MT4 Strategy Tester module is completely useless here.

According to the author, two strategies are recommended. The first one is the divergence detection after news events and their impact on the market or once a trading session starts. After such movements, the market will calm and the delta will converge. Support and Resistance levels have to be preset to avoid trading near them when the signal is pointing towards the Support/Resistance line. Traders can also detect false breakouts by comparing Price Action and currency correlations. Given all of the above, the tool is only for traders that make decisions on subjective technical analysis, not the one calculated and absolutely defined by indicators.

Some of the features include currency pair inversion. This feature can be used in many ways although it requires some creativity from traders. Many of the features mentioned in the Overview page require visual analysis such as detect history regularities, determine the strength of a currency, and reversal patterns. The developer recommends combining this tool with the “CorrelatePairs” indicator, which also belongs to the paid indicators category. In the video, the EA used is developed for this tool and is attached to the comments page.

There are many settings for Line Sync Mirror Chart although just a few are related to how the indicator behaves. First, you can select what markets are you trading, Forex, CFD, Futures, or Indices. Then, how to calculate lots for trades. The rest of the settings are visual, about the line colors, the number of buttons in the columns (for pair switching and similar), line style or width, line dragging support, font settings, and so on. Based on the screenshots, the tool is also showing the Pivot, Support and Resistance levels, symbols switcher, and more.

Service Price

The price for the Line Sync Mirror Chart is $32 to buy with 25 activations and $16 to rent for one month. The demo is available and free to include once you register on the MQL5 market. There are many other currency correlation tools published by others not giving this one a chance since it is probably badly presented and executed, making the tool a bit complicated, not beginner-friendly, and focused only on a narrow group of strategies.

Conclusion

The video supplemented on the presentation page is not showing all that this tool can do. Most of the pointers and the logic are missing, viewers may be confused about what is the purpose of many buttons and features. This is probably the reason why the tool is not popular with only one perfect review that does not tell much. The Comments page is mostly in Russian therefore not useful for others not speaking this language.

This Forex service can be found at the following web address: https://www.mql5.com/en/market/product/14719

Categories
Forex Service Review

Support and Resistance Zones Indicator Review

Price Action traders know Support and Resistance levels are the dominant element in their analysis, as well as other strategies. Support and Resistance is an elementary factor assessed for the prediction of points of trend reversals in both directions. This indicator is designed for the MetaTrader 4 for automatic recognition of concentrated prices based on which the zones are plotted on the chart. The indicator that can determine these levels instead of the trader makes the whole process faster, more precise, and non-subjective.

Overview

Support and Resistance Zones first appearance was on 21st October 2015 on the MQL5 market, developed by Mihai-Andrei Mitrache from Romania. This developer has his team for analysis and automated solutions although only two products are offered on the MQL5 market and their website. The latest version is 8.3 from the beginning of 2019. It has been updated many times with additional features, bug-fixing, and stability. It belongs to the paid category and has changed prices a few times according to the past user comments.

Automatic zone recognition has two modules for this purpose. The first one is gathering values on the historic peak levels, or highs and lows. These points are recorded and they form clusters. This data is passed on to the second algorithm module which disregards the values least repeated and accurately defined the clusters. These concentrate price levels are then represented as horizontal ranges on the MT4 chart creating the Support or Resistance levels. As an additional feature, the zones are divided into week normal and strong, depending on the price concentration, each shaded with a different color. Therefore, the Support and Resistance Zones indicator is not taking into account the Fibonacci zones, it is purely constructed on the mentioned modules.

The indicator is dependant on the historical price movements, this data is needed to find the levels and clusters. If you do not have enough history, the author suggests downloading from the History Center in the MT4 platform. You just need to select the asset and the timeframe. Once done you will be able to adjust several parameters to accommodate the indicator to your strategy. Setting the number of history bars, the indicator can be adjusted to use more recent price clusters instead of relying on old data. For traders that use lower timeframes, for example, M5, some important historic price levels could be important from a few days back, therefore the history range can be increased.

You do not need to use Support and Resistance zones for the current timeframe if traders think zones from higher timeframe are more reliable, the indicator features this setting. The Snap to Price setting is an extension that aims to adjust the zones to the recent price changes, regardless of the history bars scanned. This is especially useful if you want to clean the chart of excessive zones, not relevant to the current market. Snap To Price Percentage will define how far a trader wants to account for the recent period. We have mentioned the zones have strong, weak, and normal levels if you for some reason what only the strong zones, this can be optimized using the Zones Power Display.

Support and Resistance zones with are defined by at which level the cluster is defined, or the “sharpness”. Changing the S&R Power Split Display will result in thin or wider zones. You can also customize and enable what will be displayed from the settings range on the chart, so you have control of what is enabled. The indicator has a wide range of settings that extends how it can be used to various strategies, and some traders, it is important to have a tool that eliminates the subjective chart interpretation.

Service Price

The price of Support and Resistance Zones indicator has seen some drastic changes over the years. At one point it seems the price was above $500, which is certainly too high for a specialized indicator. As of now, the price is $85 with 10 activations. Renting is offered for $15 for one month and $25 for 3 months. Demo version has been downloaded 1247 times, showing mediocre popularity, although one could expect more since this is a common element in many strategies. However, the rating is perfect 5 stars from 5 reviews.

Conclusion

The only useful review is left by Lev Vladimirovic Marushkin:

“So far I am very pleased with the indicator and the support. I use this one mainly for entry confirmation and for taking profit and the MTF possibility is a very nice feature! I have both indicators of this author and they are both great in helping you to earn some green pips. 🙂 Thank you Mihai-Andrei for creating this!”

If you rely heavily on the Resistance and Support lines, even though they are regarded as non-existent in forex by part of the traders’ community, this indicator is based on logical and empirical methodology with plenty of changeable features.

This Forex service can be found at the following web address: https://www.mql5.com/en/market/product/12395

Categories
Forex Service Review

Greed GvGold MT4 EA Review

Judging by the provided video presentation on the Overview page of Greed GvGold for MT4 platform, this is a grid-like channel breakout strategy used with mixed performance results. Its first appearance was on the MQL5 marketplace in late March 2020, without much attention from the users. A couple of weeks later, it has been updated to version 2.1 introducing new features that dramatically change the final results from backtesting. It looks like the product was released in an incomplete stage or still in the testing.

Overview

Additions are made to the default settings for major assets, more settings options, optimizations for grid scalping, additional Stop Loss methods, and introducing trend channeling based on which one-directional trading is defined. The developer is presenting the EA with a clear description of the trading methods, recommendations, and 25-minute video with the testing procedure in the MT4 Strategy Tester. This developer, Dmitriy Kavtaskin from Ukraine, is new to the scene, with only this EA released on the MQL5 market and evident lack of experience in trading and coding. Another interesting fact is the extreme price for what seems to be an unfinished product.

Greed GvGold MT4 is universal, can be applied to any assets as it uses calculations based on the ATR indicator. Two trades are made based on the ATR value, on the upper and lower level. Take Profit is set also using the ATR. Once the Take Profit is hit, another trade is placed in the trend direction until a defined number of trades. Another cycle starts once all trades are executed, a new batch will close the trades and start again by opening two new positions.

This strategy can also be described as averaging since the trades on the opposite side are not closed but left open, they are just not scaled in as the first trade direction. Grid is also set just defined on the ATR levels, not the classical Fibonacci. All this combined pose a high risk for a trader, especially when no safety measures are taken in. Stop Loss is also set by the ATR indicator but it is too deep by default settings. According to the signal statistics of this EA on the MQL5, the drawdown is an extreme 54.7%, causing the signal to be denied from the subscription service.

The author goes on with a recommendation about the lot allocation. 0.01 lots per every $300 of balance where the projected drawdown is 30-40%. This is also too much to be considered for live trading, confirming the EA is still not a finished product. The video shows the account went out of money as a losing side is not closed for a long time, waiting for a correction. This is then alleviated by introducing the channel in the next EA update, so only one-directional trades are opened, following the trend. All this makes the whole product and presentation unconvincing.

It the settings range you will be able to set a few key parameters related to trading. Fixed parameters can be set if desired but the EA will use the ATR volatility measures for calculation. The Max Orders defines the maximum number of trades we have mentioned in the trading method, while TP pips and SL pips define the Stop Loss and Take Profit distance if you want them to be fixed, not according to the ATR indicator values. Distance Pending is also the parameter if you want fixed trading and will set the distance between the pending orders in pips. ATR indicator implemented in the EA can be customized in a few aspects, and these only work if you disable the fixed parameters setting. ATR period, ATR factors for the Stop Loss and Take Profit, and the ATR distance factor between the orders.

Service Price

The price for the Greed GvGold MT4 EA is no less than $777. This extreme price has no justification, it is not from a reputable developer, EA does not have promising results structure, uses a risky methodology, and it seems still in the testing phase. However, if you want to rent it, the price for 3 months is $145, for 6 $250, and one year $444. A demo offered is downloaded only 18 times, there are no reviews or user comments to date, still, there is enough time to update the EA with more safety measures or methods, and have a better presentation of its abilities.

Conclusion

The signal statistics aside from the extreme drawdown show interesting results for a few days it is recorded. Out of 47 trades, 41 was profitable (87.23%). The EA has an average loss of 32.83 and the average win of 34.33 making the longest winning streak of 17 trades and just 2 losing. Generally, winning trades are not lower by volume than the losing ones, making the monthly average gain of 48.96%. The average trade holding time is 2 days, meaning the EA is not for impatient ones. Note that this is all based on a very short time sample and the stats are not reliable yet.

This Forex service can be found at the following web address: https://www.mql5.com/en/market/product/47719

Categories
Forex Service Review

Final Code Forex EA Review

The Final Code is a relatively new EA without a clear description of how it works or any meaningful overview. It is made by Vitalii Zakharuk who has at least 46 products put into the MQL5 market. Final Code EA is published on 9th February 2020 without any updates so far. Based on what we have seen in the screenshots, The EA is a fast reversal strategy scalper working on lower timeframes. It belongs to the paid category and has no reviews or comments to date. The overview page presentation is very ambiguous, lacks even the elementary highlights, certainly inappropriate for the price set.

Overview

The only relevant statement about the EA function is that it works using sharp tick movements. It is also described as universal, working on every timeframe, asset, or broker. Still, later on, low spread and liquid broker is recommended with low commission. MaxSpread function seems to play the main role in this fast scalper, but if any timeframe is possible, the spread should be less of an issue. However, the spread is further described as important. Whatsmore, a broker with fast execution time is advised, clearly pointing out this EA is not as flexible as described.

Further on, users will need to set the commission parameter into the EA settings so the EA has correct calculations. It has to be converted into pips before typing in. The screenshots do not show any performance or backtesting results, only the entries on the EUR/USD pair set to 1M timeframe. If they are correct, there are several trade entries in 5 minutes. Each peak and bottom are covered with reversal positions confirming this is a reversal scalping strategy. Other screenshots show the graph but without any figures. The graph is smooth and seemingly constantly gaining and does not look like a Martingale method is used.

As for the settings, you can adjust the Risk parameter that sets the lot per trade according to the balance, MaxSpread, TakeProfit, StopLoss, Commission in points, and more interesting Volatility and LimitPrecentage parameters. These two are related to dynamic volatility on the market, depending on which the orders will be opened. The Volatility parameter sets the value and LimitPrecentage is the relative volatility.

Service Cost

Final Code cost is $450 for 5 activations with the option to rent. Single month rental is $240 and for 3 months $295. A demo is downloaded just 34 times, a low figure even for a relatively young product. There are no comments or reviews. This price is not appropriate for a product with a very bad presentation, unconfirmed performance, and unclear functionality.

Conclusion

It is not stated how this volatility is measured, and in a way, this is blind testing. Traders may have some parameters to test with but the majority of the EA trading functions are fixed and obscured. This is probably the main reason the EA remains unpopular. Traders should consider other options as there are many for this price range with confirmed history.

This Forex service can be found at the following web address: https://www.mql5.com/en/market/product/46178

Categories
Forex Service Review

GS Done Expert Advisor Review

GS Done is an Expert Advisor made for the MetaTrader 4 platform that does not use Martingale or Grid methods in its strategy. The exact strategy and indicators used are not disclosed in the Overview page for this product published on the MQL5 market. The developer is Aleksander Gladkov from Russia, who has 11 product total on the market. This author is relatively new on the scene, only a handful of products have received attention form the community. Other products use Martingale methods in his EAs, but this one is different.

Overview

It is not known what is the exact strategy, but it seems to be a pending trend following entry strategy with specific modules for filtering. The initial version of this EA appeared on the 1st of April 2020, therefore it is very new and amid the COVID-19 crisis shaking the markets. GS Done has been updated 3 times already, with further important improvements to the analysis algorithm, upping the version to 1.3 in just 2 weeks since the initial release.

The main page is not detailed but it has enough elementary information to grasp what traders are having on the table. This is not a scalper but a prediction analysis EA for future trends. The analysis module has a set of unknown indicators that signal a change or appearance of a new trend. These indicators can as well be reversals and oscillators such as RSI and Stochastics. Anyways, the prediction is not executed once the analysis is complete, only a pending order is placed at the calculated level. This level is probably calculated based on market volatility. Therefore, only after the price or the trend has appeared in real-time, it will hit the pending order and trade will be executed.

Only one trade will be opened for a single asset. Also, if the analysis changes the signal, or it moves in another direction, the pending order previously opened will be canceled and a new one will be placed instead. Based on all this, the prediction has a confirmation factor, using the pending ordering, which greatly increases the reliability.

Every trade has a Stop Loss and Take Profit levels. These are not calculated in an “advanced” way, they are just fixed levels customizable in the settings panel. Take Profit also has an additional setting that deviates for the classical Take Profit orders definition. Take Proft setting this EA uses is actually an exit signal by a reversal indicator, described as “Take maximum profit”. This setting allows you to choose the reversal signal exit or to use the classical fixed Take Profit order. Fixed Take Profit level is adjustable in the settings panel.

GS Done is optimized for the most traded and by some analysts most manipulated currency pair, the EUR/USD, on M15 timeframe. This means the EA is not universal, probably because of the specific volatility levels and other factors that are unique for this pair. Speaking of volatility, GD Done also has a News filtering module. The Newsfeed is taken from the Forex Factory site and the user will have to insert the link provided into the WebRequest field in the MT4 Experts tab. The News filtering module is configurable, you may select what news impact is filtered (low, medium or high), set the alert on the event, and when to stop trading before or after the event.

Other settings reveal more features of the EA. Risk management is integrated with the common Auto lot variable, based on the balance amount. The auto lot can be disabled and if you want to use trade lot allocation according to the balance, you can adjust the risk percentage to 0.5%, 1.25%, 2.5%, or 5%. The Time order limit is an interesting option to cancel the pending order if the price has not triggered it during the specified time. Some traders want to skip trading during certain periods so there is the option to set the weekend day, EA working start, and end time.

According to the screenshots, GS done has an extremely good, almost perfect percentage of profitable trades. Out of 89 trades executed during the period from the beginning of 2019 till now, only 3 have been lost trades. This is done in the optimized EUR/USD pair on the M15 timeframe. The MT4 Strategy Tester is set to model every tick so this should be reliable backtesting. Maximal drawdown is 15.74%, which is tolerable, but not it was calculated only on 3 losing trades.

Service Price

GS Done is mid-priced, $140 to buy with 5 activations, and no option to rent it. The price could change if the EA continues to have good performance and receives attention from the MQL5 community. For now, GS Done remains under the radar, no reviews or comments are published. The demo version is downloaded only 19 times.

Conclusion

The average winning trade is 76.60 and the average loss trade is -472.92, which may be concerning to some. A provided graph shows some of these dips when a trade is lost but they are compensated quickly as the EA has a great number of average consecutive wins (22). Gain per month is a great 35%, the final net profit score is 5168.10 using 1000 starting balance. Even though the EA is set to M15 timeframe, it does not trade much, it can even be inactive for days.

In our opinion, the 3 losing trades made acceptable drawdown, although 6 of them could trigger a margin call if closely chained. Traders should test the EA with various settings to see if this trade success rate is just because of a deep Stop Loss.

This Forex service can be found at the following web address: https://www.mql5.com/en/market/product/47482

Categories
Forex Service Review

Hit and Run EA Review

Based on the information and the settings for this EA we have determined it is using a channel breakout strategy for trade entries with several modifications and indicator combos for Risk Management and exits. HitAndRun is developed by Catalin Zachiu from Romania who has at least 26 other products, a couple of them having notable popularity and high ratings. The initial version of HitAndRun was published on the MQL5 market for the MetaTrader 4 platform on 10th February 2019. Updates are frequent with many new functionalities, the latest version 3.6 is from 31st of March 2020. The author’s dedication is notable as it is also evident in the comments page with the users. This EA is in the paid category but also has a free version linked.

Overview

HitAndRun defines Tops and Bottoms at which Buy Stop and Sell Stop pending orders are placed. How these levels are determined is not known, it could be the ZigZag or a channel type indicator. Once the level is breached, it is considered as a breakout and the EA will monitor for the exit and set a few Risk Management conditions. Trades have a candle period limit to which any given position can be held or closed if the exit indicator has a signal. Take Profit is also implemented with various customizable options. These options include Breakeven and Trailing Stop variants.

As the EA was updated with new functionalities, It also has a recovery module that is triggered after a losing trade. Recovery mode uses the MACD indicator, Price Action and the price jumps as the momentum signal. Interestingly, some Martingale elements are present. Recovery will also use increasing lot sizes for the trades after a loss. Therefore, Consecutive losses can be a big factor in the final result. Recommended currency pairs are EUR/USD, USD/JPY, and GPB/USD on the H1 timeframe. Note that the USD is present on every pair and could overexpose trading on a single currency.

The setting options are extended so traders will have a lot of freedom to set and test. Almost all aspects are customizable except for the main indicators and formulas. HitAndRun has Auto lot management as well as a fixed lot. Risk management is defined by a simple account Equity percentage. Hard and Virtual Stop Loss methods are customizable with the addition of Trail Step and Trailing Stop in points.

Other notable Risk Management settings are about Breakeven clauses such as BreakEven after points, lock in profits (move Stop Loss to the entry price level) and Start Trailing after defined points range. If you want to further customize the EA in other aspects you can do so by using the spread filter option, working time, use MACD for exits, set the period for the High/Low calculation, and other clauses. Certainly, this EA has a lot of integrations and settings options relative to the price.

The Overview page contains the video and backtesting screenshots that do not disclose much as the versions are different and the EA settings are not the same. Still, some interesting facts in the screenshots are confirmed by users. HitAndRun ahs a very low success rate, just 15.68% are profitable trades according to the screenshot. Depending on the risk allowed, the final result is more or less profitable. The low success rate can be contributed to the shallow Stop Loss trading which results in low maximal drawdown (13%). As expected, there are more consecutive losses than profit trades, but the average profit trade is 10 times larger than the average losing trade, 42.98 vs -4.07. All these shallow Stop Loss management results in a jaggy gain graph with sudden profits followed by even loss slopes.

Service Cost

As for the price, it is just $30 offering 5 activations. A demo is available but you can also use the free version that has some limitations but still functional. There are no rentals available. This price is affordable considering the EA is updated frequently and has a lot of elements and settings. Whatsmore, the shallow Stop Loss management puts it into the low-risk category.

Conclusion

There are 3 reviews published, all with maximum ratings. The latest one is from March 2020 by Andrey Tsygankov:

“Great adviser. One of the few that works with virtual stop orders, for which protection against spread expansion and slippage really works. Recommend.”

Another review confirms that the EA works exactly as in the screenshots. Overall, HitAndRun is a unique breakout strategy EA with elements of scalping, martingale and swing trading. Certainly worth trying out.

This Forex service can be found at the following web address: https://www.mql5.com/en/market/product/35710

Categories
Forex Service Review

Koi Trader Pro Trading Robot Review

The developer of this Expert Advisor for the MetaTrader 4 platform has received some attention from the MQL5 community publishing many EAs with great ratings. Koi Trade Pro is Michaela Russo’s newly developed EA released on the 28th of March 2020. It is a trend-following EA that is not suited to higher timeframes and has plenty of settings. Since the EA is new it is still waiting for updates, however, it has received comments and reviews already. Michaela Russo has 20 total products published on the MQL5 market and has 18 signal service using her products where you can follow their performance.

Overview

The overview page for this EA is similar to the other products by this developer, it has a promotion for a free additional EA, brief EA explanation, and the settings range. The recommended currency pairs are mostly related to the JPY. These are USD/JPY and EUR/JPY set on the M1 timeframe. As a trend following system, it is hard to understand how the EA works in a highly volatile environment. Still, the EA performed exceptionally good in backtests.

Similar to some other products, it seems this EA is just an optimized version of the same trend following systems published by this developer. It is stated the EA uses AI that analyzes the market and predicts future trends. Ichimoku indicator is disclosed as the main trend confirmation element. Ichimoku Kinko Hyo is a multilayered indicator specifically designed for higher timeframes than M1. One of his main features is the cloud range and the Moving Averages with different calculations.

Moving Averages are the key for trend confirmation while other elements serve as filtering and to some extent trend prediction. This trend prediction element might be the one responsible for the EA algorithm decisions. The Ichimoku indicator will be visible on the chart once you attach the EA. Based on the animated screenshot, we could not see the direct influence of Ichimoku’s MAs to the trend entry, Koi Trader Pro acted more like a scalper on a trend than as a swing trading system. It traded frequently and used the averaging method with trade was negative.

https://youtu.be/sz9JgnQ_h44

Recommendations for testing purposes is to start from 2013, the developer is proud to mention the EA has consistent results using precise testing modeling until now. The backtesting done in the MT4 Strategy Tester module is recorded and attached to the Overview page. Brokers most suitable are of course the ones with low spreads and fast execution times, important for scalpers, and fast-paced strategies like Koi Trader Pro applies. A minimum of $2000 is needed too. It will not matter if the broker is using the FIFO ordering methodology, the EA is compatible.

In the setting panel, you will see many parameters, some of them are directly tied to the Ichimoku element. The auto lot feature is integrated with the adjustable risk setting and fixed lot allocation if preferred. Spread filtering is done via the Spread Allowed clause, calculated in points after which no trades will be opened. Ichimoku settings are related to Tenkan Sen MA, Kijun-Sen, Senkou Span and Snekou Span B. Timeframe for Ichimoku is also adjustable which means the indicator may be based on higher timeframes than M1. Each day in the week can be set on or off. The EA also has some ordering management settings such as One trade for one bar, timeframe for EA First order, Max Orders number, Minimum Distance For secondary Positions, and so on.

Interestingly, these settings are not the usual and traders might be confused about what each parameter does as the explanation content is not useful. After further settings overview, we have noticed the One Trade Bar Grid clause which means the EA could use Grid methods aside from position averaging. Both methods are considered risky. Take Profit and Stop Loss management is implemented but without any trailing or advanced methods. You can adjust Take Profit with classical fixed range, close only on the bar end, first-order modifications, and similar.

Stop Loss is defined in a slightly different way. You will have a mix parameters for limiting the risk such as Enable Money Max Loss, Maximum Monetary loss, and close trading on Friday. News filter is added too, but you will have to insert the newsfeed link in the MT4, which is provided. Having the news filter means the algorithm is not suitable for high volatility. Still, the EA is optimized for Asian trading sessions. News filter can also be adjusted using the level of event impact, time pause after and before the news, and set the broker GMT.

Service Cost

Koi Trader Pro’s price is $150 with renting options. For one month the cost is $90 and $135 for one year. You will have 5 activations and a demo before you decide to buy where you can do your back and forward testing. Until now, the demo has been downloaded 107 times. The EA has received 3 reviews already giving it a perfect 5-star rating and 5 comments where users mostly asked for the free EA that comes along with the purchase of Koi Trader Pro.

Conclusion

According to the 8% risk performance chart attached to the Overview page, Koi Trader Pro has a 70.24% trade success rate and 31.57% maximum drawdown, using 99.90%. modeling quality. This drawdown is not very attractive but the average profit trade is not bigger than the losing one, they are almost the same. The maximum number of consecutive wins is 26 to 8 losses. This may be attributed to solid Money Management integrated into the EA. Also, average consecutive wins are 4 versus 2 losses. Since the EA was run from 2003 until now, starting with 3000, it reached an 11 digit figure on the M1 timeframe. The chart gain line has an exponential growth with notable fast dips once a losing trade is made.

One of the good user reviews that has some details is from Haseeb Ali:

“Purchased it last night and activated. The EUR and USD pairs are really swinging since yesterday and the EA is still making a profit. I hope it performs well in the long run.”

The product has definitely a good start, so you can expect support from the author and additional updates and enhancements. Also, since the EA is using several risky methods and has a significant drawdown, test the algorithm thoroughly

This Forex service can be found at the following web address: https://www.mql5.com/en/market/product/46617

Categories
Forex Service Review

Let’s Do It MT4 Expert Advisor Review

This version of the Let’s Do it EA is designed for the MetaTrader 4 platform and published on the MQL5 market as a simple averaging method EA for beginners. There are no specific traits about this EA and probably it is meant to avoid the promotion of any content that they could not consume. Let’s Do it is developed by Marta Gonzalez from Spain who has at least 53 products published on the MQL5 market and mostly works as a freelance programmer receiving good ratings. The first version of this EA is published on the 8th of February 2020, it is a new product with one update bringing the current version to 1.1. The update contains just the adaptation to Asian traders.

Overview

As it is designed for beginners, the EA does not require any supervision and does not require a large deposit. The author recommends $100 as a base for start. The content of the Overview page is simple with common marketing phrasing. Beginner traders should know the EA is probably a scalper using averaging methods, as what can be assumed according to the settings range. It is described as an advanced trading system that analyses and makes decisions independently, although every EA does this. Highlighting simplicity is a good approach but overdoing it completely masks why this EA is different or what is great about it.

There are some Risk Managing measures implemented such as the fixed Stop Loss and not opening more than one trade per currency pair. There are no risky strategies such as Grid or Martingale, although averaging is implemented. Interestingly, the author states in one sentence that Averaging is not used but in the features list states, “Very stable growth curve as a result of smart averaging techniques.”

FIFO method will not render the EA useless, however, in our opinion, the brokers that use First In First Out order method are not competitive. VPS, low spreads, commissions, and ECN environment are recommended as with every fast scalper. The default settings are good to go for the EUR/USD pair on the M1 timeframe. This timeframe is the lowest possible in the MT4 platform, it is not commonly used, although some scalping strategies are optimized for it. Let s Do It seems to be one of them, at least according to the performance charts published. The default settings are optimized for the EUR/USD but the author stated many other majors involving GBP, CAD, AUD, CHF, NZD, and even Spot Gold. It is not mentioned if trading on other pairs demands settings adjustment.

https://youtu.be/3ozF6FwP0eE

Interestingly, one of the features is the ability of the aEA to follow trend and trend reversal strategies. How is this is an option is not clear as the settings panel does not show this variable. Another curiosity is the implemented module to scan for concentrated prices, therefore, Support and Resistance levels. Based on the default setting screenshot, the working hours for this EA is from 8 am to 8 pm GMT covering the more active market environment. This is not common for scalper EAs where low volatility is preferable during the night time. The author left out to mention the Trailing Stop feature that is clearly implemented and customizable in the settings.

Settings panels will allow you to set the Magic Number, the fixed Stop Loss in points, Autolot management based on the account balance percentage or a fixed lot, working time, and Trailing Stop options. Trailing Stop can be set to simple, Step, and In profit clause.

Service Price

The price for Let’s Do it MT4 is $30, in the very low range on the MQL5 market. You will receive 5 activations and if you want to rent it there are several timing offers. For one month you will be charged $10, for 3 months – $15, for 6 months – 20$ and for one year $25. The demo is offered and strongly recommended if you plan on putting this EA to the real account.

Conclusion

The performance charts are all positive of course, but some key elements reveal how much is risked and the result traits of the implemented strategy. Note that the screenshots provide only 25% modeling quality in the MT4 Strategy Tester module and therefore are highly inaccurate. On all pairs, the EA has a high success rate and consecutive successful trades in profit. However, losing trades are 5 times larger than profit ones. On average, the EA makes 7 consecutive profit trades. Maximal drawdown is not high, on most of the tested currency pairs, it was around 10%.

As for now, there are no reviews or comments, as with the majority of the developer products, it is not popular yet.

This Forex service can be found at the following web address: https://www.mql5.com/en/market/product/45925

Categories
Forex Service Review

Market Trend Direction Indicator Review

This is a classic composite trend confirmation indicator designed for trend following on the MetaTrader 4 platform. The author is Andrey Kozak who also has no less than 85 other products published on the MQL5 market. None of these products received any notable attention for the community. This is also the case with the Market Trend, even though the indicator may produce good results. The initial version was published on 16th January 2018 and has never been updated. It may be reasonable not to put effort into a product that is not needed. Still, trend confirmation indicators like this may be hidden gold to someone.

Overview

Market Trend is composed of several indicators but generates only the Buy and Sell signals. The exact formula of how the values are combined into a single signal is not disclosed. What is certain is the fact MFI, RSI, and two moving averages are used in the creation. The indicator will show the “UP!” and “DOWN!” on the dashboard to the upper right corner of the chart window. Also, a trend force or momentum will be represented by a meter. The meter can be used for exits, however, the indicator is not lagging, but will not change the signal too often.

Having such an indicator that enters a trend early and stays on the move is not common to see. According to the video presented, the indicator has not missed a trade, catches the trend early, and was not imbalanced but the noise that at times was significant. Whatsmore, Market Trend is universal, it works on all timeframes and trading instruments.

Based on some research, we suspect the indicator also has a filtering capability using the combination of the moving averages. Similarly to the MACD, there are two MAs with faster and slower sensitivity to the price change. Whenever the price level is in between the MA lines, it is filtered, and the trend prevails with the noise. Once the price levels reach above or below both MA lines, Market Trend looks at RSI and MFI for Oversold and Overbought signals and combines them for new trend confirmation. Since RSI and MFI are both oscillators, the non-lagging property of Market Trend may lie in the reversal signal these indicators are mostly used for. Now, reversals are not always reliable so the developer decided to insert two oscillators with different formulas to increase diversification.

https://youtu.be/ejJ0MzFzW8s

Using the Market Trend is easy, Buy or Sell when the dashboard says so. Combining this indicator with others for other purposes than trend confirmation could create a profitable trading system. Of course, testing is necessary to see if it is aligned and synergetic with other elements. For that purpose, the author has opened a few settings to tamper with. You can adjust the periods for the RSI, MAF, and both moving averages. Now, these are not displayed so traders may have trouble finetuning as they do not see the feedback, only how the signals on the dashboard.

Service Price

The price for the Market Trend is $70 with 915 activations, still, this price is higher than average. There is no possibility to rent it although you have a demo available.

Conclusion

Unfortunately, there are no reviews or comments based on which we could know more. We are not certain why this indicator received such low popularity, even the 168 demo downloads do not point to the price barrier issue. The gif type screenshot is eyecatching presenting the indicator in action, but as it turns out, this is not enough.

This Forex service can be found at the following web address: https://www.mql5.com/en/market/product/27412

Categories
Forex Service Review

Like Fishing Trailing Stop EA Review

Like Fishing started as a Trailing Stop tool that extends the methods on how the asset price trailing is conducted by the MetaTrader 4 client. At the end of development, this Expert Advisor became a fully automatic trading solution. Initially published by Hamed Dehghani from Iran in late 2017 on the MQL5 market, the latest 2.2 version has been upgraded with trading decision-making algorithms and Auto Lot management.

Even though very interesting, this EA has not received much attention from mql5.com users for several reasons. For now, this EA may be a diamond in the rough for Price Action protagonists, and for those looking for a Trailing Stop EA that only manages how the Stop Loss moves with the asset price.

Overview

The Overview page does not present the EA very well, there is just one screenshot without any pointers. The video attached is a bit confusing, English is not clear enough, and the presentation is amateurish. Now all this aside, the EA is interesting for several reasons. Like Fishing’s main purpose is Trailing Stop management using the Moving Average, Fractals, Parabolic Support and Resistance (SAR), High Low or Zig Zag, and using the custom indicator of your choice.

Simple Trail method may be the least interesting since it uses a fixed range for trailing measured points, similar to what the MT4 already has. The MA method will use a Simple MA for trailing the asset price. The MA can be adjusted for the periods thus making it adjustable for different strategies on any timeframe.

Similar is for the Parabolic SAR and other methods, they are good for different trading strategies. The main purpose of every Trailing Stop is the better exit moment without the need to watch the charts and adjust manually. Once the Trailins Stop threshold is reached, Stop Loss will follow the price and lock down the profits at optimal levels. This EA has demonstrated that when the trend is losing momentum, the Trailing Stop line moves tighter and tighter to capture most of the waning trend. This is a very handy feature that is very hard to replicate manually on lower timeframes.

If you plan to add your custom indicator as a trailing method, the name of the indicator must match the one typed in the settings panel of Like Fishing EA. Also, 2 indicator buffer numbers that make the signals need to be inserted, one for Buy signal and one for Sell.

As of late, Like Fishing EA can manage trading on its own, making decisions based on the “amazing random strategy”. We have found out this strategy is pattern recognition for the Price Action technical analysis although the exact means are obscured. Most likely, the EA is using some other indicator specializing in pattern recognition. Even though the EA is fully automatic, the developer has not published the performance charts as other developers usually do when presenting their product. Auto lot trading is also recently added in the settings so traders can set their preferred level of risk per trade.

Risk Management is one of the most important parts of trading and this EA partly does it very well with the Trailing Stop positioning. Trailing EAs are probably the best trade exit solutions once they have enough options to adapt them for different strategies. Like Fishing has enough of them given the relatively low price. This EA is testable in the Strategy Tester module of the MT4.

Aside from the mentioned Trailing Stop methods, there are few other settings available in the panel. Separately manage trades by magic number or manage all of them, select specifics for each trailing method, adjust the dashboard positioning, and set the trading lot limit. The settings panel could appear long but is neatly organized, it is easy to understand once it is understood how the EA operates. Unfortunately, this is not the case at first sight and many will turn away given the bad presentation. There are a few videos posted in the Comments page not visible in the Overview that is in higher resolution and better demonstrate the EA.

Service Price

The price of Like Fishing EA is $30 to buy with 5 activations and $10 to rent for one month. A demo is available and critical to test your strategy first. Since the EA features custom indicator import and other abilities, it will give you enough variety to optimize for the best results.

Conclusion

There are only 4 reviews out of which only one is one star, averaging a total of 4 stars for this product. This one bad review could also be irrelevant to the quality, it seems the user was not able to understand how the EA works. Still, even with the lower price range, the EA popularity is low because of the benchmark results are not presented and a bad representation of its abilities.

This Forex service can be found at the following web address: https://www.mql5.com/en/market/product/26348

Categories
Forex Service Review

Smart Pattern Candlestick Indicator Review

Candle pattern is a popular Price Action method for discovering trends and reversals. By discovering patterns traders can predict the price move making this method non-lagging although the reliability is relative. SmartPattern is published on 20th November 2017 with version 2.1 for the MetaTrader 4 platform and not updated meaning this indicator was probably already developed before publishing on the MQL5 market.

The developer is Pavel Krysanov from Russia, having 38 published products although none of them achieved notable attention from the users. Indicators belonging to this category are numerous, many developers make them just to boost their SEO rating as the candle pattern trading is one of the most popular Price Action methods, in close relation to Fractals and Harmonic Patterns.

Overview

The Overview page is simple and short with good explanations of what the indicator does but without details. SmartPattern database of candle patterns is not disclosed but traders will have the basic and the expanded range to set on or off in the settings. Since they are predicting the move the author described them as superior to other indicators that “confirm” what has already happened, such as the Moving Averages. SmartPattern will draw arrows once the pattern, be it bullish or bearish, appears. It is real-time, traders will have the option to show labels over each pattern in case they follow only the ones regarded as the most reliable. According to the author, this indicator can filter false signals, although the logic or the method used for this purpose is not disclosed.

Scalpers and trend following strategies can use this indicator according to the author, we would also add reversals, channel strategies, and so on. Virtually any strategy can use a non-lagging indicator. Of course, not all traders belong to the pattern, Price Action, or scalping domain, relying only on strict rules generated by the confirmation lagging indicators. We would not say any is superior over the other, it is just the kind of trader that exploits them best is better than others.

SmartPattern can be mixed with any strategy, traders will have basic options in the settings to adapt this indicator to their system though. The main parameters are the mentioned pattern range setting, labeling, and alert notification methods such as email, mobile, or classic sound alert in the MT4. We have noticed a few pictures presented by the developer showing conflicting and frequent signals.

Since there are no settings to increase filtering, reliability or frequency of the signals, except to set to just basic patterns, you may be overwhelmed. There are a few times the signal is quickly opposed with another one and a few signals in the same direction. This can be used for Scaling in or out for one trade per signal or even gauging Support and Resistance levels. However, judging by the arrows frequency, we believe this indicator would be great for scalpers.

It does not lag and does not hold for a big trend. On other screenshots, we have noticed the indicator will not tell you when to exit properly. One bullish pattern may show a correct entry to a degree but do not expect an opposite arrow for the exit, you could end losing more than 10 profit trades combined. Therefore, having a system for other purposes is a must before adding this indicator to it. There is no specific timeframe recommended for SmartPatterns, based on the screenshots it can be used from H4 to M15, on most major currency pairs. Patterns are used on all markets and timeframes so this indicator is universal.

Service Price

Smart Patterns does not have a buying price, just a one year rental for $15. A demo is offered and there are 8 activations possible.

Conclusion

Since there are many indicators of this kind, traders may want to search elsewhere although the inner filtering, patterns base, and indicators may be different that make this indicator stand out. The specifics mentioned in this review also mean this one is more appropriate for certain systems. There are no users that left a review and there are no comments so SmartPatterns remains unproven in practice.

This Forex service can be found at the following web address: https://www.mql5.com/en/market/product/26393

Categories
Forex Service Review

Prado Micro EA Review

Many developers would like to have a successful starting career on the MQL5 market as the developer of Prado and Prado Micro Expert Advisors. Both products are new, Prado Micro is published on 13th of March 2020, just a few days after the full version. The author of both is Tatyana Kulyapina from Russia, successfully launching her first products. Both are designed for the Metatrader 4 platform and they already have attention and some reviews. Whatsmore, they are updated and have new settings files attached in the Comments section for certain assets.

Prado Micro is updated on 4th April 2020 with new filters and settings files, raising the version mark to 2.2. Tatyana Kulyapina is also a Forex trader and seems to understand systematic, effective methods for Risk Management. The Overview page, unfortunately, does not disclose any indicators used or has any details about the strategy. We were able to extract some more information based on the published EA signal performance and statistics.

Overview

Prado Micro is just a Money Management deprived version of Prado. This is done for the cent account traders who do not need lot allocation methods. The trading methods for both EAs are the same. Based on the description, the essence of the EA is the breakout strategy. For each day, as stated, the extremes are measured based on which pending orders are placed, Buy Stop and Sell Stop. Once they are triggered, the EA takes over the management of the trend following. As stated, the EA does not use Martingale, Grid, any of the fast trading strategies or Averaging.

The exact indicators used for managing trades are not disclosed, but what is described in the settings looks serious, more than the usual we find with other EAs. For Prado Micro, the recommended initial deposit is $100 although since the recent increase in volatility the developer is now suggesting $500. FIFO ordering method will not invalidate the EA functioning.

Once the pending orders are placed, along with that Stop Loss and Take Profit, the rest is of the position is defined by the Trailing Stop. The exact positioning is probably done using the ATR indicator, as some of the settings deal with the coefficients or factors. It is known that the ATR factor such as 2x ATR or 1.5x ATR is used for placing Take Profit or Stop Loss, and in case of this EA, Buy and Sell Stop pending orders. Still, we can only guess as the developer clearly does not want to disclose this.

The settings panel is full of such parameters where you are not sure how they affect the EA. It is like pushing buttons without a clear label. For example, the TakeProfitCoef parameter by default is 12, but if we change it to six does it mean it is two times lower or deeper, or is it a multiplier of the ATR? The same is for the StopLossCoef, OpenOrderCoef, EveningCoef, and so on. In the comments section, no user has posed a question to the developer about this. However, few elements are certain. Prado micro has Trailing Stop customization, using the TralCoef, BoomCoef, BoomMinDistCoef, BoomMaxPrc, and TralBoomStep (stepping off the trailing). Similar parameters are optional for the Stop Loss and the Take Profit. Other settings are related to the slippage filtering, the EA starting and session finish tactics and hours, broker server time, and the info display by the Prado EA on the chart.

The performance charts show very good results for the Prado Ea on various assets and risk levels for the little time they have been put to work. The signal service on the MQL5 shows 4 types, Prado on XAU/USD using 3% risk, USD/JPY with 2%, 3%, and 5%. We will assess the one that has been the longest-running, the USD/JPY with 3% that has been working for 21 weeks. Right away we are somewhat intrigued by a mediocre trade success ratio of 52.4% and a medium maximum drawdown of 17.6%. This could point out that the EA has very good trade management and loss protection. Because the final result is a 69% gain till now. Prado EA enters only 3 trades per week, holding them for 3 hours on average.

Another interesting fact is that the statistics show “80% of the growth is achieved within 3 days. This comprises 2.11% of days out of 142 days of the signal’s entire lifetime.”. We are not sure if this is a false warning since the signal shows steady growth since 2019. The EA could still need time to stabilize the results or the latest results are caused by the extreme stir on the markets in the first quarter of 2020. Interesting results are also achieved in other categories, maximum consecutive wins are 6 vs 3 losses, the average profit is larger than the loss (8.03 vs -6.07) and the gross profit is 265.02 vs -182.15. The initial balance is 100.

Service Price

Prado Micro price is $145 with 5 activations and no rental options. The demo has been downloaded 55 times which is good for a new EA specialized for the micro accounts, without the Money Management module. This version even has 1 perfect review and one comment for a user.

Conclusion

As for the monthly gains, since 2019, in December it was 26.41%, January 3.57%, February 8.19%, March 11.91%, and partially April 6.46%. These results show consistency despite only 52.4% profitable trades. One of the most important elements of the system is the loss protection, Prado EA seems to excel here. Overall, Prado EA is a new kid on the block from a new developer that seems to know about trading, risk, strategies, and how to code them properly, although not very transparent. It is definitely worth testing and trying out.

This Forex service can be found at the following web address: https://www.mql5.com/en/market/product/47218

Categories
Forex Service Review

MAFiA Scalper MT4 Review

Originally made for the MetaTrader 5 platform, but soon after the updates this Expert Advisor and a manual trading tool are also released for the MetaTrader 4 platform too. Both products are listed on the MQL5 market in late February and March 2020. MAFiA Scalper is a mix of strategies and indicators designed for scalping although no timeframe or currency pairs are suggested. The developer, Andrey Dyachenko from Ukraine, has either just a publisher for another company products or he has invested a lot of time to develop a complex EA with many elements. Most of his 4 released products are related to Fractals method EA and tools, all are new.

Overview

This EA and its MT4 version are relatively expensive but have a lot of features. It is a complete trading system with several integrated Money Management, Risk Management, trading elements, and filters. MAFiA Scalper is specialized, the trader using this tool should be familiar with the indicators used and the logic of the strategy. Whatsmore, the EA requires a specific trading account and has a higher price. The latest version is 1.41 that brings several new features like the info screen, trade opening and closing alerts, ATR trailing stop calculation, and some additional infographics.

The Overview page of this EA is transparent about how the trading is executed ad what indicators are used. Still, it is not easy to replicate the system without the Fractals recognition module as well as other trading elements such as specific trade scaling-in method and Alligator trailing stop. The Alligator is a triple line (Moving Average) indicator by Bill Williams made as a solution for trend entry, following, sideways market marking and divergencies, although the latter is not used by this EA.

MAFiA Scalper uses Fractals patterns for trade entries in sync with the Alligator. Once the trade is open, the Alligator lines will provide if the trend will continue with its 3 lines with different periods forming a stripe. This stripe is a ranging market zone signaling the trend is extinguished but also filters false pattern breakouts.

As the trend progresses, the Money Management module kicks in with additional trades. The base of this function is the Pyramid Principle or a ratio 5-4-3-2-1-1 according to trading sizes are defined. Scale-in trades are indicated by the Fractal pattern and diminish in size following the Pyramid ratio. The logic behind this is that long trends are fewer and a reversal could be more imminent as the trend gets longer, putting the weight on the first batch of scaled-in trades. Trailing is engaged using two methods, along the Alligator lines or by the number of bars passed, squeezing the trail distance as the trend continues. This behavior means the trades MAFiA Scalper males do not last long in terms of candles passed.

Stop Loss can be virtual or placed on the broker server, with the option to use the Breakeven movement. Trailing Stop also uses the ATR value in percentage to set the distance from the current price level, implying the adaptive nature of the EA to volatility. Sharp movements may not be an exit signal or an entry if there is such volatility in the market.

There are two modes On and Off in which it will operate as a fully automatic or as a manual trading system. In the On mode, opening, adding, and position measures are executed if the price is outside the blue Alligator line. However, MAFiA Scalper needs a “hedging account” as described by the seller, pointing a screenshot with the Binary.com broker which provides one. We are unsure if this EA is a sponsored or affiliated product, as we are not familiar with the peculiarities of a “hedge account” needed for the EA to work.

Traders will see a control panel on the chart that can ease the trading process if done manually. All of the functions are toggleable with buttons, such as the Breakeven, Buy, Sell, Virtual or Real Stop Loss, position size management and the Alligator colored lines switches. In the EA setting list, you will be able to control several aspects of the system. Stop Loss including the trailing method, Breakeven parameters, comments plotting, ATR distance, notifications, and other aspects of the system. Note that the EA does not have a performance chart presentation yet, either with a live signal on the MQL5 or as a screenshot.

Service Price

The price of MAFiA Scalper MT4 is $750, putting this product in the higher price range. Traders will have 8 activations after purchase. Renting is offered and traders may find this a better solution as the price is of less an issue. Rent for one month is just $25, for 3 is $69, 6 – $129, and $219 for one year. Considering that backtesting probably not possible right now, a demo is essential. Demo version has been downloaded 37 times to date showing mediocre interest by the community.

Conclusion

Some traders will certainly need this, on the other hand, the EA is also a manual trading system and in a way not fully automatic. After the Stop order is triggered, either by the trailing or normal, it will go into the Off mode and become just a signal generator. Therefore, the EA cannot be measure in a classical sense. Some could regard this as an easy way to evade responsibility by the EA performance. In the Overview page, a 58-minute video is attached presenting the EA in detail with some marketing elements.

Note that the EA is specialized and could not be classified as a pure scalper, reversal, pattern, or trend-following tool, it has elements from all. Whatsmore, the “hedging account” is needed, narrowing the target group of traders. MAFiA Scalper for MT5 has 1 review with a perfect score while this version has no reviews or comments yet.

This Forex service can be found at the following web address: https://www.mql5.com/en/market/product/47343

Categories
Forex Service Review

Modified VIX Fix Indicator Review

VIX is a volatility index used worldwide to measure this parameter crucial to many trading strategies for various tasks. Chicago Board Options Exchange calculates this Index and is available at cboe.com. The author of Modified VIX Fix is Jay Jantz from Canada working at Synapse Investments Research Group, publishing this indicator for the MetaTrader 4 platform on the MQL5 market. It belongs to the paid category, initially uploaded on 25th October 2016, and updated to version 1.1 in March 2017. The updates are minor, mostly visual additions and alert functionalities.

Jay Jantz has 25 products in total, only one of them received a bit of attention from users. Modified VIX Fix is a very specialized indicator, the author starts the Overview page with a quote by Larry Williams “The VIX Fix is a powerful indicator that detects market bottoms for any asset”. This means this indicator is a long trade after bottom specialist, tending towards the reversal type strategies as it is not lagging.

Overview

Fix in the Modified VIX Fix means the indicator is not only based on the S&P 500 but can be applied to any trading asset. Market bottoms are identified by peaks in the indicator histogram representation after which a bullish trend appears. According to the author, this indicator has two components integrated, standard deviation and stochastics as per Larry Williams VIX application from 2007.

Modified VIX Fix has two modes, both of them can be applied to the same analysis for better precision. The first one is regular VIX standard deviation mode where the market bottoms are identified with a teal-shaded bar by default. Long trade entry is made on the first gray histogram bar. The second mode is using the stochastic oscillator line crossing. When both modes are used, a trader can combine for more reliable trade entries only when the stochastic indicator lines are exiting the “80” range and crossing each other. For all signals, an alert can be set on various conditions.

In the indicator settings panel, traders have a few functional parameters. You will be able to change the modes to regular or stochastic. The regular one uses Bolinger Bands to highlight the bottoms. Standard deviation is included in the Bollinger Bands and can be adjusted. The standard deviation period and the Bollinger Bands length are also optional. Modified VIX Fix is based on percentages, not fixed values, and therefore always has the same range. This range can be modified with the periods and with the threshold for which the signal is regarded as valid.

The stochastic oscillator is adjustable just like the classic one, with the D and K periods. To appear more logically, the histogram and the stochastic oscillator can be inverted, so the signal bottoms appear in the lower part of the indicator window. The rest of the settings are aesthetic.

Since the Fix in the Modified VIX does not show exit points or anything other than market bottoms, exit and other supporting indicators are a must. Of course, the developer is suggesting some of his own although we are certain there is an endless number of combinations and systems that can be made with this indicator. The Overview page will give you some screenshots that are easy to understand and will give you the right insight on how the indicator works using both modes. Even the author does not mention it, the points where the bottoms appear can also be used for the Support Line determination meaning this indicator is also good for Price Action strategies.

Service Cost

Modified VIX Fix cost is $49 with 984 activations, $16 to rent for 1 month, and $33 to rent for 3 months. A demo is offered and certainly your first step before the purchase.

Conclusion

Certainly, for scalpers on low timeframes, VIX is not recommended, as most of the market bottoms are defined on higher timeframes such as Daily. Another interesting use for this indicator is the short trade exit marker, using the same logic. This indicator belongs to the specialized and interestingly composed category, it could be the most precise and useful to you or a complete waste of time. Unfortunately, there are no reviews based on which we could say more about users’ success. In the comments section, notably, some want to use it on shorter timeframes than Daily, and this may be the reason why this indicator is not popular. Most of the traders use lower timeframes, especially very popular scalpers.

This Forex service can be found at the following web address: https://www.mql5.com/en/market/product/18972

Categories
Forex Service Review

MTF (Multi Time-Frame) Money Flow Index Review

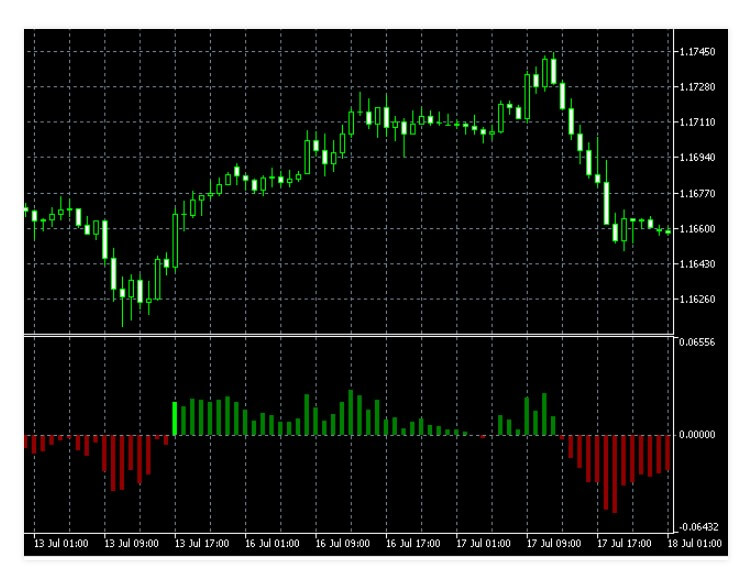
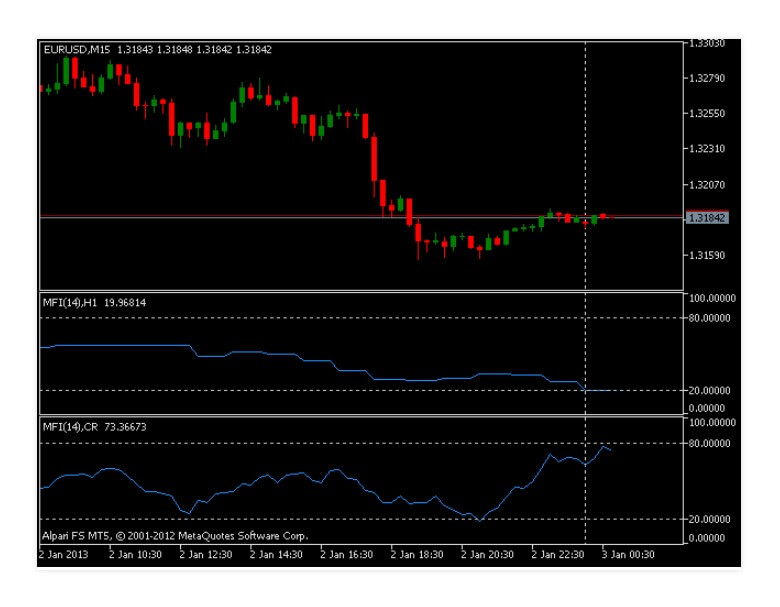
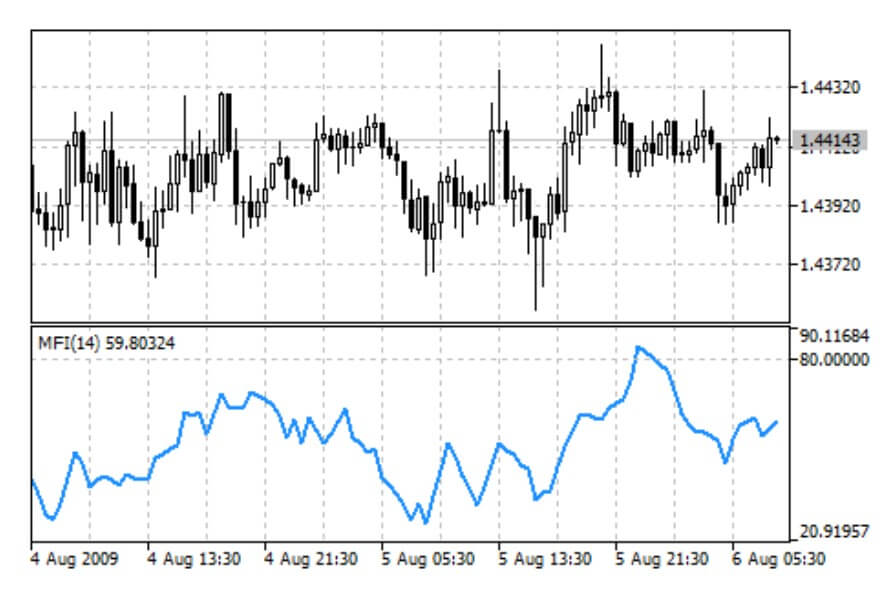
Money Flow Index or MFI is a commonly used oscillator indicator that can generate a few signals for reversals, trend confirmation, and even continuations. The specifics of this MFI is the Multi-timeframe dimension that gives trades more information on the higher timeframe without the need to switch to another chart. This is a very simple indicator modification without any other extras that could make it a versatile tool or an Expert Advisor.

MFI is developed for the MetaTrader 5 platform by Gabor Torma from Hungary who has a total of 18 products released on the MQL5 market. Almost all of his products are indicators transformed to have the MTF component, and even though it Is a simple modification, none of them are free.

Overview

Money Flow Index is already included in the MT4 and the MT5 platform by default. As an oscillator, it can show divergencies and to some traders, this is the main function for their trading systems. Divergencies are leading signals, happening before the possible price change and therefore are somewhat less reliable. However, divergencies could be used as a precaution that a trend might be dying out and exit before a reversal or a flat zone. MFI indicator has a volume factor inside its formula which makes it different than the commonly used RSI oscillator. This element makes the MFI more reliable when used for divergencies.

Another aspect of the MFI is the Overbought and Oversold levels, similar to the RSI. These levels are mostly used as reversal signals similarly to the RSI, when the MFI line crosses the 20 level upwards this is a Buy signal, and a Sell signal is generated when the MFI line crosses downwards from the 80 mark. Now, these levels can be placed to 10-90 or 30-70 depending on the trader’s strategy. Overbought and Oversold moments in the Forex market are considered to be nonexistent by a wide group of traders.

The third common use of the MFI is the continuation trade. Trades sometimes set the MFI as the momentum indicator, changing the period and the levels. Once the MFI line moves back into, for example, 30 or 70 level zones, the trend can be considered and continuing as there is enough momentum. This is especially useful since the MFI has the volume factor.

The Overview page is very simple and short for the MTF Money Flow Index, yet enough to grasp all of the features. The MFI indicator formula is not modified, but traders will have optional multi-timeframes not available in the MT4, just within the MT5. Since this altered product is made for the MT5, all of the possible higher timeframes can be set. So, for example, you may want to have one MFI on the current timeframe, which can be done just by adding the default MFI, and add this MTF MFI and set to calculate on a higher timeframe.

Even better, you can mix the two on in the same indicator window giving you the ability to see the MFI lines crosses as another signal generator. You do not have to stop there and you can add a third one on an even higher timeframe or change the period parameter, making a new structured indicator you may find uniquely useful.

As for the setting panel, the only addition if the multi-timeframe parameter. The developer also suggests using the Every Tick method when testing your custom indicators made out of this one. The developer has an MTF converter he is using on various indicators and has published them on the MQL5 market, for a price. Now, most of these small alterations of the default indicators such as the MFI can be found for free on the internet.

Service Cost

The price for Gabor Torma’s conversion is $12.99, which is quite affordable. There are currently 5 activations. There are no rental options and the demo version which is available has been downloaded 47 times as of this writing.

Conclusion

If you are looking for an indicator not widely used to have the MTF component, then you may need a coder that should make this easy work on your indicator. The product has been some time on the market, from 7th January 2013, for this period it has not received any reviews or comments. It has probably never been bought for reasons stated above.

This Forex service can be found at the following web address: https://www.mql5.com/en/market/product/606

Categories
Forex Service Review

Point n Figure Charting Indicator Review

The Point n Figure indicator functions by using alternative price chart presentations, similar to Renko charts. There are many types on charts although Renko is used by traders that like to approach forex and other markets from a very different angle. Essentially, these indicators or tools aim to filter the noise by “pixelating” movements into equal bars or box figures in case of the Point n Figure chart. The developer is Wang Qi from China who published this tool on the MQL5 market on 19th January 2016. It has never been updated as it never received any attention on the market. There are other products from this author, including a very complex Expert Advisor, yet none of them received a single review.

Overview

This tool uses X and O figures to present the price movements. Bull movement is represented with the X and O for bearish. Each movement has to be at least a certain amount of pips to be drawn on the chart. This amount is customizable by the trader, by default it is 20 pips. Since the figure plot is only done when the timeframe period closes, the movement will not have the highs and lows displayed.

Note that the price type measurement can be defined in the settings panel of this tool. Comparing it to the Renko charts, Renko is also defined by the price movement threshold to plot a bar, but in the case of Point n Figure chart, there could be many boxes in a single bar so they are not all equal like with the Renko. Therefore, this tool is in between the common candle chart and the Renko, allowing momentum to be presented with unequal bars.

To some extent, having less sensitive or pixelated chart allows better Price Action patterns and levels to be drawn and recognized. Therefore, it can be said this is a Price Action tool, but it is not limited to. Having a tool that filters noise is very useful for trend following strategies, although not so much for scalpers as it may misinterpret the noise that may put scalping ranges off balance.

Point n Figure chart opens a distinctively new way of how we can approach trading and create strategies. Like with Renko charts, it is affecting the indicators you insert, giving you new signals. Strategies developed with these do not resemble anything that we usually see. For this reason, Point n Figure Chart is an alternative, unpopular, and abstract way of trading. This is a reason for such low attention from the market. Still, this does not mean the tool is useless, just not for everyone.

The author has made Point n Figure to be used on both 4 digit and 5 digit brokers. You can customize the colors and have several price type calculations to select from. The Overview page presents the advantages mostly about easy finding the Support and Resistance levels, patterns, tops and bottoms, etc. This is just a small portion of what can be done here, especially since the columns generated are not just visuals, they affect any of the indicators added to the MT4.

In the settings panel, you can adjust the box size in pips, then the number of boxes needed for the column to reverse in the opposite direction, price calculation type, whether to use the High-Low levels, price close and to include an incomplete bar. The developer suggests searching for the patterns using the Point n Figure chart, although you can use the chart for noise filtering and many other strategies.

Service Cost

Point n Figure chart price is $65 with 5 activations and without the option to rent it. A demo is available and downloaded just 371 times by other MQL5 users.

Conclusion

There are no reviews or comments. There may be other alternatives on the internet that present the crat this way, some even for free. These may have different settings options or different execution so you might want to try the demo first and compare which option is better.

This Forex service can be found at the following web address: https://www.mql5.com/en/market/product/14074

Categories
Forex Service Review

Shadow FXUG EA Review

ShadoW FXUG is a newly developed Expert Advisor made for the MetaTrader 4 platform that belongs to a specific candle pattern recognition strategy. It is developed by Volha Loyeva from Belarus, a seller on the MQL5 market without any particularly noted product out of 9 published. There are no details about the EA strategy on the Overview page and the content is not very useful for the trader. The initial 1.0 version was released on the 30th of March 2020 and it does not have any updates yet.

Overview

It Is stated that the EA does not use the Martingale, Grid, locks, and other methods considered risky. However, we have noticed that Averaging is used in a classic way. Traders that do not follow the pattern category strategies and avoid Averaging should look for other automated solutions. The system has a loss protection module comprised of non-fixed Stop Loss orders. ShadoW FXUG is not a scalper although it has similarities, especially if we take a look into the performance chart figures.

The EA is presented with catchy marketing phrases, such as “shadowed by developers, modified by developers.” And almost nothing about how the EA works. The core of the strategy is the pattern analysis of candles and wicks. The wicks are factored in pure pattern strategies but it is also a measure of volatility and buying or selling pressure. We are unsure if the EA is using these factors for trading although the Stop Loss feature is presented as dynamic or adaptive to market conditions. EUR/USD it the only currency pair optimal, on the M5 timeframe. Now, M5 is considered a fast timeframe used by traders who follow scalping or other fast trading ideas that do not hold positions for long.

According to the features list, ShadoW FXUG is short to a mid-term proposition, closing all trades before the next day, thus avoiding the swaps. Only one trade will be opened for a single signal and all orders have a Take Profit and Stop Loss orders. Take Profit is not placed far ahead, most of the orders are closed this way, meaning the real exit indicator or a signal is non-existent. By default settings and according to the backtesting screenshots, the EA will trade about 15 trades per month.

If you want to have more aggressive trading, you will be able to turn off the filter changing the BodyLength parameter in the settings panel. Also, it is stated the EA is not dependant on the spread value which makes us wonder how can short term positions be mostly unaffected by the spread.

Interestingly, the small number of settings options are considered as a feature by the developer. In the settings panel, you will see only 10 parameters. The Timeframe parameter is not meant to be changed and therefore is locked. Trades can change the KProfit variable, which determines where the Take Profit will be placed, although it remains a ratio against unknown value. Wicks obviously play a role in the analysis and you can change the “size” of it in the MP variable. Averaging is used but can be adjusted with the HP parameter but traders will have to see how different is the EA Risk Management with bigger or lower values.

The TwoOrders parameter is for allowing the EA to open more trades than just one. This could be also used instead of turning off the BodyLenght filter mentioned above. Trade size allocation can be done with the FixLot or DynamicLot parameters, depending on how you want to manage the exposure for each trade. It is not known what is the base for measuring the market dynamics. The last option is the Max Spread where you can set the point value of the spread above which the EA will not open a position.

The performance chart screenshot shows backtesting dome in MT4 Strategy Tester for the 6 months ending in 2020. It is done with the BodyLenght filter on, on the EUR/USD and M5 timeframe using the Every Tick modeling (99.90% accuracy). Certainly, the success rate is almost perfect, 95.95%, that could be contributed to close Take Profit levels. Boosting the success rate does not mean the EA is successful in other aspects, the average profit trade is 24.20 versus -93.96 loss trade. This means if the market conditions change for a certain period to which the EA is not optimized, one could lose the entire account with a few losing trades. The average winning streak is 18 to just one loss, which means the EA is profitable with a profit factor of 6.09. Based on 1000 deposit, the EA made 1436 net profit. The final important figure is the drawdown of 30.58%, pointing to a somewhat risky strategy, especially concerning Averaging is used.

Service Price

ShadoW FXUG price is $999 and this could be a decisive factor why this EA does not have any reviews or comments form the MQL5 community. Traders who purchase the product will have 10 activations on different computers. A demo version is available and has been downloaded 26 times for about 1 month. There are no renting options, an unusual proposition concerning the price is in the higher range.

Conclusion

The developer is updating new settings files and uploads them in the comments section along with the promotions by the FX Urban Group, the developer team behind ShadoW FXUG. Note that there a few products form this group offered for free, and ShadoW FXUG is their most expensive product. It is still new but it does not have the values or figures needed to rise in popularity in our opinion. Whatsmore, the presentation is not good enough and there is no signal service to back up the EA with forwarding, live performance.

This Forex service can be found at the following web address: https://www.mql5.com/en/market/product/47795