
Introduction
In our previous educational article, we discussed the basic concepts of the Wave Principle developed by R.N. Elliott and the wave counting process.
Glenn Neely, in his work “Mastering Elliott Wave,” describes a series of rules that will allow the wave analyst to objectively identify what kind of structural sequence is developing the price action.
In this educational article, we present a summary of the basic rules described by Neely and their impact on the wave analysis and counting process.
Use of Retracements in Wave Analysis.
When the wave analyst faces his first real-time market analysis, it may seem confusing to define what kind of wave the market is developing.
To solve this problem, Neely defined a set of rules that will allow the wave analyst to determine what kind of sequence the market develops.
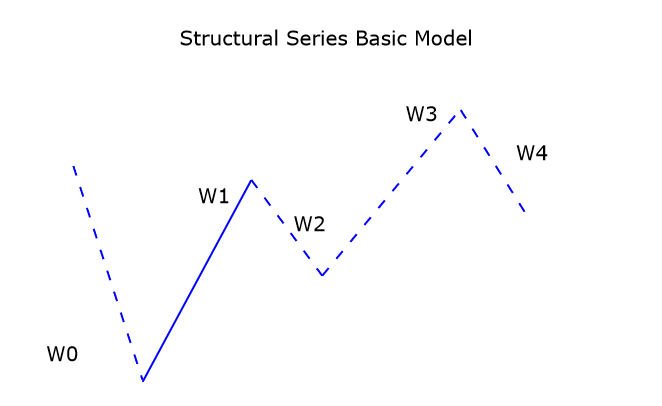
These rules are described as follows.
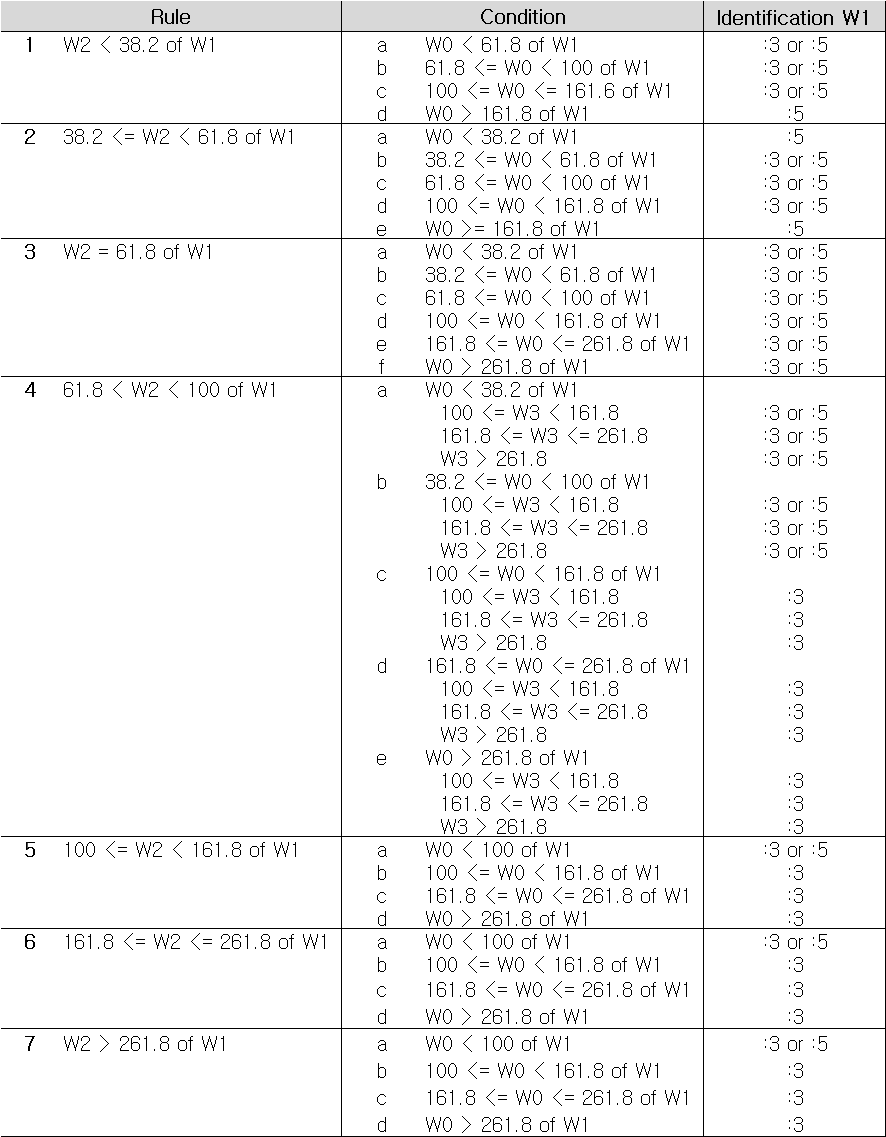
Our reader can examine with more detail these rules and the Fibonacci retracements use in wave analysis here.
Types of Structural Series
R.N. Elliott, in his work “The Wave Principle,” defined some specific patterns that tend to repeat across the time. These patterns are built by different structural series that the wave analyst should know before to start the counting process. These Elliott wave structures are formed as follows.
Impulsive waves (:5)
- Impulse – 5-3-5-3-5
- Leading or Ending Diagonal – 3-3-3-3-3
Corrective waves (:3)
- Zigzag – 5-3-5
- Flat – 3-3-5
- Triangle: – 3-3-3-3
- Double Three – 3-3-3
- Triple Three – 3-3-3-3-3
Remember that double and triple three are combined patterns.
The First Count and the Recount
As the level of complexity increases, wave sequences tend to create new waves of a higher degree, which can lead to confusing the wave analyst to identify where each wave begins and ends. For this, we use the validation channels and rules we have seen in previous articles.
Usually, the first analysis tends to be the one that presents the greatest challenge, because it tends to consider the highest level, or the lowest, to start the wave count. However, not necessarily the lowest, or highest level will be the beginning of an impulsive structure. This situation occurs because most methods of analysis consider the highest and lowest level as the starting point for analysis.
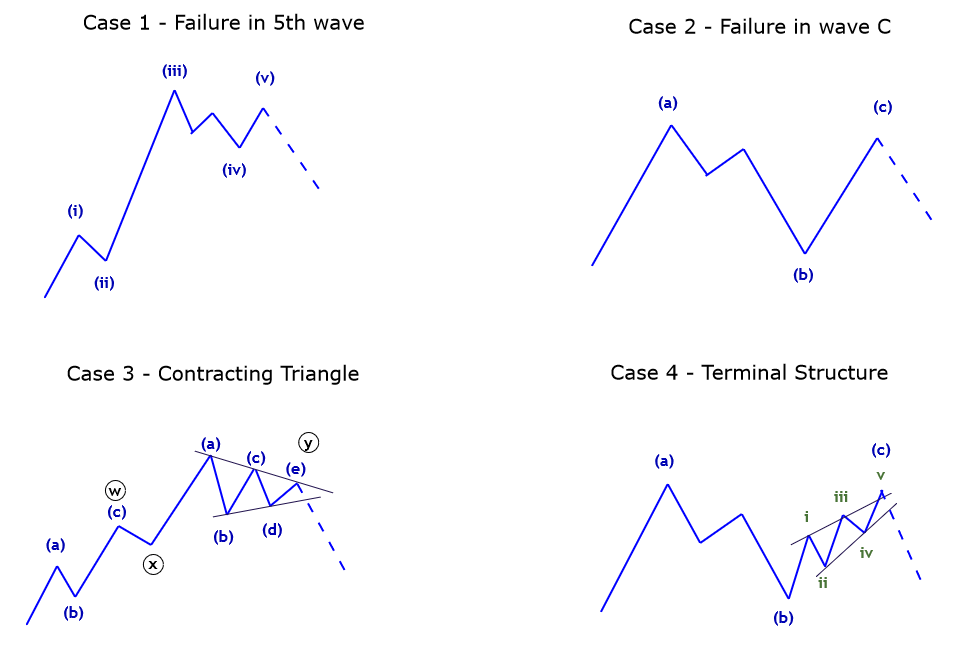
In terms of wave theory, a structural sequence will not end at the highest (or lowest) point due to the loss of momentum of price action. This situation will be reflected in one of the following four ways:
- An impulsive sequence containing a failure in the fifth wave.
- A flat pattern will end with a C-wave failure.
- A complex formation will end with a non-restrictive contractive triangle.
- An impulsive structure ends with a terminal pattern.
The following figure shows each of the four scenarios where the sequence will not end at the lowest level.
When a potential impulsive pattern experiences a reversal higher than its beginning, then the recount must consider that the origin of the previous movement is not the origin of an impulsive structural series, but can be part of a complex corrective structure.
Conclusions
In this educational article, we review different criteria described by Glenn Neely in his work “Mastering Elliott Wave,” which allow the wave analyst to identify what kind of structure the market could be developing.
Later, we reviewed the different patterns that R.N. Elliott described in his work “The Wave Principle” and his internal sequences. Currently, the patterns described by Elliott in the 1930s still can be recognized in the real market.
Finally, we discussed the cases where the market does not finish or start a new impulsive or corrective sequence from the lowest or highest point but will depend on how the previous structural series ends.
In the next educational article, corresponding to the third and last part of the wave counting process, we will see a series of examples of wave counting and identification.
Suggested Readings
- Neely, G.; Mastering Elliott Wave: Presenting the Neely Method; Windsor Books; 2nd Edition (1990).
- Prechter, R.; The Major Works of R. N. Elliott; New Classics Library; 2nd Edition (1990).