
Technical indicators V. Price Action
The foundation of price action trading is based on the discipline of making all trading decisions based on chart analysis only. A chart, relating to a specific period of time, or time frame, reflects the beliefs of traders in the form of ‘price action.’
Technical traders believe that economic data and other global news events are the catalysts for price action movement. Technical trading assumes that we don’t need to fundamentally assess such data in order to trade the forex market successfully. The reason for this is because all economic data and related world news that causes price movement are ultimately reflected in the price seen on a chart.
Example A
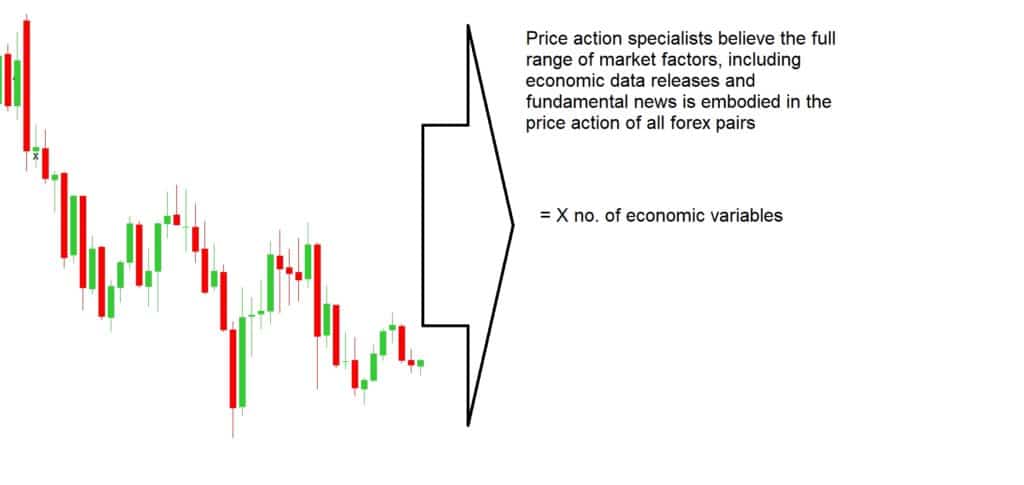
In example ‘A’, the candlestick formation shows an elevated price action at the beginning of the charts on the left-hand side, and then falls lower and traders believe that the market news is ‘in the price’ and therefore they are safe to trade the charts on the basis that their technical indicators are telling them that the price action is overbought, or oversold, and that therefore their chart indicators have a greater probability of offering winning trade set-ups until the next release of economic including such things as unemployment, CPI and inflation, gross domestic product or GDP, interest rate changes and political events and conflicts.
Example B
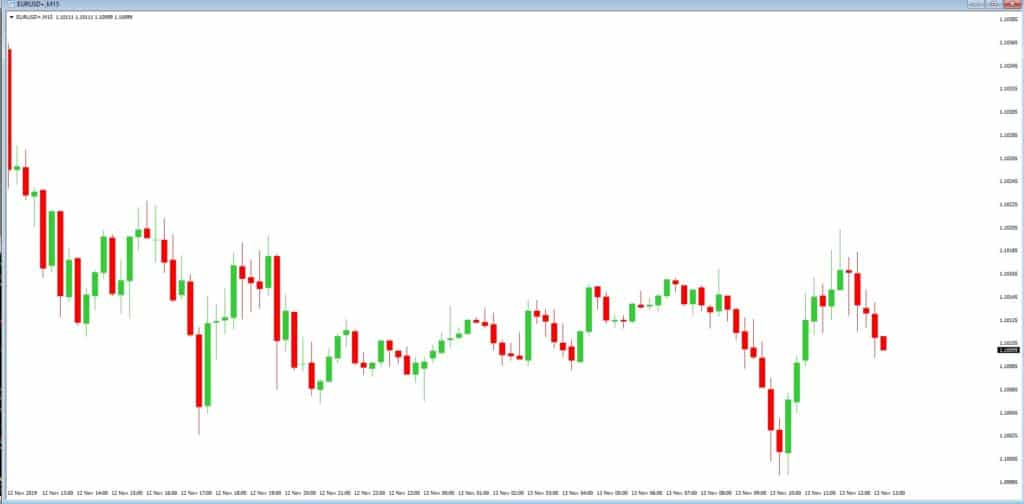
How do we analyze the price action? Let’s look at the example ‘B.’ This is a 15-minute time frame chart of the EURUSD pair. Each of the Japanese candlesticks presents 15 minutes of price action. Traders always read their charts from left to right, and in the case of Japanese candlesticks trading, they try to decipher the meaning of each candlestick, either individually or as part of a trend.
Example C
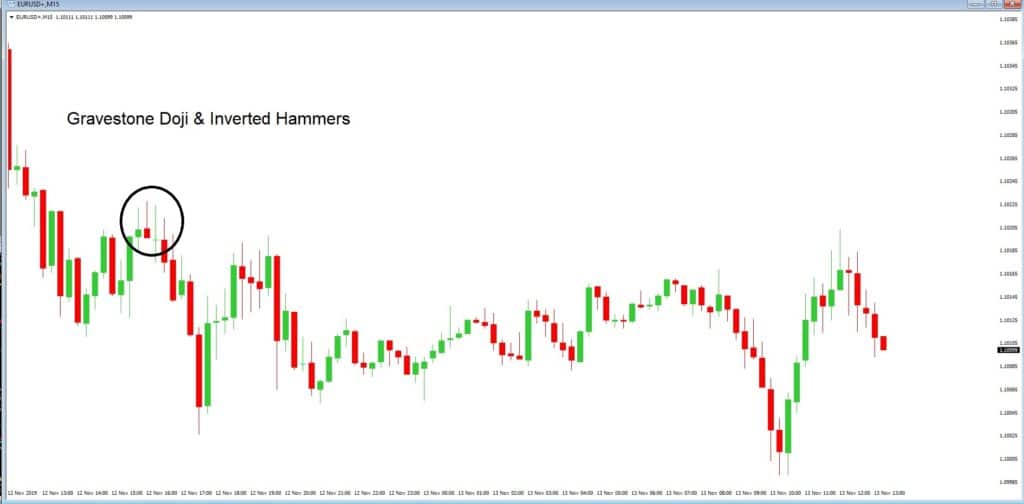
In the example ‘C,’ we have highlighted some Gravestone Doji’s and Inverted Hammers, which traders look out for because they tend to occur at times of price action slowing just before a reversal.
Example D
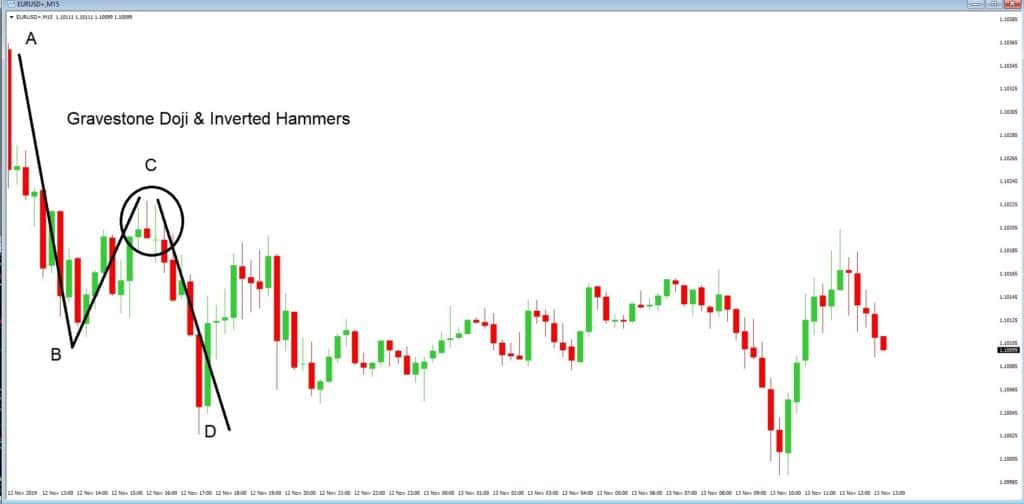
In example ‘D’ this is made much clearer by the use of some technical lines to identify an A, B, C, D, price action, and where at position C, technical traders would be looking for a push lower to the ‘D’ position, purely based on the gravestone and inverted hammer candlestick formations.
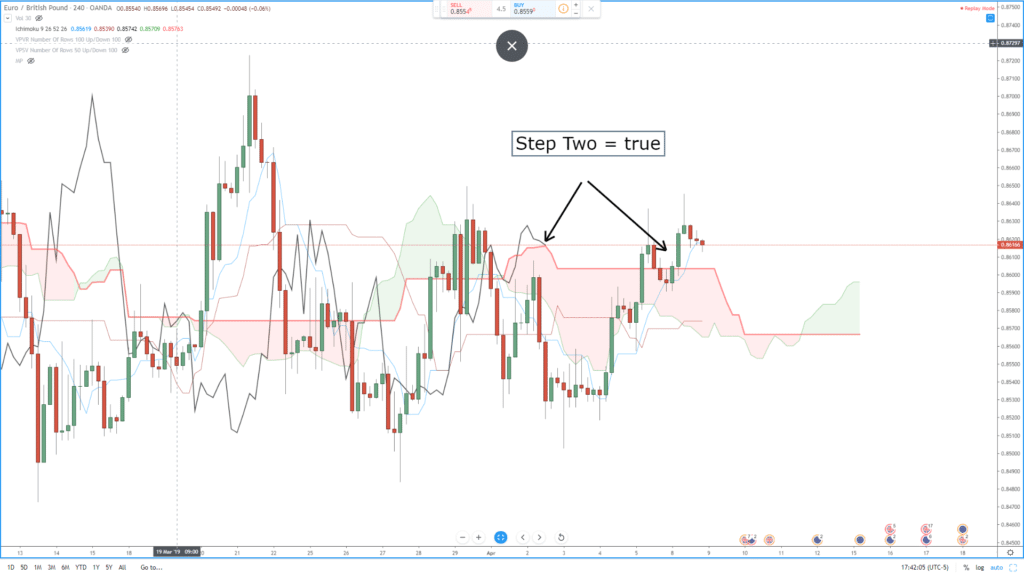
Example E
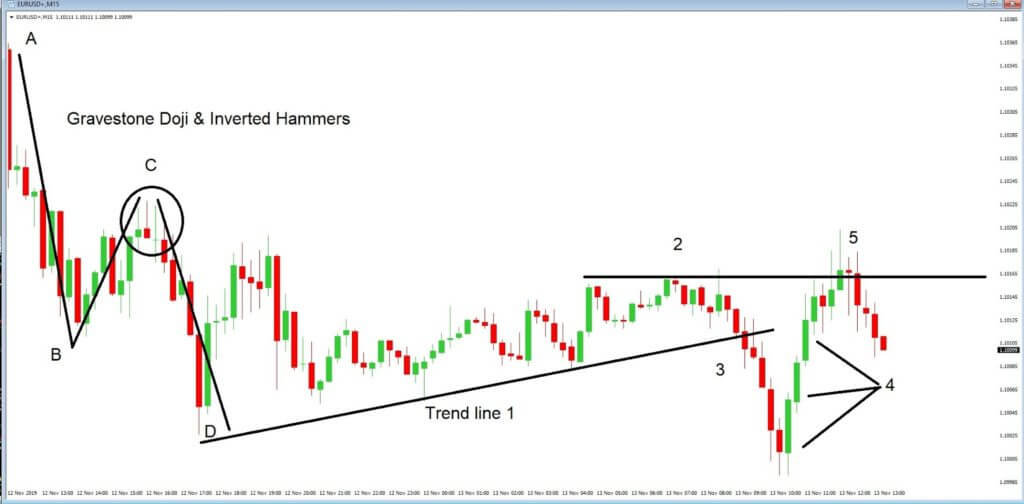
Now let’s look at example E, we have now added a trend line at position 1, and we can see a clear trend which is moving to the upside, and where price action bounces off our trendline as it gradually pulls back from the lows of the previous A, B, C, D, price swing. However, price action begins to flatten out at position 2, and when the price breaks through our trend line at position 3, our bear traders will no doubt be wondering if there is going to be a continual push lower to add to the overall trend of this chart. But the push lower is short-lived, and price reverses during position 4, and where these three candlestick formation is known as three Bullish soldiers and typically denotes a strong bullish trend. Price action falters at position 5, and this becomes an area of resistance, or a ceiling because technical traders will have drawn a trendline, such as ours, and noted that price failed to go above this level on three previous occasions at position 2. Indeed price action begins to fall lower from position 5.
So, in these examples, we can see just how important price action alone, in the form of Japanese candlesticks, and a few lines drawn onto our charts can be so effective in analyzing the ‘clean’ price of an exchange rate. There is an abundance of information when we drill down and look for it. But this can only be truly established by learning about how Japanese candlesticks can define price movements, the stalling, and reversal of price movement, and the indisputable evidence they provide of support and resistance on the basis that these candlestick shapes and formations simply repeat themselves time after time. Price action is a leading indicator, whereas technical indicators, which are overlaid onto chats and follow a statistical measurement of price, are lagging indicators. While technical indicators are an extremely effective tool in technical analysis, they often throw up false signals, or simply leg behind price action so far as to be unreliable when used on their own and without factoring in price action.
Here at Forex.Academy we recommend that new traders learn about the significance of Japanese candlesticks, and study their charts, and read them from left to right, because they tell a story of where price action has been, and where it is likely to move to in the future, based on the fact that all the relevant fundamental data is already encapsulated in the exchange rate of a particular price action.