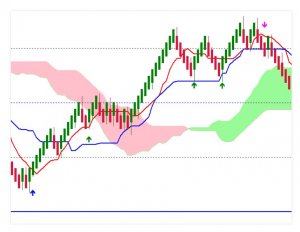
The Point n Figure indicator functions by using alternative price chart presentations, similar to Renko charts. There are many types on charts although Renko is used by traders that like to approach forex and other markets from a very different angle. Essentially, these indicators or tools aim to filter the noise by “pixelating” movements into equal bars or box figures in case of the Point n Figure chart. The developer is Wang Qi from China who published this tool on the MQL5 market on 19th January 2016. It has never been updated as it never received any attention on the market. There are other products from this author, including a very complex Expert Advisor, yet none of them received a single review.
Overview
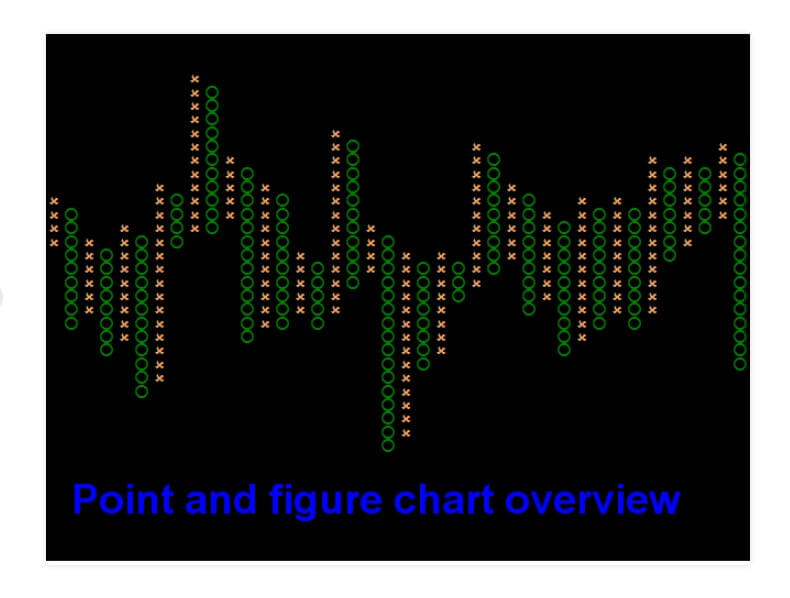
This tool uses X and O figures to present the price movements. Bull movement is represented with the X and O for bearish. Each movement has to be at least a certain amount of pips to be drawn on the chart. This amount is customizable by the trader, by default it is 20 pips. Since the figure plot is only done when the timeframe period closes, the movement will not have the highs and lows displayed.
Note that the price type measurement can be defined in the settings panel of this tool. Comparing it to the Renko charts, Renko is also defined by the price movement threshold to plot a bar, but in the case of Point n Figure chart, there could be many boxes in a single bar so they are not all equal like with the Renko. Therefore, this tool is in between the common candle chart and the Renko, allowing momentum to be presented with unequal bars.
To some extent, having less sensitive or pixelated chart allows better Price Action patterns and levels to be drawn and recognized. Therefore, it can be said this is a Price Action tool, but it is not limited to. Having a tool that filters noise is very useful for trend following strategies, although not so much for scalpers as it may misinterpret the noise that may put scalping ranges off balance.
Point n Figure chart opens a distinctively new way of how we can approach trading and create strategies. Like with Renko charts, it is affecting the indicators you insert, giving you new signals. Strategies developed with these do not resemble anything that we usually see. For this reason, Point n Figure Chart is an alternative, unpopular, and abstract way of trading. This is a reason for such low attention from the market. Still, this does not mean the tool is useless, just not for everyone.
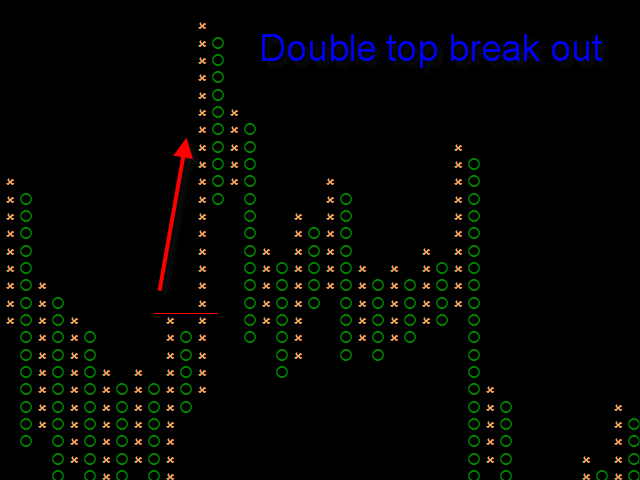
The author has made Point n Figure to be used on both 4 digit and 5 digit brokers. You can customize the colors and have several price type calculations to select from. The Overview page presents the advantages mostly about easy finding the Support and Resistance levels, patterns, tops and bottoms, etc. This is just a small portion of what can be done here, especially since the columns generated are not just visuals, they affect any of the indicators added to the MT4.
In the settings panel, you can adjust the box size in pips, then the number of boxes needed for the column to reverse in the opposite direction, price calculation type, whether to use the High-Low levels, price close and to include an incomplete bar. The developer suggests searching for the patterns using the Point n Figure chart, although you can use the chart for noise filtering and many other strategies.
Service Cost
Point n Figure chart price is $65 with 5 activations and without the option to rent it. A demo is available and downloaded just 371 times by other MQL5 users.
Conclusion
There are no reviews or comments. There may be other alternatives on the internet that present the crat this way, some even for free. These may have different settings options or different execution so you might want to try the demo first and compare which option is better.
This Forex service can be found at the following web address: https://www.mql5.com/en/market/product/14074

