Introduction
Volatility tends to run in cycles where we usually witness a period of high volatility that is followed by periods of low volatility. This cycle can be observed in almost any market. Let us consider the Forex market, where when a currency pair is strongly trending in one direction, the traders tend to show a strong preference for that currency over another.
During such trends, the market is volatile because the price is on the move. After a point of time, the currency pair will reach a point where the participants feel the exchange rate is fairly overvalued. At this point, the trend pauses and enters into a consolidation. Eventually, when this period of consolidation ends, the market reverses and may start to trend in the other direction. In today’s article, we discuss a trading strategy that will help us grabbing this reversal.
Time Frame
The volatility strategy is best suited for trading on higher time frames, such as the 4 hours and Daily time frame.
Indicators
The indicators that will be used in this strategy include 20-period EMA, Average True Range (ATR) and Bollinger Band Width, with their default settings.
Currency Pairs
The strategy can be used on all currency pairs listed on the broker’s platform. However, we still would recommend applying the strategy on major currency pairs due to higher volatility.
Strategy Concept
Many traders use the exponential moving average (EMA) for identification of the trend and as an indication of volatility. If the price is above the 20-period EMA, the market is said to be in an uptrend. Whereas if price below the 20-period EMA, the market is said to be in a downtrend. As the pair starts to consolidate, the 20-day EMA becomes relatively flat and starts moves in a sideways manner.
The flat 20-period EMA is an indication that the trend has paused and that the market could reverse in direction. In order to confirm that this consolidation is a potential trade setup, we’ll refer to two indicators. The first of these is ATR, which is a measurement of the average trading range of a currency pair, using the default parameter of 14 periods. If we see the ATR indicator falling, it means the ‘range’ is shrinking, and volatility is decreasing.
Bollinger bands are also used to measure volatility. Bollinger bands split open when volatility is high and converge when volatility falls. Instead of using the Bollinger bands themselves, we use the Bollinger band width indicator, which is nothing but a measurement of the space between Bollinger bands. When we see the Bollinger band width indicator dropping, it confirms that the currency pair is in a period of consolidation and that the volatility is falling.
The reduced volatility does not necessarily mean a reversal or a breakout on the other side. We confirm this by adding a trend line and using the EMA for entering the trade. Let us discuss in detail about implementing the above concept in the form of steps.
Trade Setup
In order to explain the strategy, we have considered the Daily chart of USD/CAD where we will be illustrating a ‘long’ trade. Here are the steps to execute the strategy.
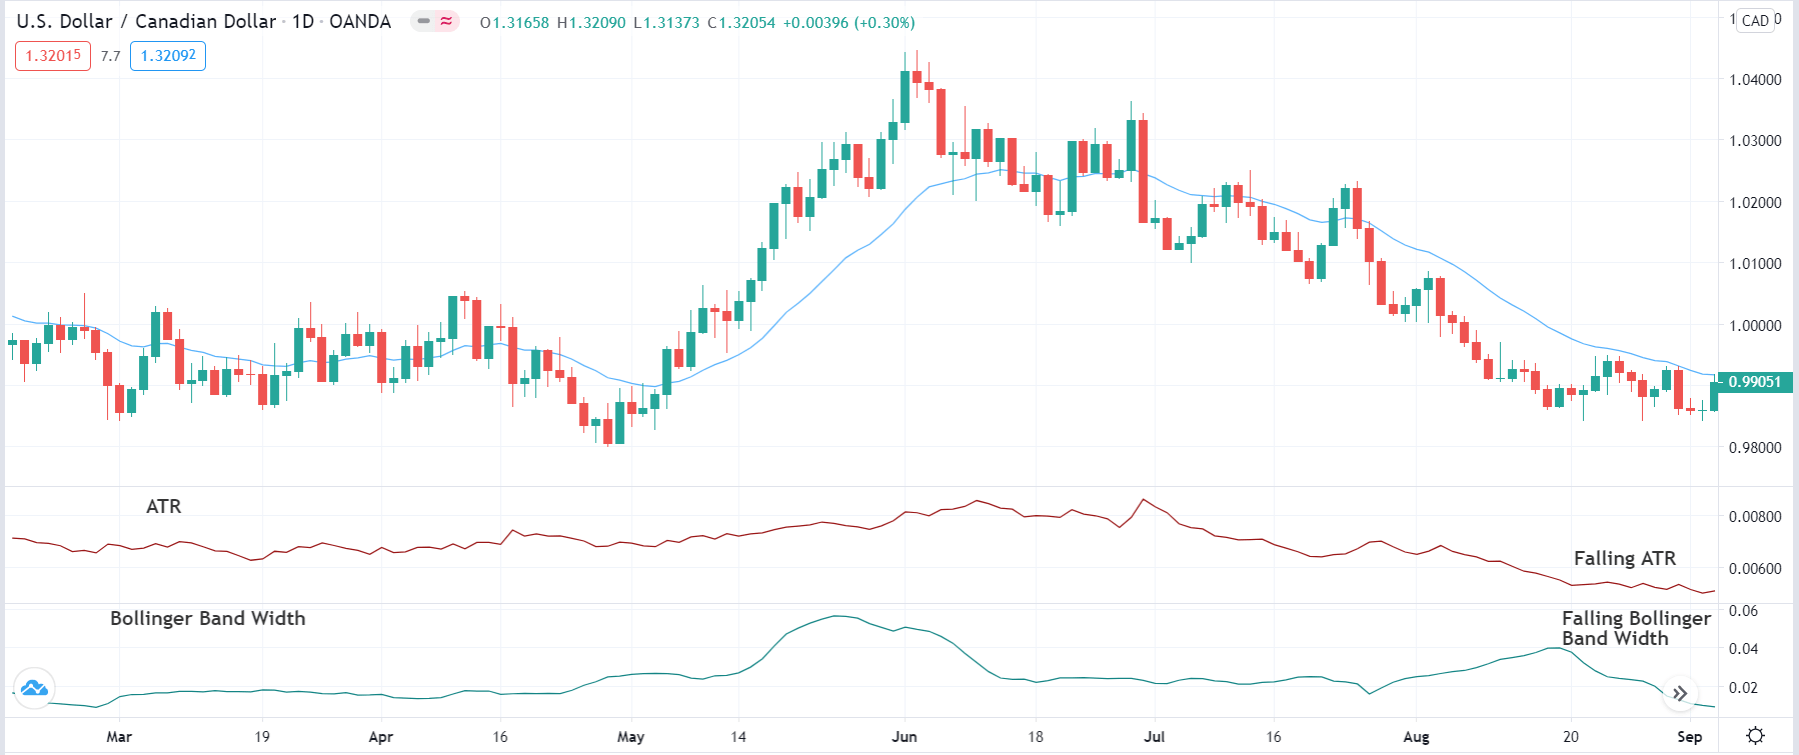
Step 1: First, we identify the trend of the market on the trading time frame using the 20-period EMA. This should be easy as it only requires us to see where the price has been trading with respect to the 20-period EMA. Longer, the price stays below or above the moving average, stronger is the trend.
As we can see in the below image, the price stays below the 20-period EMA for a very long period of time; hence, the market is in a strong downtrend.

Step 2: Next, we wait until the trend pauses and starts to consolidate. This is confirmed when both ATR and Bollinger band width starts moving in the same direction. That means, in an uptrend if ATR and Bollinger band width starts rising together, the market has entered into a phase of consolidation. Likewise, in a downtrend, if ATR and Bollinger band width starts falling together, the market has entered into a phase of consolidation. These are the early signs of reversal and that we should pay attention to the market from here on.
The below image shows how the market moves sideways when ATR and Bollinger band width start falling. Let us proceed to the next step.
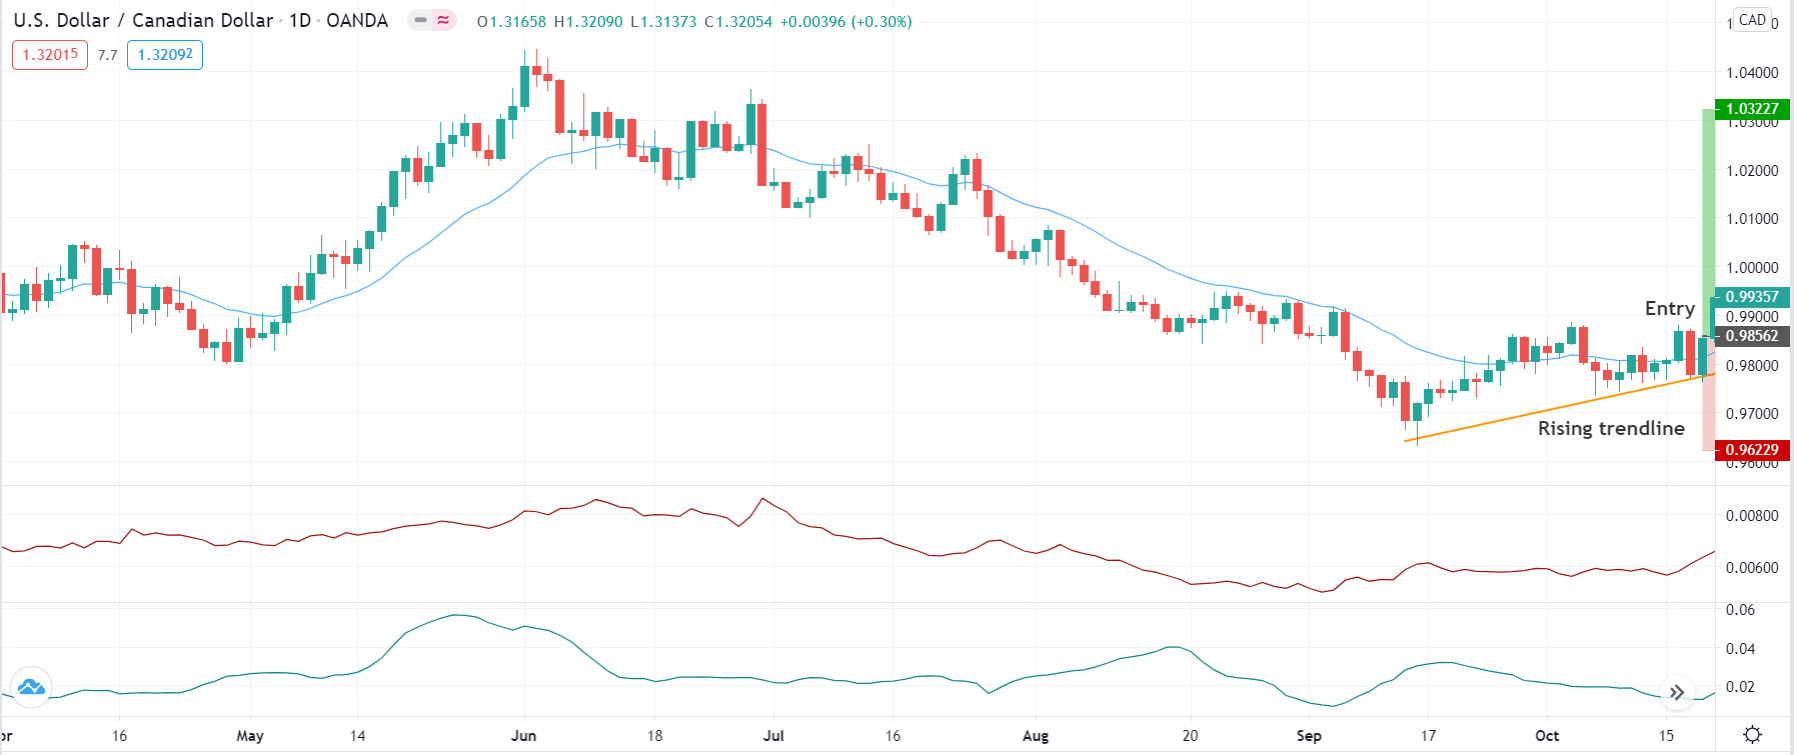
Step 3: Here, we need to wait for the market to turn on the other side and start moving in the opposite direction. Once that happens, we plot a trendline in the direction of the reversal. The reversal is confirmed when the market respects the trendline and makes a ‘higher low’ or ‘lower high.’ When the market reverses from an uptrend, it should make a lower high at the trendline and in a reversal of a downtrend, it should make a ‘higher low’.
However, we enter the market only when the price closes beyond the moving average, i.e. above the EMA for a ‘long’ and below the EMA for a ‘short.’
In the case of USD/CAD, we can see in the below that the market makes a higher low and respects the trendline confirming a reversal. We have entered ‘long’ right at the close of the price above the EMA.
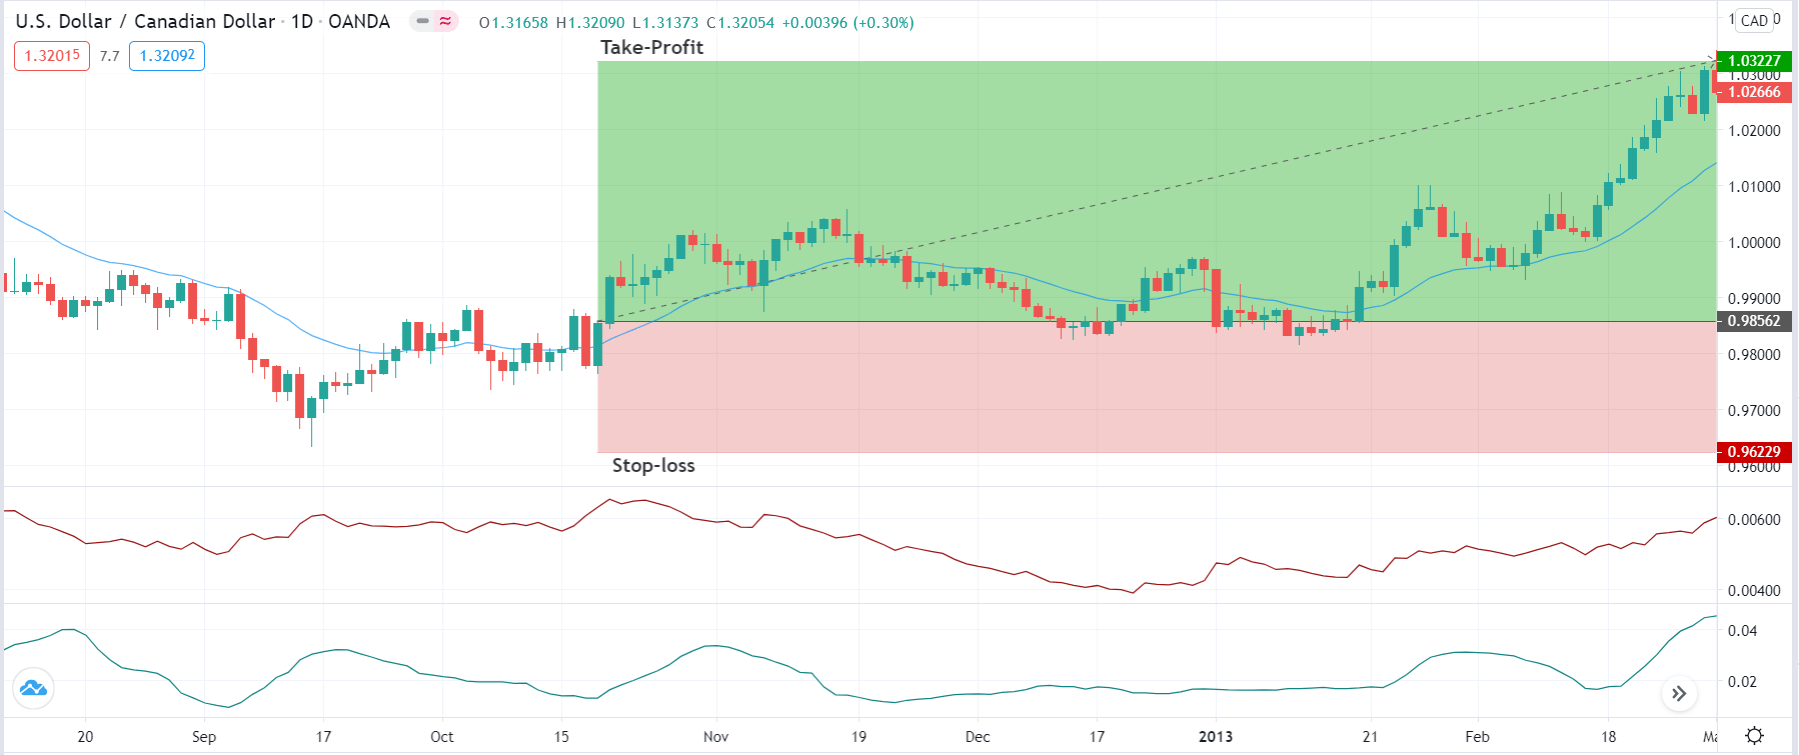
Step 4: Now, let us determine the stop-loss and take-profit levels of the trade. The stop-loss is placed just below the lowest or above highest point from where the market reverses. In a ‘long’ trade, it will be below the ‘lower low’ while in a ‘short’ trade, it will be above the ‘higher high.’ ‘Take-profit’ is set at a price where the resultant risk-to-reward (RR) of the trade is 1:2.
Strategy Roundup
The ‘Volatility’ strategy occurs over and over again and works well because of the recurring cycle of volatility. Although the above example shows a trade setup on the daily time frame chart, similar setups occur in other time frames as well. Note that the logic behind the setup and the market’s tendency to break out after a consolidation holds true in both long and short time frames.