Introduction
There are so many different trading tools that exist in the market, and most of the tools are connected, for example, price action directly connected with the candlestick patterns and trading indicators. On the other hand, traders use the trend lines, price channels, patterns in conjunction with the indicators to filter out the bad trades. When you use something alone, things will be hard for you, but if you use all of these tools according to the time or the market circumstances, then one can easily win in the market. In this article, we will show you how to use the different candlestick patterns in conjunction with the RSI indicator to benefit the different market situations.

BEARISH ENGULFING PATTERN.
Bearish engulfing is a reversal pattern which appears at the end of the uptrend. The pattern consists of two candles, Green and Red. The first candle is green in colour, which indicates the buyers are in control and the second red candle completely engulfs the first candle, which shows that the sellers overtake the buyers.
EVENING STAR.
The evening star is a three candle pattern that appears at the top of an uptrend, indicating that the buyers’ domination is about to end. The first candle is green in colour indicating buyers are in control and the second candle which is a Doji opened gap up indicting the fight between both the parties and the third candle is red indicating sellers stepping in. They are ready for the brand new lower low.
SHOOTING STAR.
A shooting star is a bearish candlestick pattern appears after an uptrend. The pattern consists of a long upper shadow and a small real body near the end of the day. The candlestick pattern indicates that the price tried to rise significantly during the trading hours, and then the sellers took over and pushed the price back towards the opening price.
HANGING MAN.
The hanging man represents the potential reversal in an uptrend. The candlestick consists of a small real body with little or no upper shadow and a long lower shadow. The candle indicates the demand has pushed the price higher, but in front of the stronger sellers, the buyers only able to pushes the price near to the opening price of the candle.
RSI.
RSI stands for Relative Strength Index. The indicator is displayed as an oscillator that has readings of 0 to 100. The indicator is developed by the J. Welles Wilder, and he introduced it in his book 1978 book “New Concepts in Technical Trading Systems.” The value above the 70 is an indication of the overbought security and the value below the 30 is an indication of the oversold conditions.
TRADING STRATEGIES.
RSI AND BEARISH ENGULFING PATTERN.
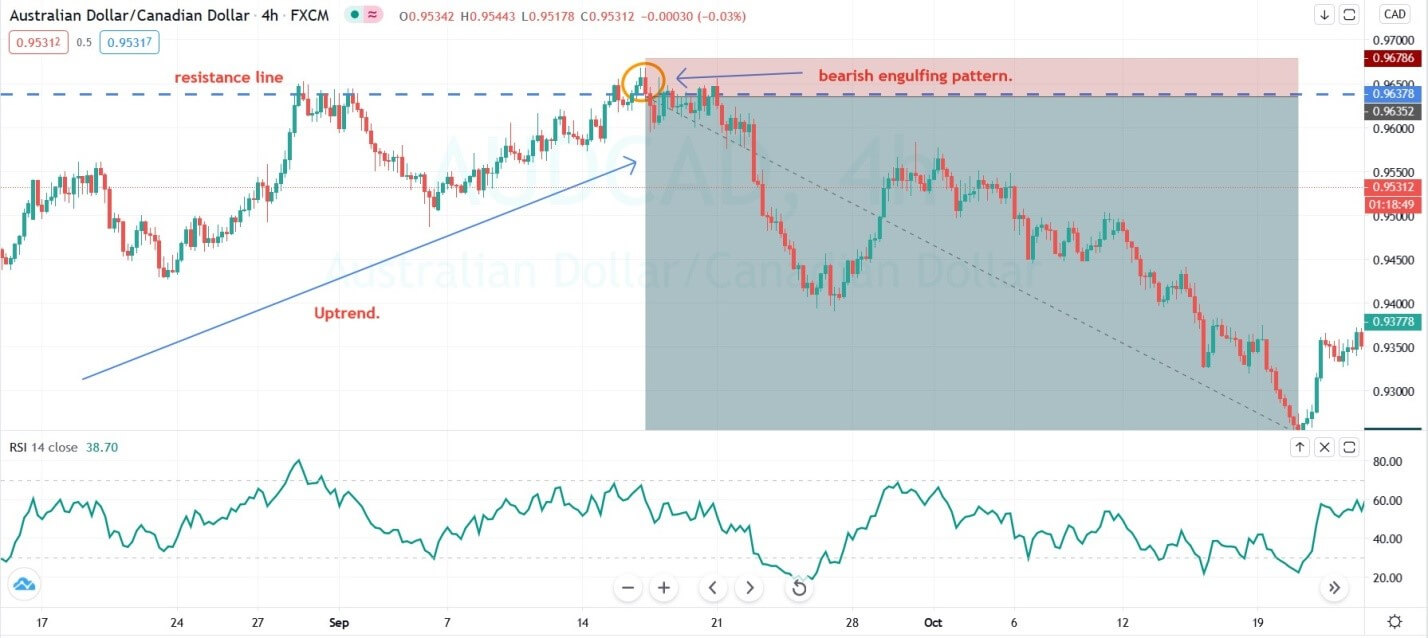
The image below represents the uptrend and Bearish engulfing pattern in the AUCAD forex pair.
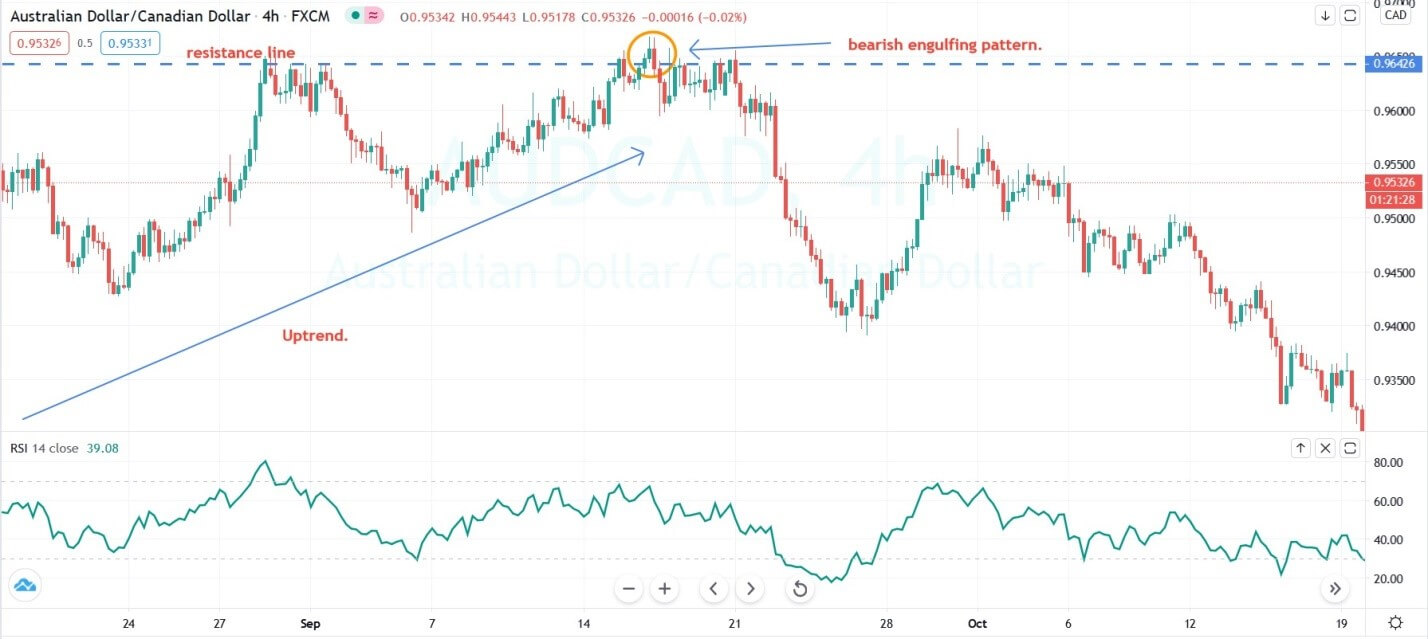
The image below represents our entry, take profit and stop loss in the AUDCAD forex currency. The pair was in an uptrend, and at first, it failed to go above the resistance line, and when the second time buyers tried, we witnessed the bearish engulfing pattern, where the strong sellers completely engulf the first red candle. The bearish engulfing pattern on price chart backed the resistance line, and the RSI reversal at the overbought area was a signal to go short. The three signals aligning in one direction gave us the confidence to go for smaller stop loss and booking profit we choose the higher timeframe main level.
EVENING STAR AND RSI.
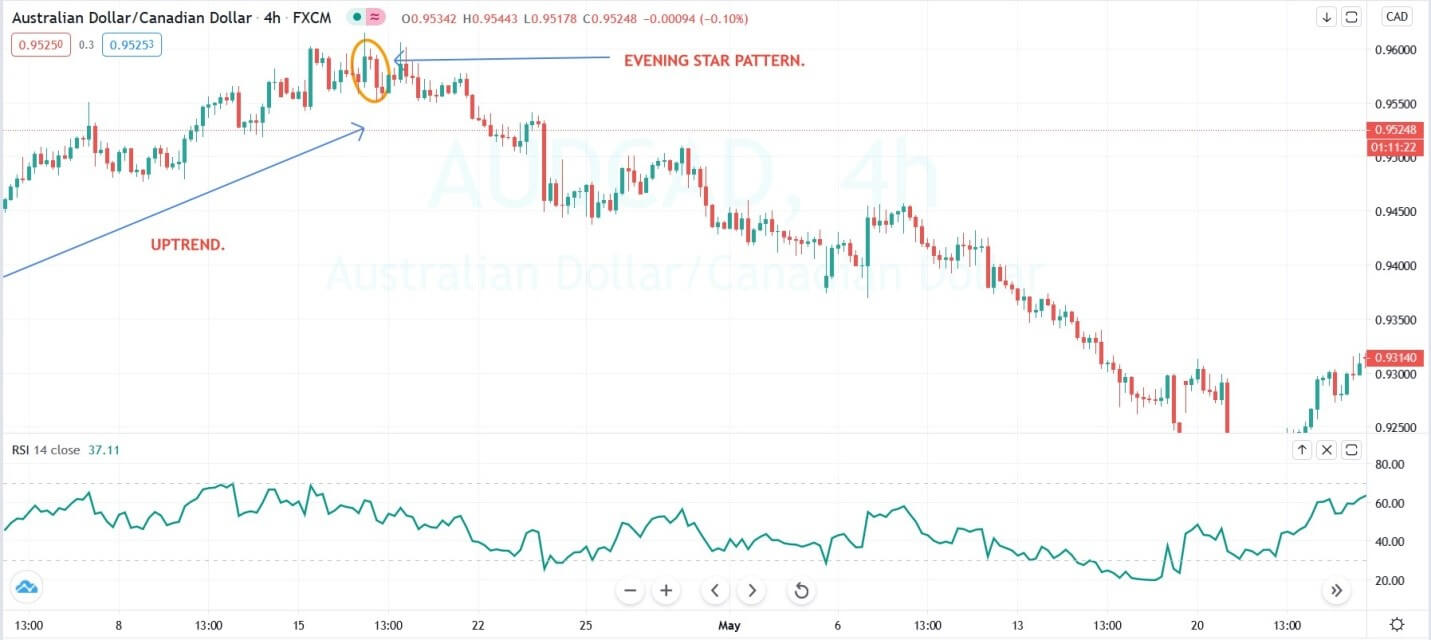
The image below represents the downtrend and the Evening star pattern.
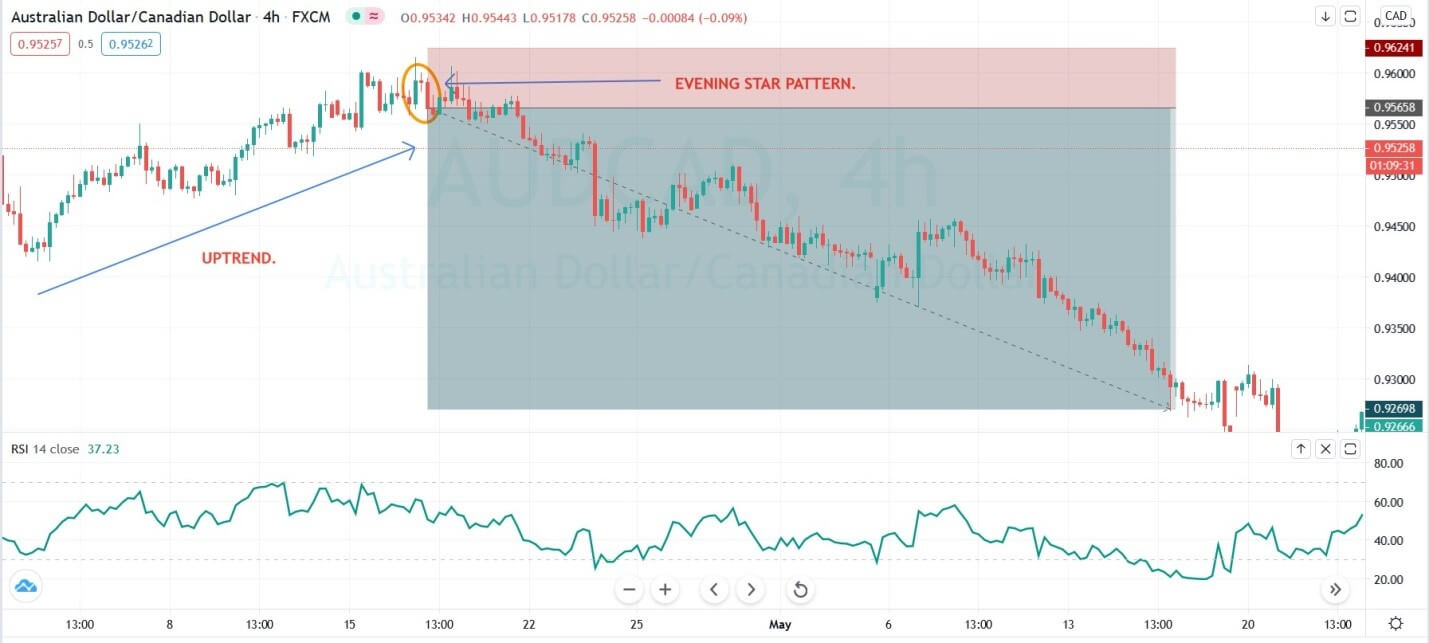
The image below represents the entry, exit and stop loss in the AUDCAD forex pair. The market was in an uptrend and the evening star pattern indicates the buyers are no more in the game also the RSI already gave the reversal at the overbought area, so going short was a good idea. This trade was taken on the 240 chart, and after the pattern, formation prices turned sideways for a couple of days where most of the traders choose to exit there trade, but in trading, patience is the real key. Embrace the risk, have faith in your analysis, hold your trades and aim for the bigger targets.
SHOOTING STAR AND RSI.
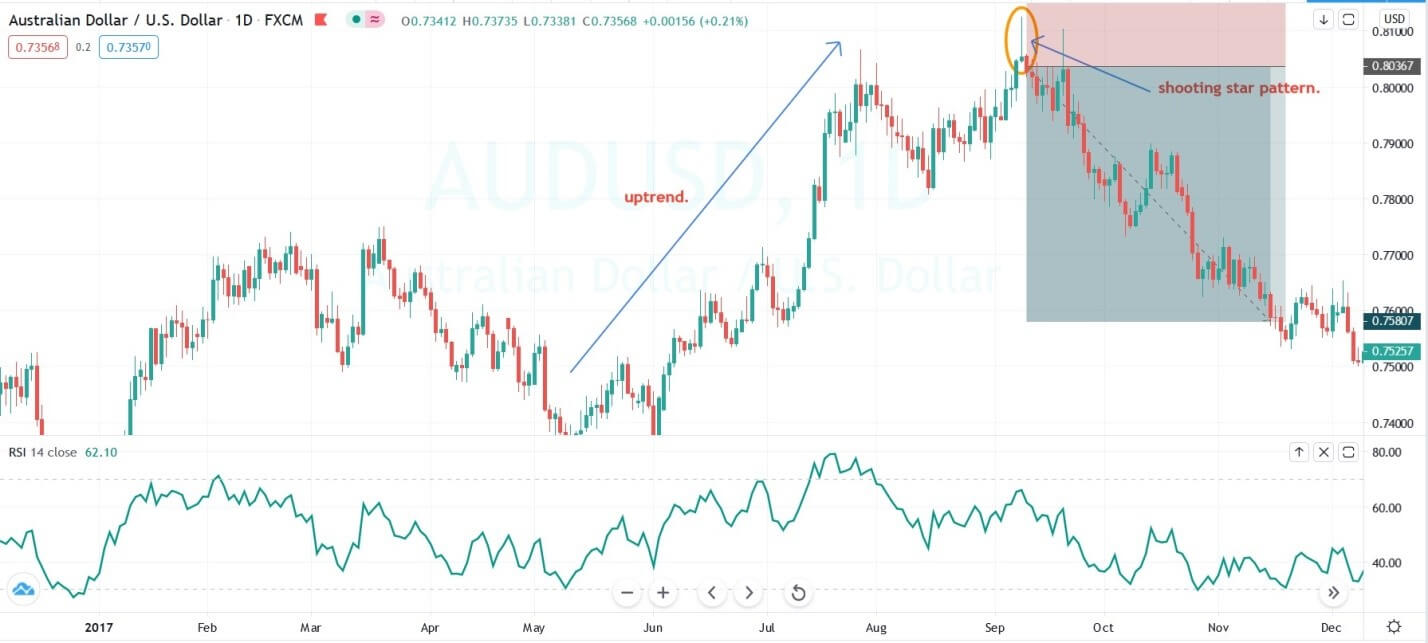
The image below represents the uptrend and the shooting star pattern on the Daily chart.
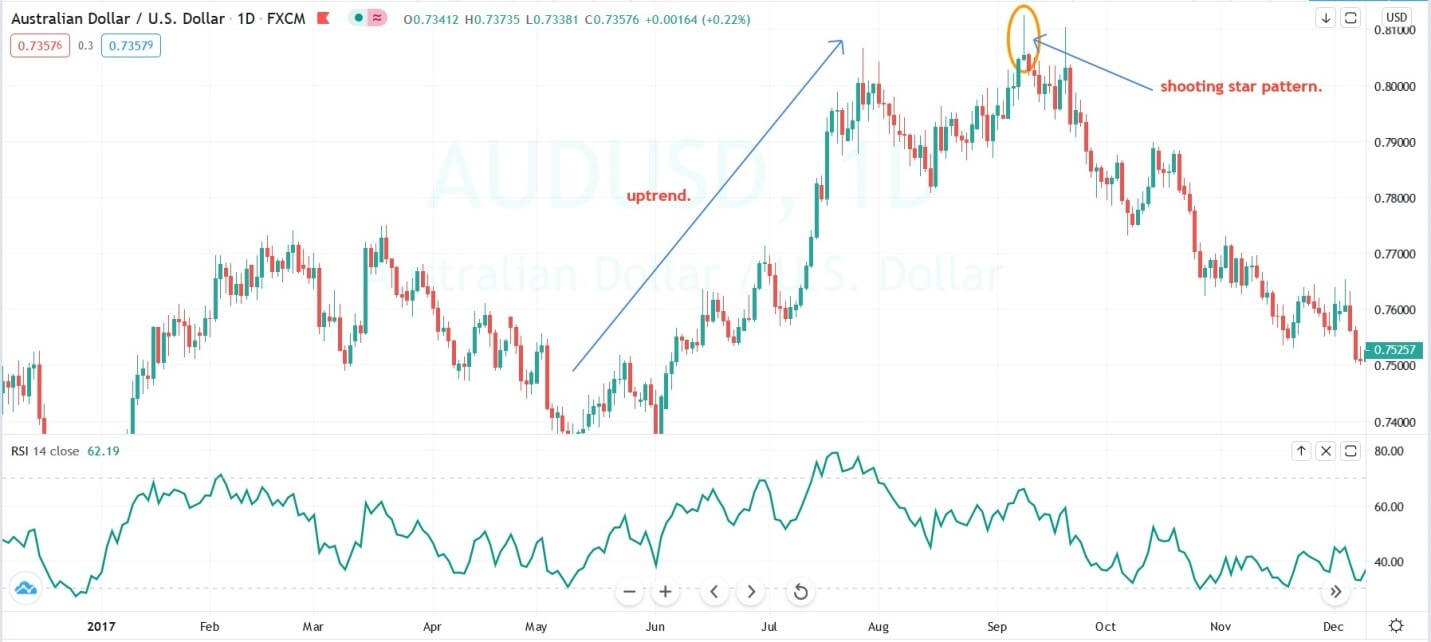
The image below represents the entry, exit and stop loss in the AUDCAD forex pair. The currency on the daily chart was in a strong uptrend, and the appearance of the shooting star pattern at the top of the trend was a sign of upcoming reversal. We took the selling trade when the pattern was confirmed by the RSI reversal at the 70 level.
RSI AND HANGING MAN.
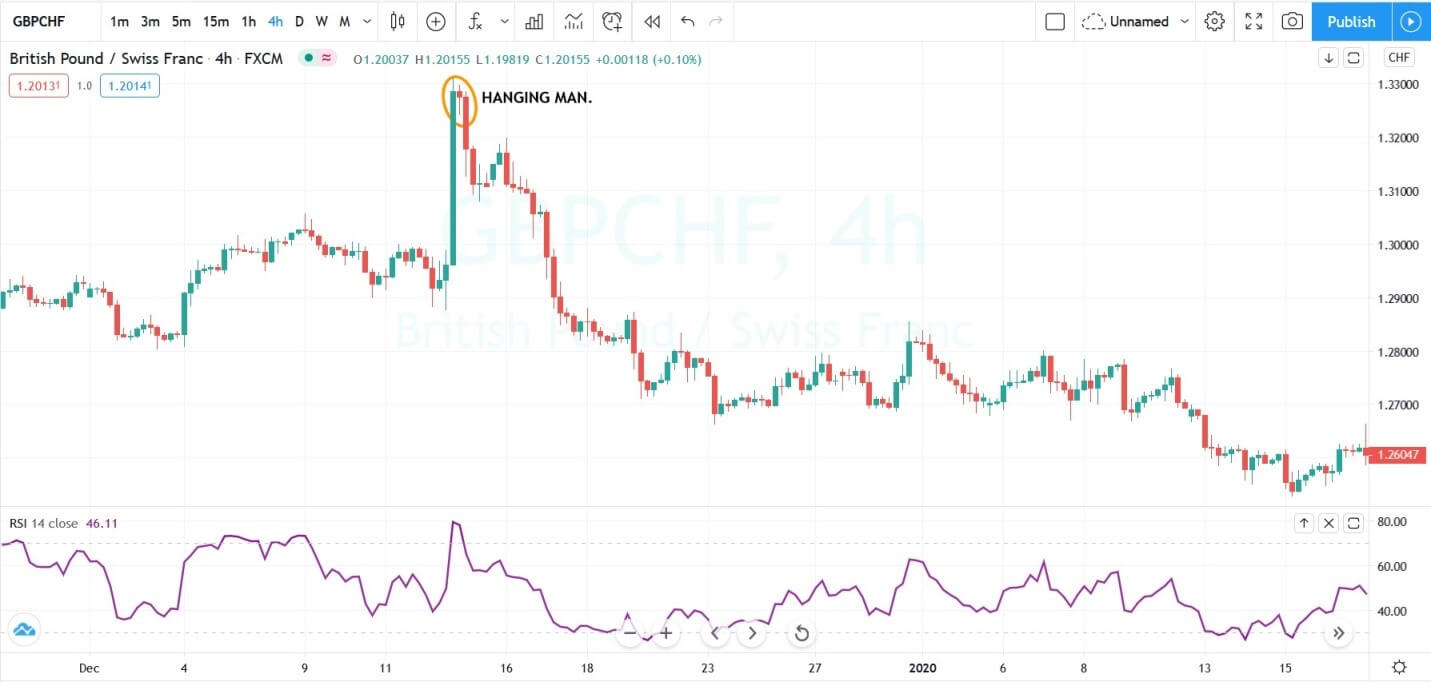
The image below represents the Hanging Man pattern in the GBPCHF forex pair.
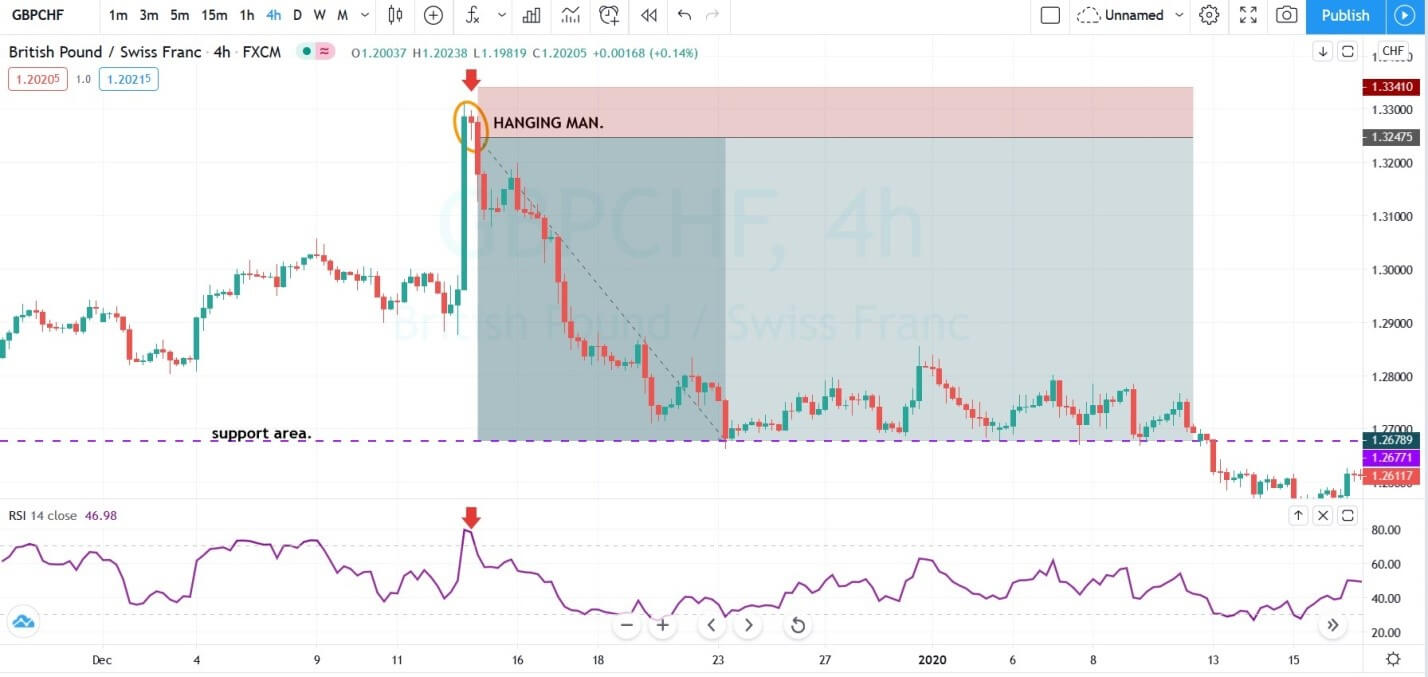
The image below represents the selling trade-in the GBPCHF forex pair. As you can see the market was in a strong buying trend, the one strong green candle is enough to create panic among the chasers, but on the other hand anticipators by pairing the hanging man pattern with the indicator, end up making money. Don’t fall into these type of traps set by the bigger players. Follow your trading strategy very well; If the market is giving you the signal, go for it without any doubt. Your goal is to bet on your edge every time and when you go in negatives close your trade as fast as you can and when it performs go for the bigger targets.
CONCLUSION.
In this article, we shared the four reversal trading patterns with you, the very first one is a bearish engulfing pattern, evening star, shooting star and hanging man. All of these indicators are well proven in the markets; first, master them on demo and use them for trading the live markets. In the markets you will face every type of situations, some time you will find easy trades like the second one we shared above, and some time you will find a hard time just like the forth strategy, don’t go in a panic instead always try to bend yourself according to the situations to stay longer in the game.