

Beginners: analysis feature of MT4 to help find a trading strategy
Thank you for joining this forex academy educational video.
In this session, we will be looking at an analysis feature of the MT4 platform, which helps traders to find a winning trading strategy.

The Metatrader mt4 platform is one of the widest the most available trading platforms on earth. It is fully customisable….
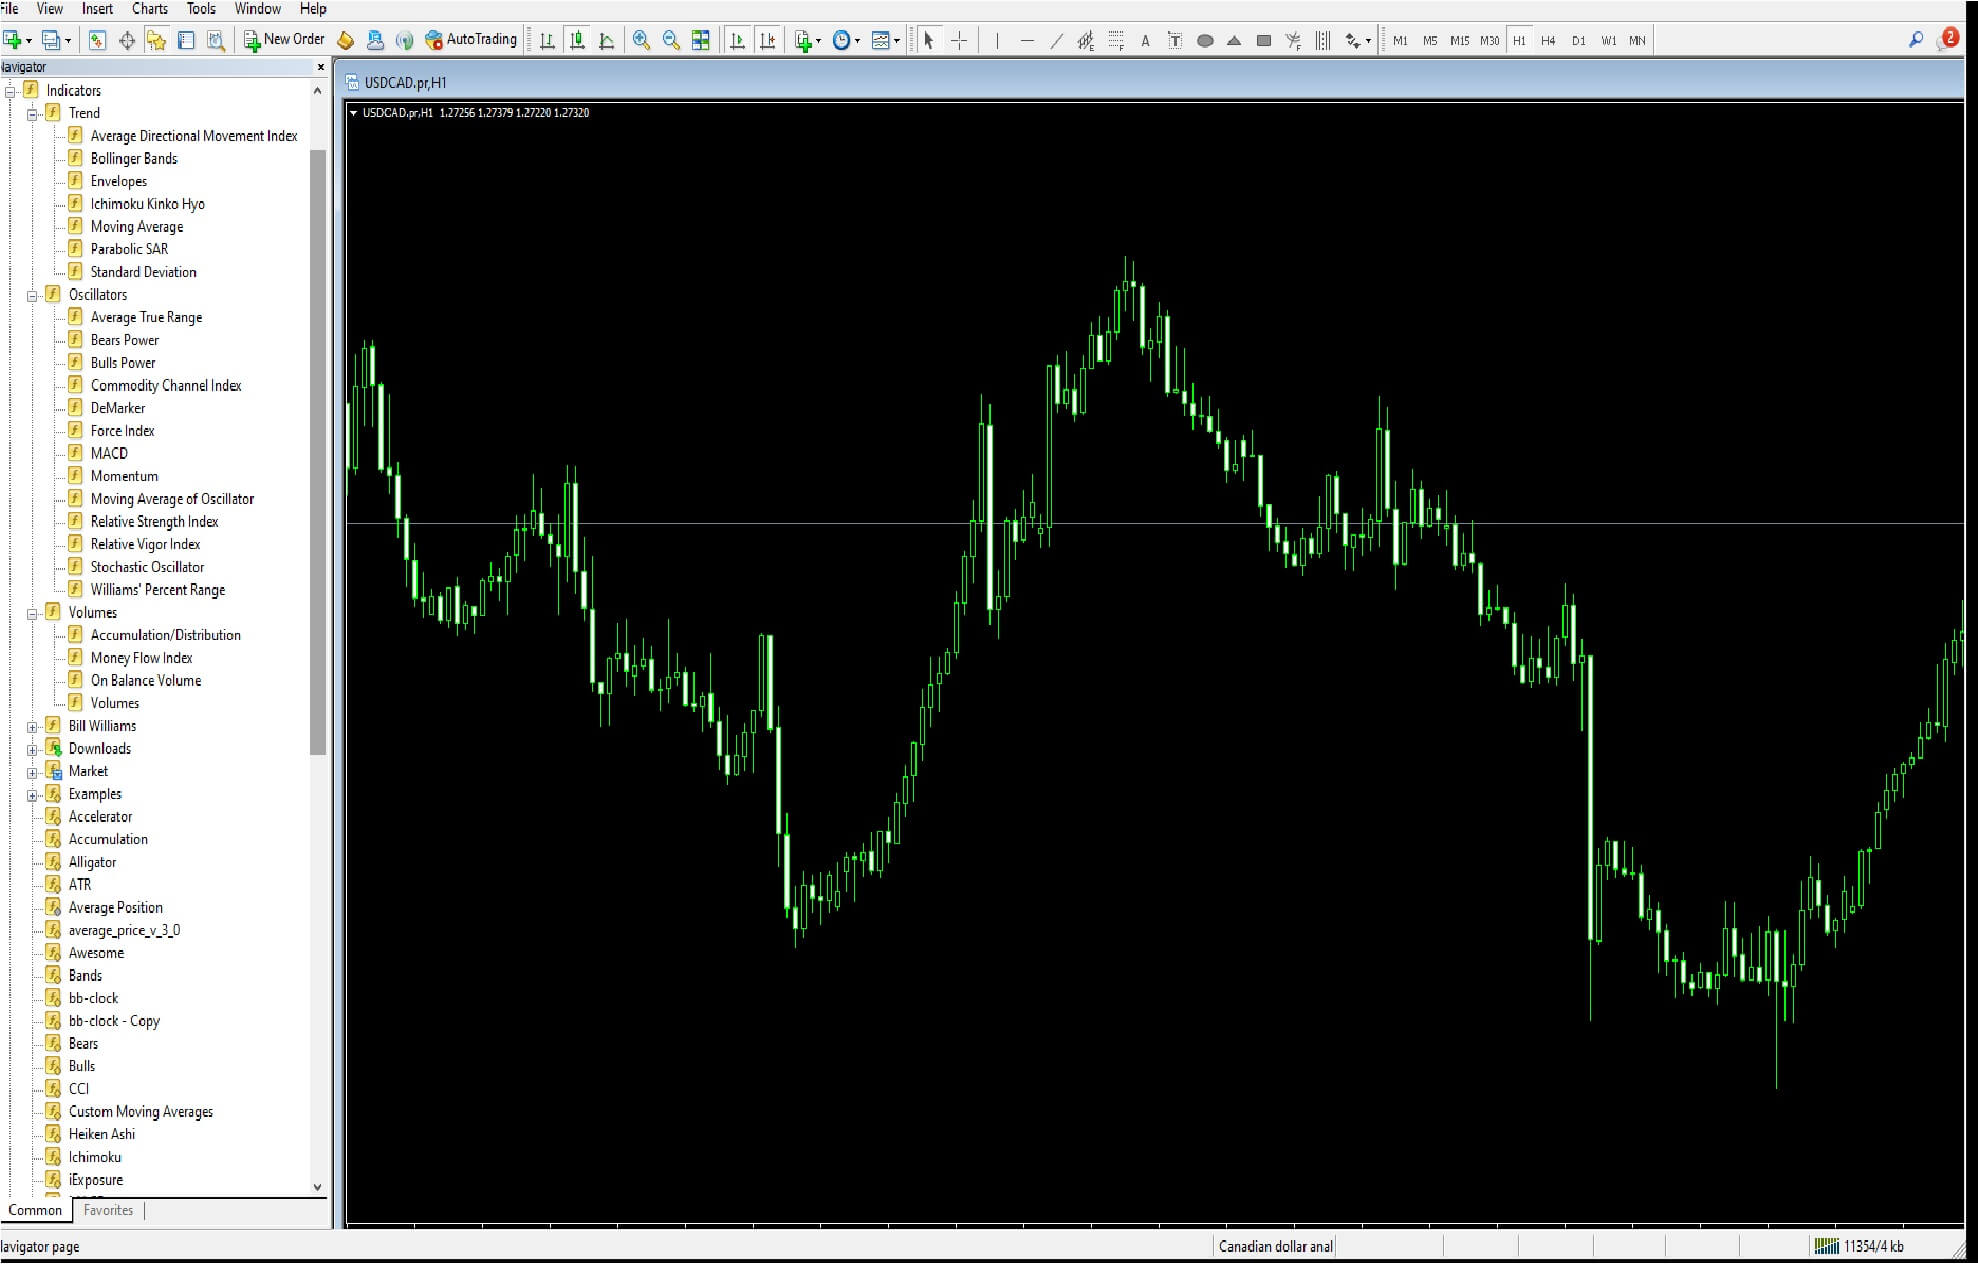
And there are a host of technical analysis tools available in the Navigator section, which are freely available from most brokers, and which can be added to, either freely found ones on the internet or paid tools, which can be mostly found on the mql5 website.
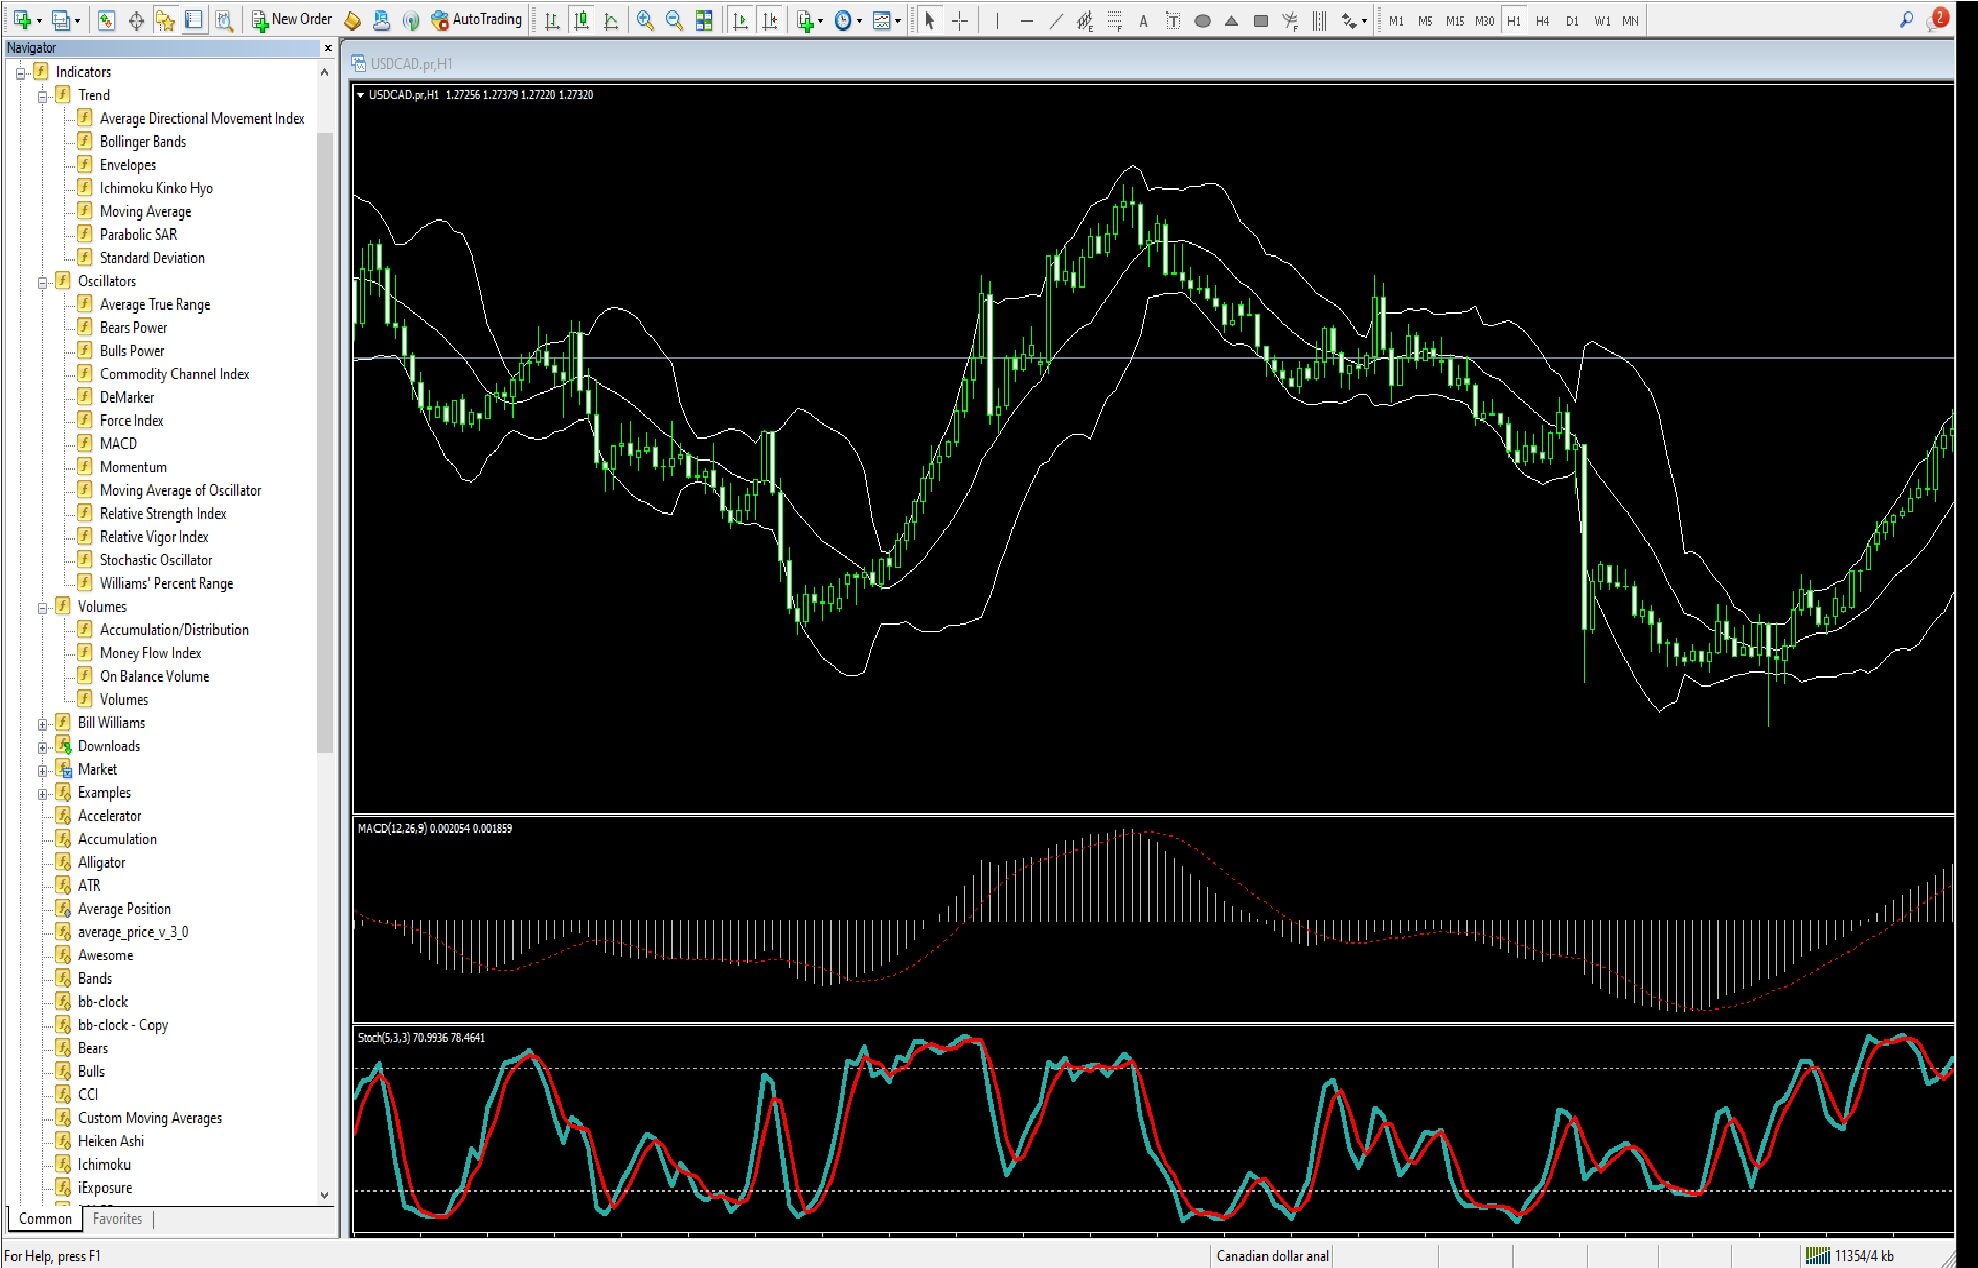
On this one-hour chart of the US dollar CAD pair, we have selected three widely used and popular technical analysis tools from the navigator section, which are Bollinger bands, moving average convergence divergence commonly known as the MACD, and the stochastic oscillator indicator.
Although as a new trader, we must consider many factors when trading, such as fundamental analysis, the time of day while trading, whether or not economic data is due to be released, whether or not political or policymaker decisions, which might affect the particular currency pair we are interested in, are about to make an announcement, which could affect our trade, without doubt, the most critical aspect to trading, and which has the most influence on the movement of a currency exchange rate, is technical analysis. Technical analysis often overrides fundamental analysis and even economic data releases.
While we cannot be in control, as traders, of fundamental reasons for why a particular currency pair is moving in any particular direction, and nor can we control political events, we can become masters of technical analysis, and where we can study our charts and seek out regular and consistent screen trading patterns which can stack the odds in our favour with regard to consistent winning trades, and with regard to knowing where to place tight stop losses to maintain the health of our account balance.
Now chart patterns have a habit of reoccurring, and technical analysis traders know this. Therefore, as new traders, we must find regular and consistent winning setups, and this takes a lot of time as a new trader, and this requires a lot of patience and a whole lot of studying.
Only when we have found regular setups, which consistently work, can we then build a successful trading methodology, which should be adhered to.
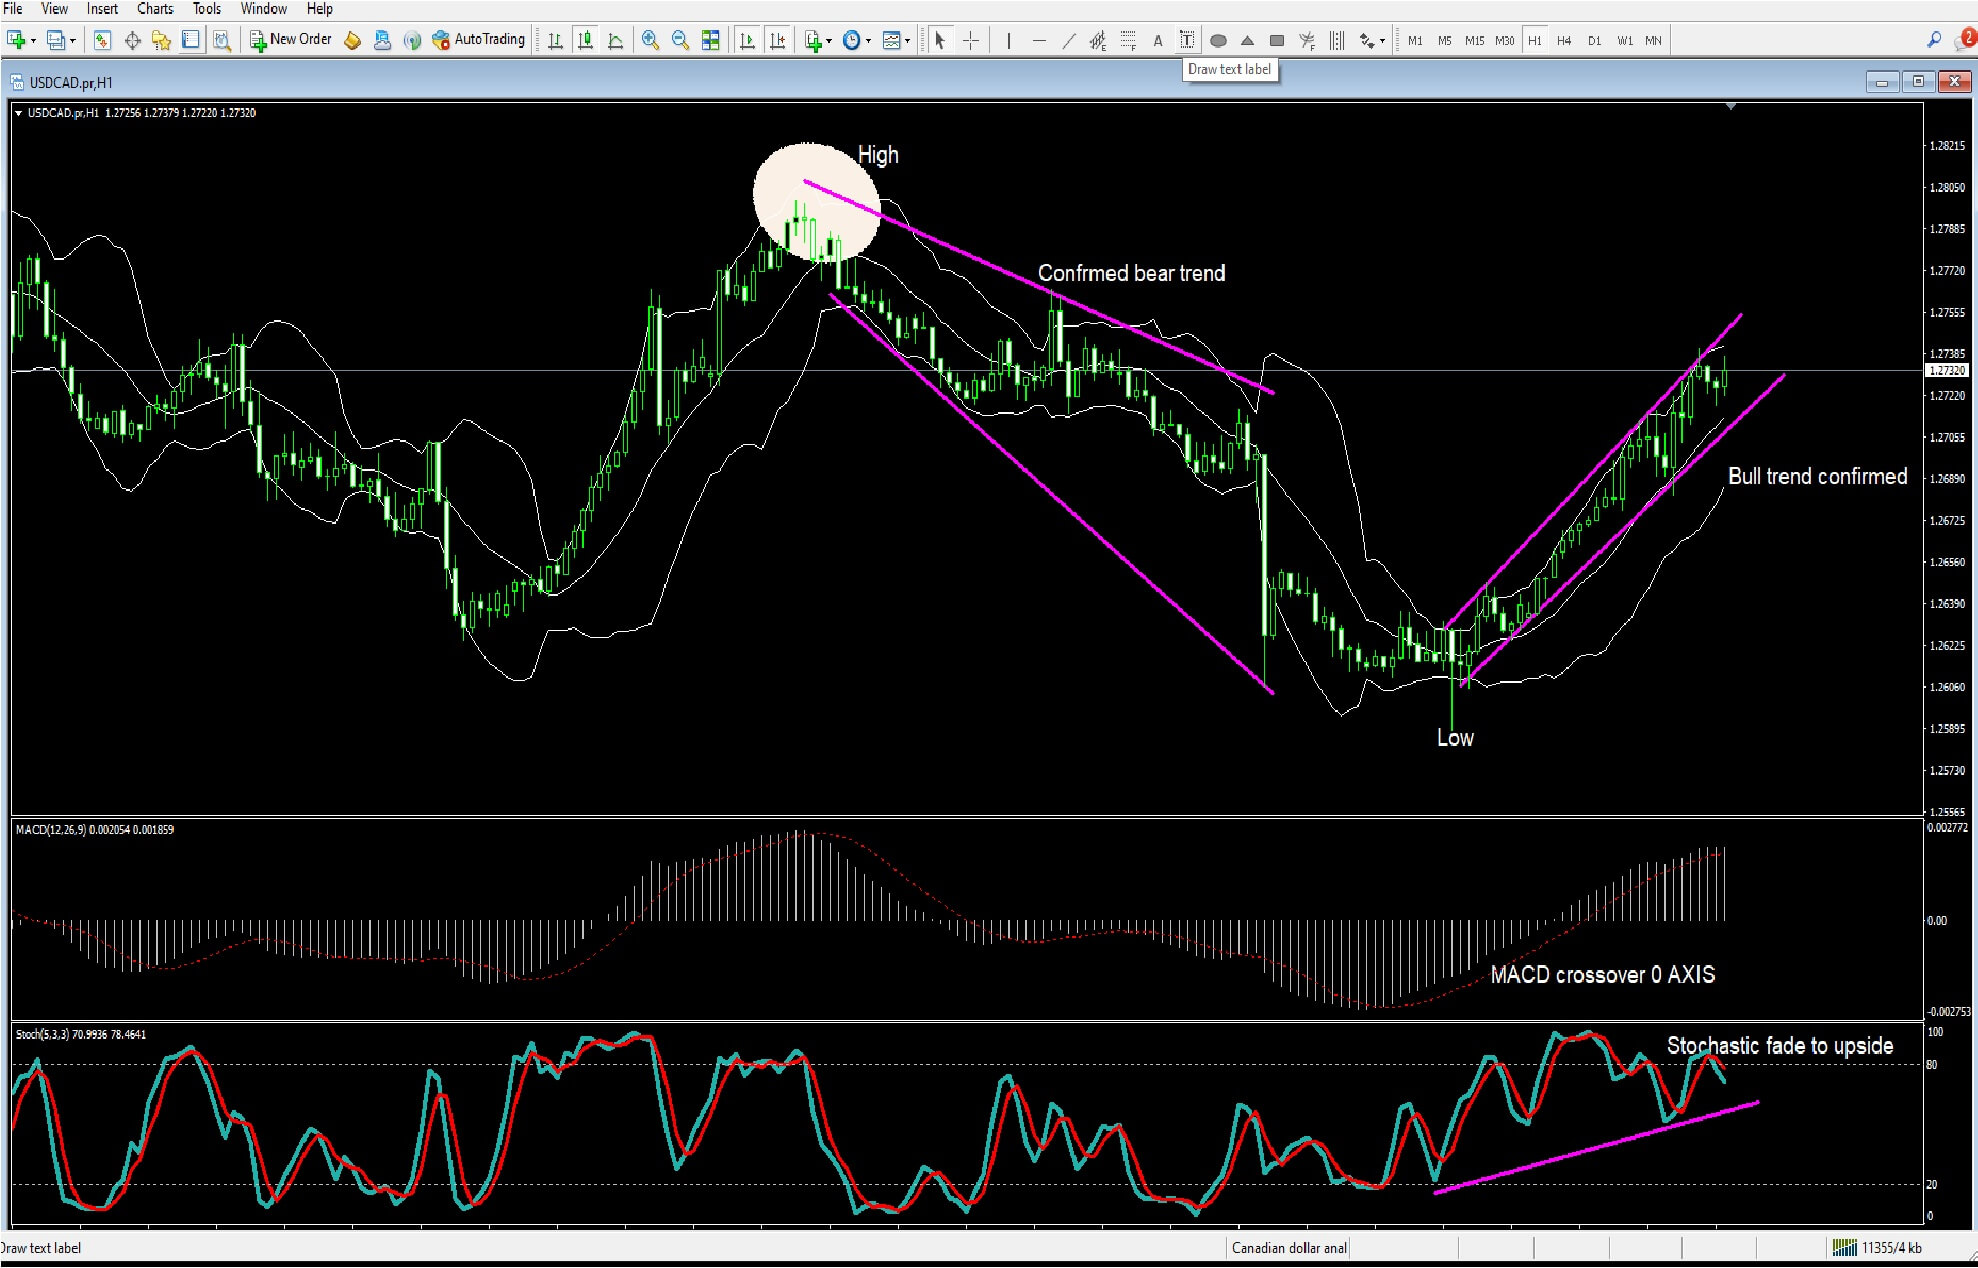
Because these chart patterns are always changing, we can take advantage of the drawing tools such as the ‘’draw text label’’ as highlighted, and where we can make notes on the chart, and because of the flexibility of the MetaTrader platform…..
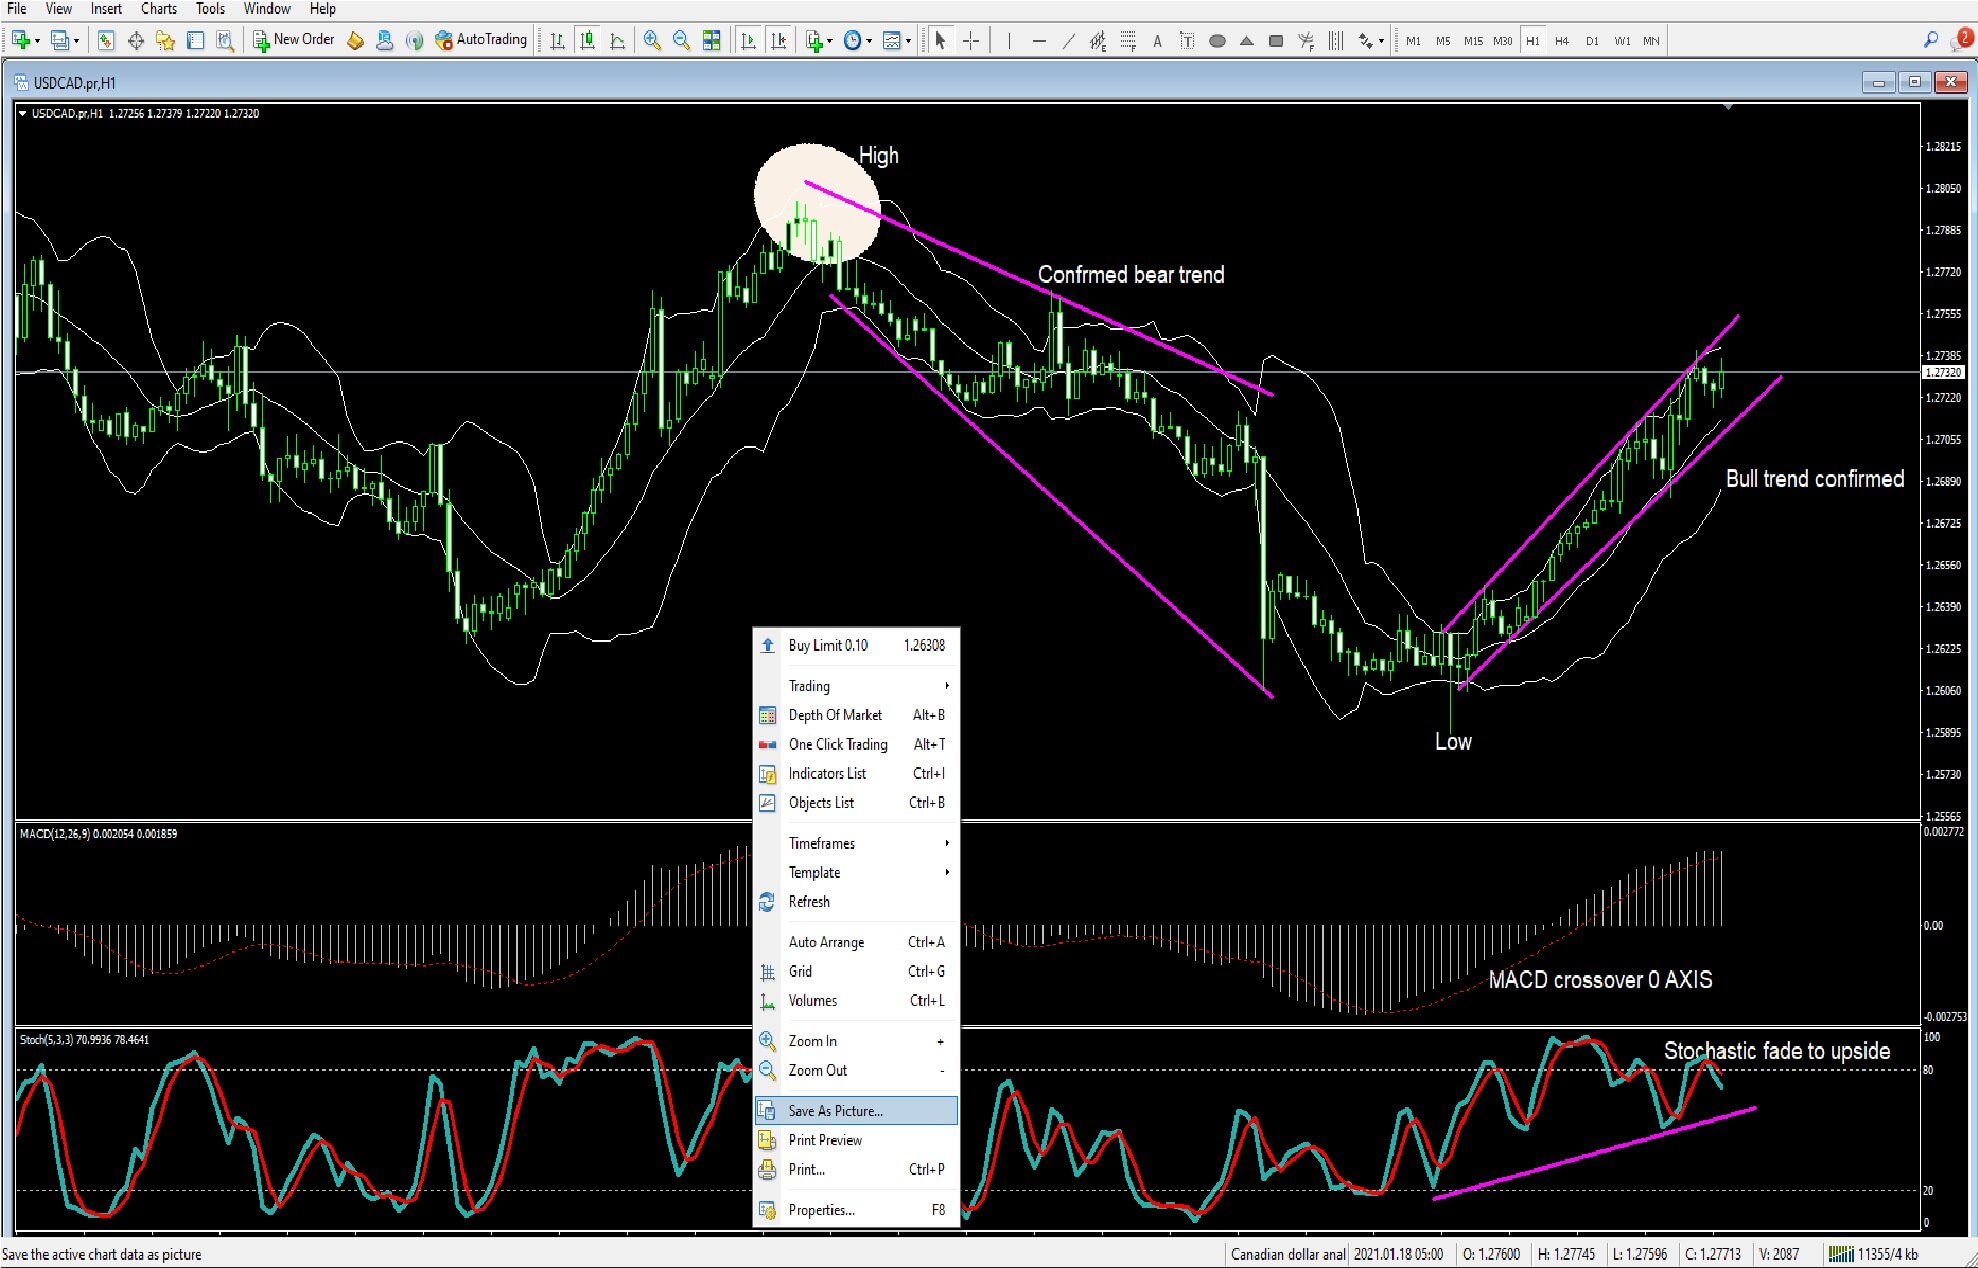
If we right-click on the chart, we have the option to save the chart as a picture for further analysis at a later time.
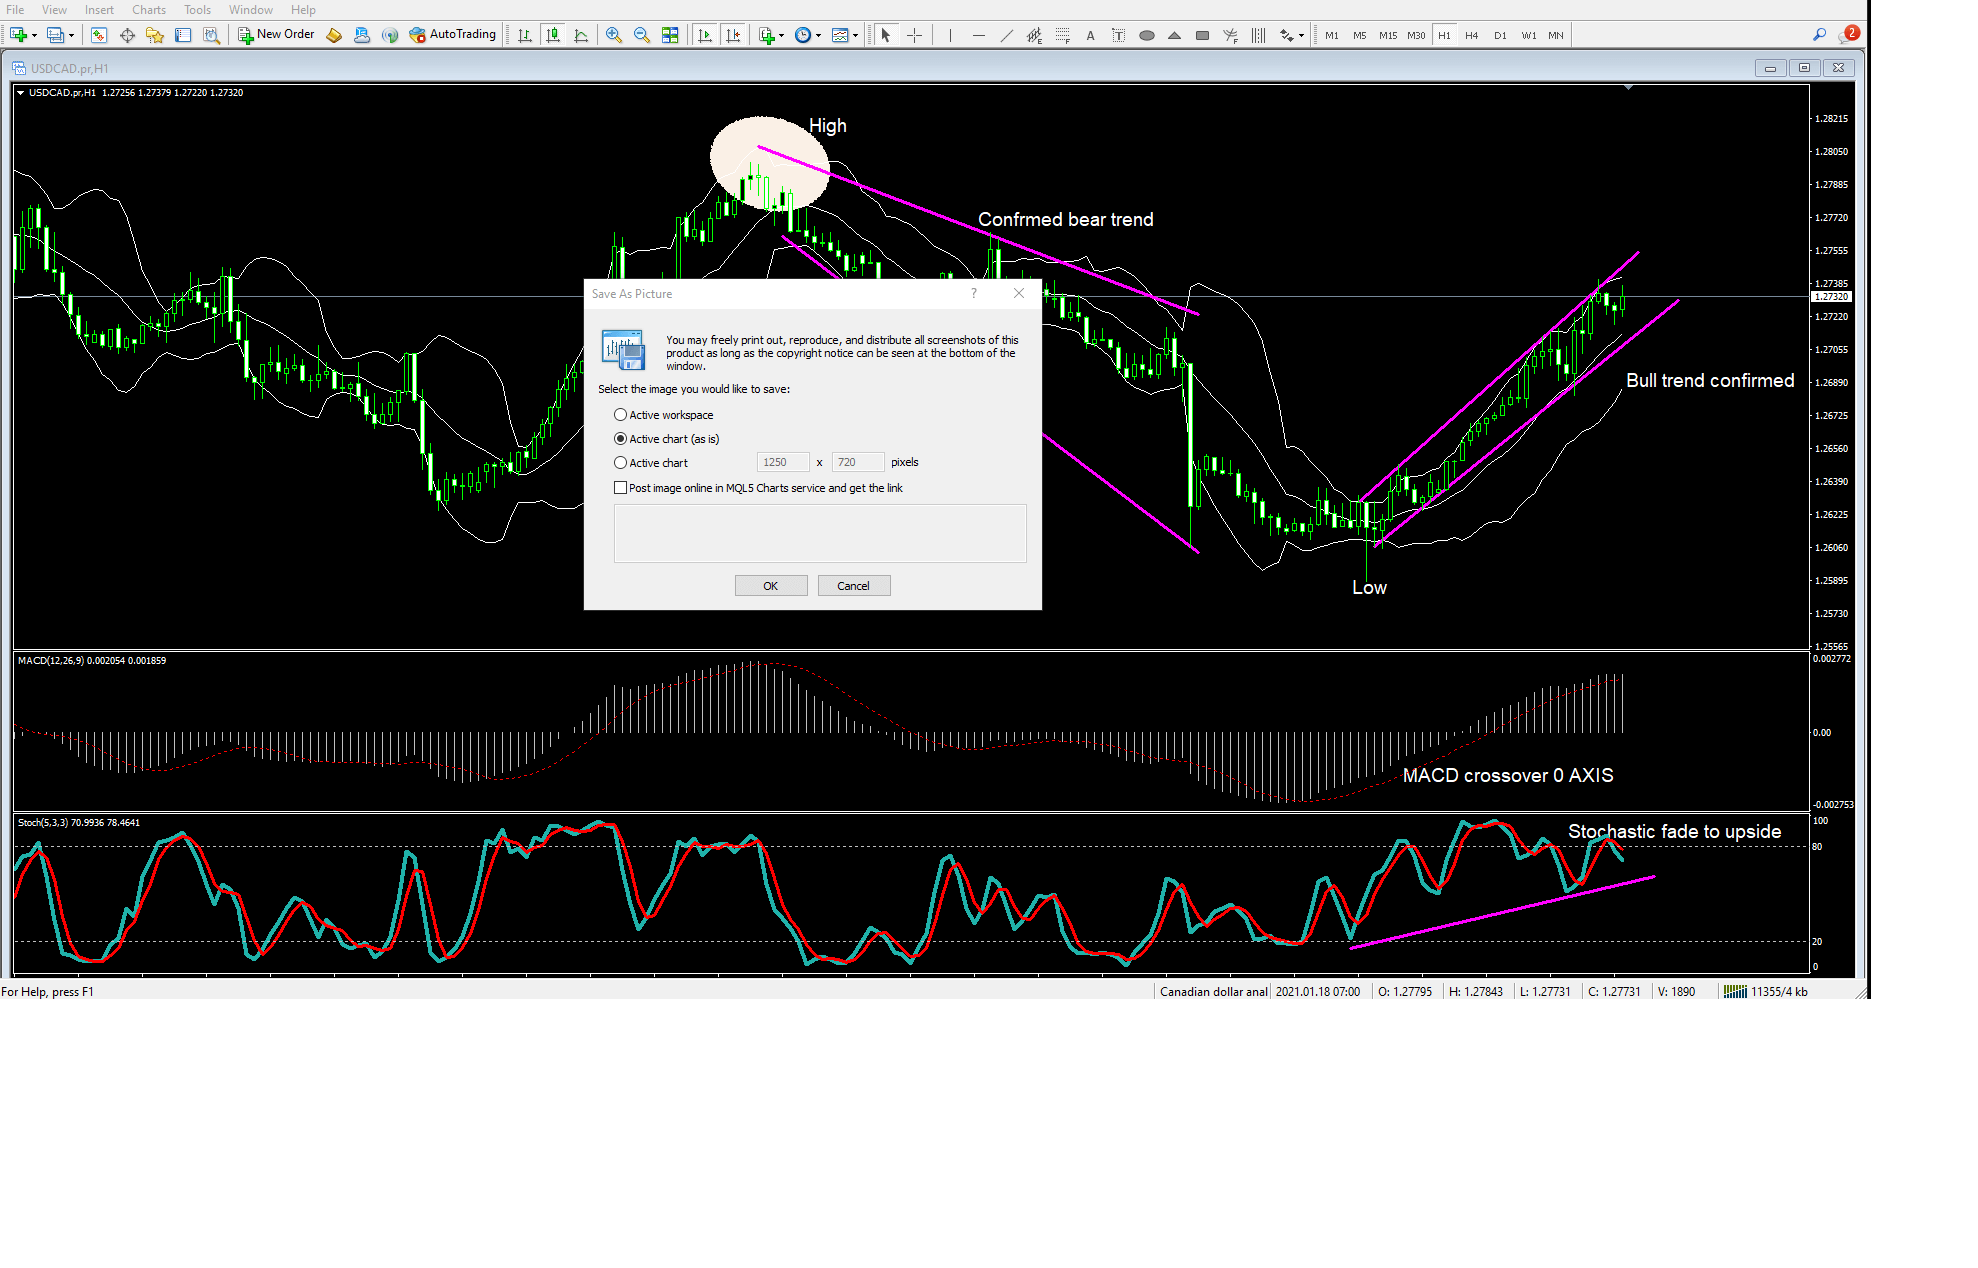
As we see here, to save the chart as a picture, we can set the desired parameters, including the size, and then click ok….
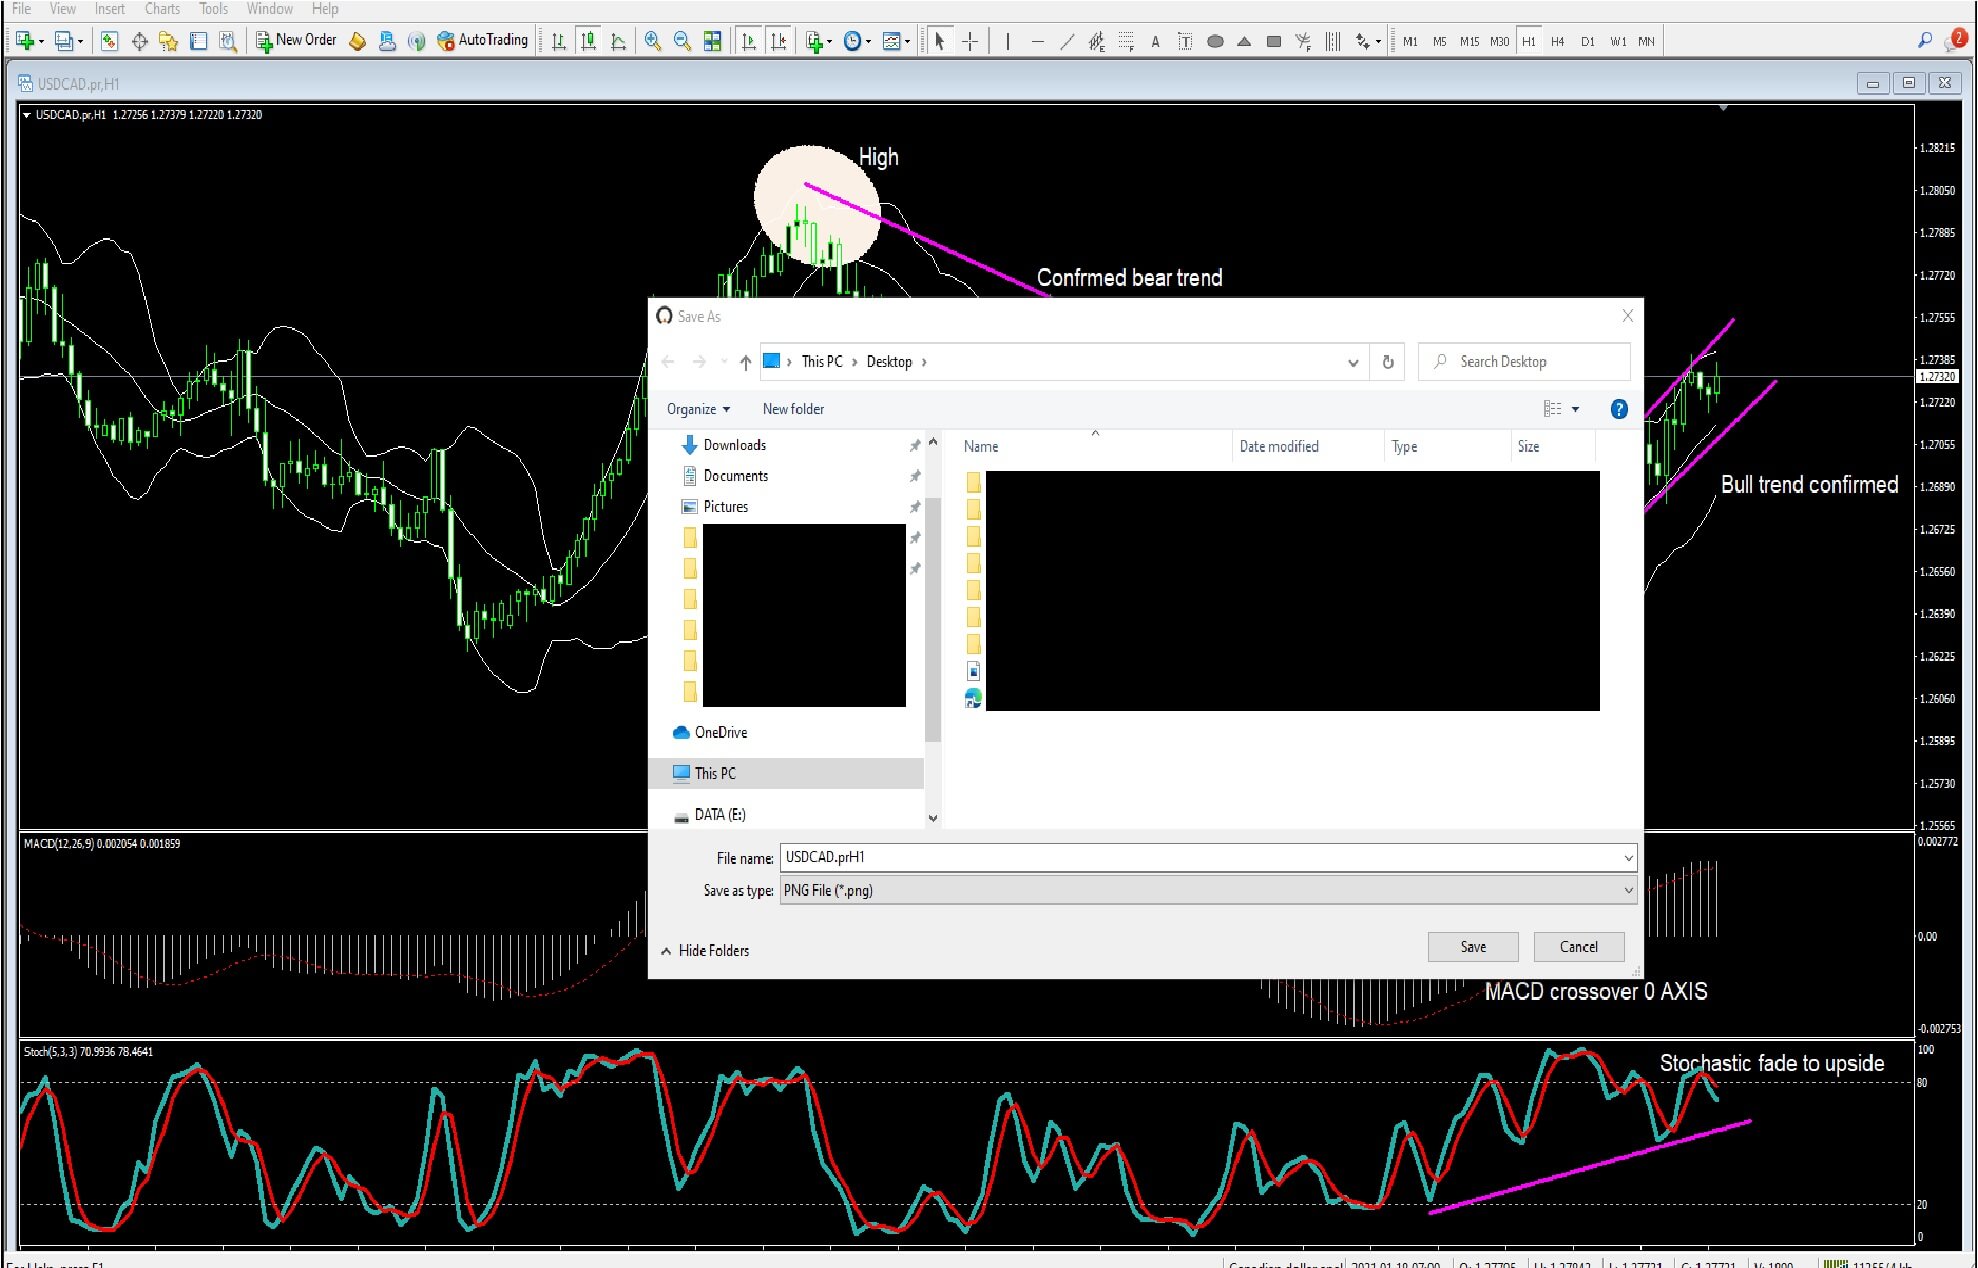
You will then be asked where to save it on your computer, select your destination folder, and save it.
This saves an awful lot of time and alleviates the need to scroll back through hours and hours of charts just to find the setup which you may have been interested in.