Introduction
Trading Strategies Using The Stochastic Oscillator
Oversold & Oversold Areas
This is the basic yet powerful Stochastic strategy that is widely used by most of the traders. The idea is to go long when the indicator reverses at the oversold area and go short when it reverses at the overbought area. Let’s understand this with an example.
The image below is an NZD/CAD Forex price chart. It represents two buying and one selling opportunity in an uptrend. These trades are solely taken based on the strategy that we discussed above.
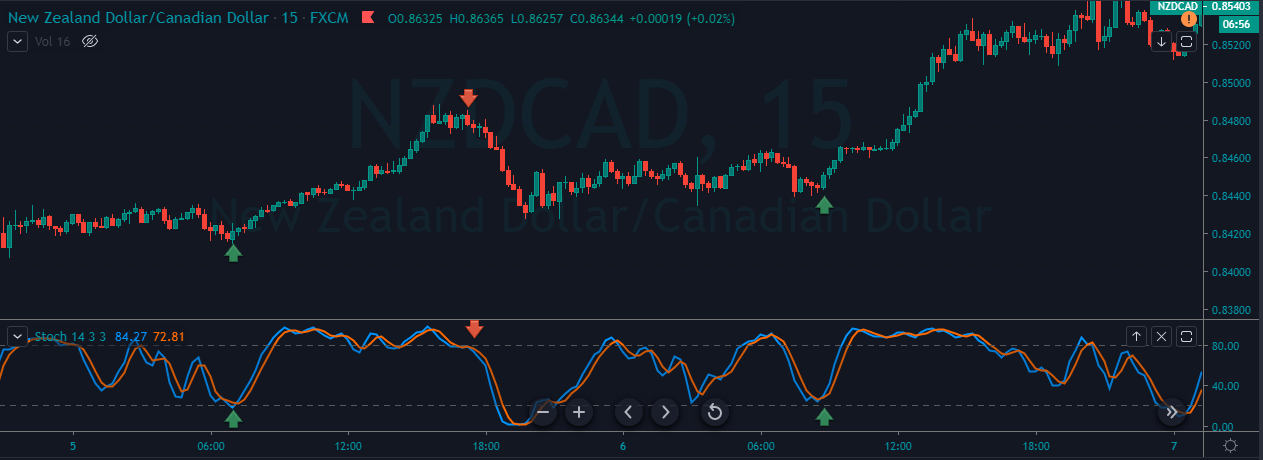
We have placed the stop-loss just below the recent candle and close our position when the market gave an opposite signal. The market circumstances don’t matter as this indicator can be used in any situation. The crucial thing is to follow the rules of the indicator very well.
If the indicator generates a buy signal, only take buy entries, and when it says sell, only consider selling opportunities. If we are in a buy trade and if the indicator represents a sell trade, that is the time to close our position. Never be rigid and ignore the indicator signals to hold the position for extended targets. If that happens, we will be on the losing side.
Stochastic Indicator + Bollinger Bands
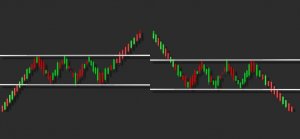
Bollinger band is a leading indicator, and it consists of two bands, which are above and below the price action. This indicator also has the centerline, which is a Moving Average. The bands of the indicator expand and contracts according to market volatility. They expand if the volatility is more and contract when the volatility is less.
Buy Example
First of all, find an uptrend in any Forex pair. When the price action hits the lower Bollinger Band, see if the Stochastic indicates the oversold market condition. If it does, it means that the sellers now have a hard time to go lower and taking buy entries from here will be a good idea.
As you can see in the below image, the EUR/AUD was in an uptrend. During the pullback phase, the Stochastic reaches the oversold area, and the price action hits the lower Bollinger Band. This is an indication to go long in this pair. As we have activated our trade, the price action blasts to the north. We can close our position when the Stochastic indicator reaches the overbought area. If you want to ride longer moves in the trending market, exit your position at the major resistance area.

Sell Example
First of all, find a downtrend in any Forex pair. When the price action hits the upper Bollinger Band, see if the Stochastic is indicating overbought market conditions. If it does, it means that the buyers now have a hard time to go higher and taking sell entries from here will be a good idea.
The image below is the EUR/CHF Forex pair, and the pair was in an overall downtrend. During the pullback phase, the price action turned sideways. But when the price action hits the upper Bollinger Band and the Stochastic indicator reverses at the overbought area, it is a sign to go short in this pair.
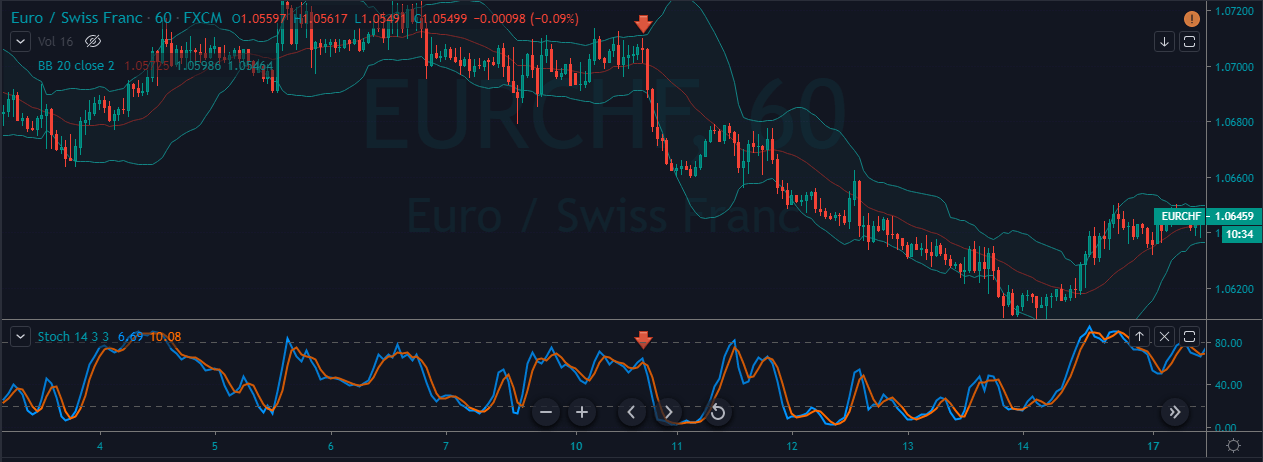
We can place the stop-loss just above the upper Bollinger band, and the take-profit must be at the higher timeframe’s support area. If you are an intraday trader, close your positions when both the indicators give an opposite signal.
That’s about Stochastic indicator and related trading strategies. If you have any doubts, let us know in the comments below. Cheers. [wp_quiz id=”67442″]