Introduction
In the previous lesson, we discussed the concept of retracement and reversal. We also understood how they are different from each other. However, just knowing if the terminology will not help in the forex market. Being able to predict if the price is retracing or reversing is the name of the game because this will significantly bring down your losing trades and increase the number of winning trades.

Retracement or Reversal?
In technical analysis, there are several ways to predict if the market is undergoing a retracement or a reversal. Here are some of the ways to differentiate between the two.
Fibonacci Retracement
Fibonacci retracements are very popular in technical analysis space. They are based on a sequence of key numbers identified by Leonardo Fibonacci, a mathematician.
In technical analysis (trading), Fibonacci retracement is drawn by taking two extreme points on a price chart, which results in different levels or ratios – 23.6%, 38.2%, 50%, 61.8%, and 100%. These Fibonacci ratios are used by traders to determine possible support and resistance levels in the market. Typically, these are the level where the price tends to hold and reverse from the current direction. Having that said, the price does not hold at every Fibonacci level. It holds perfectly only when it is combined with the price action on the charts.
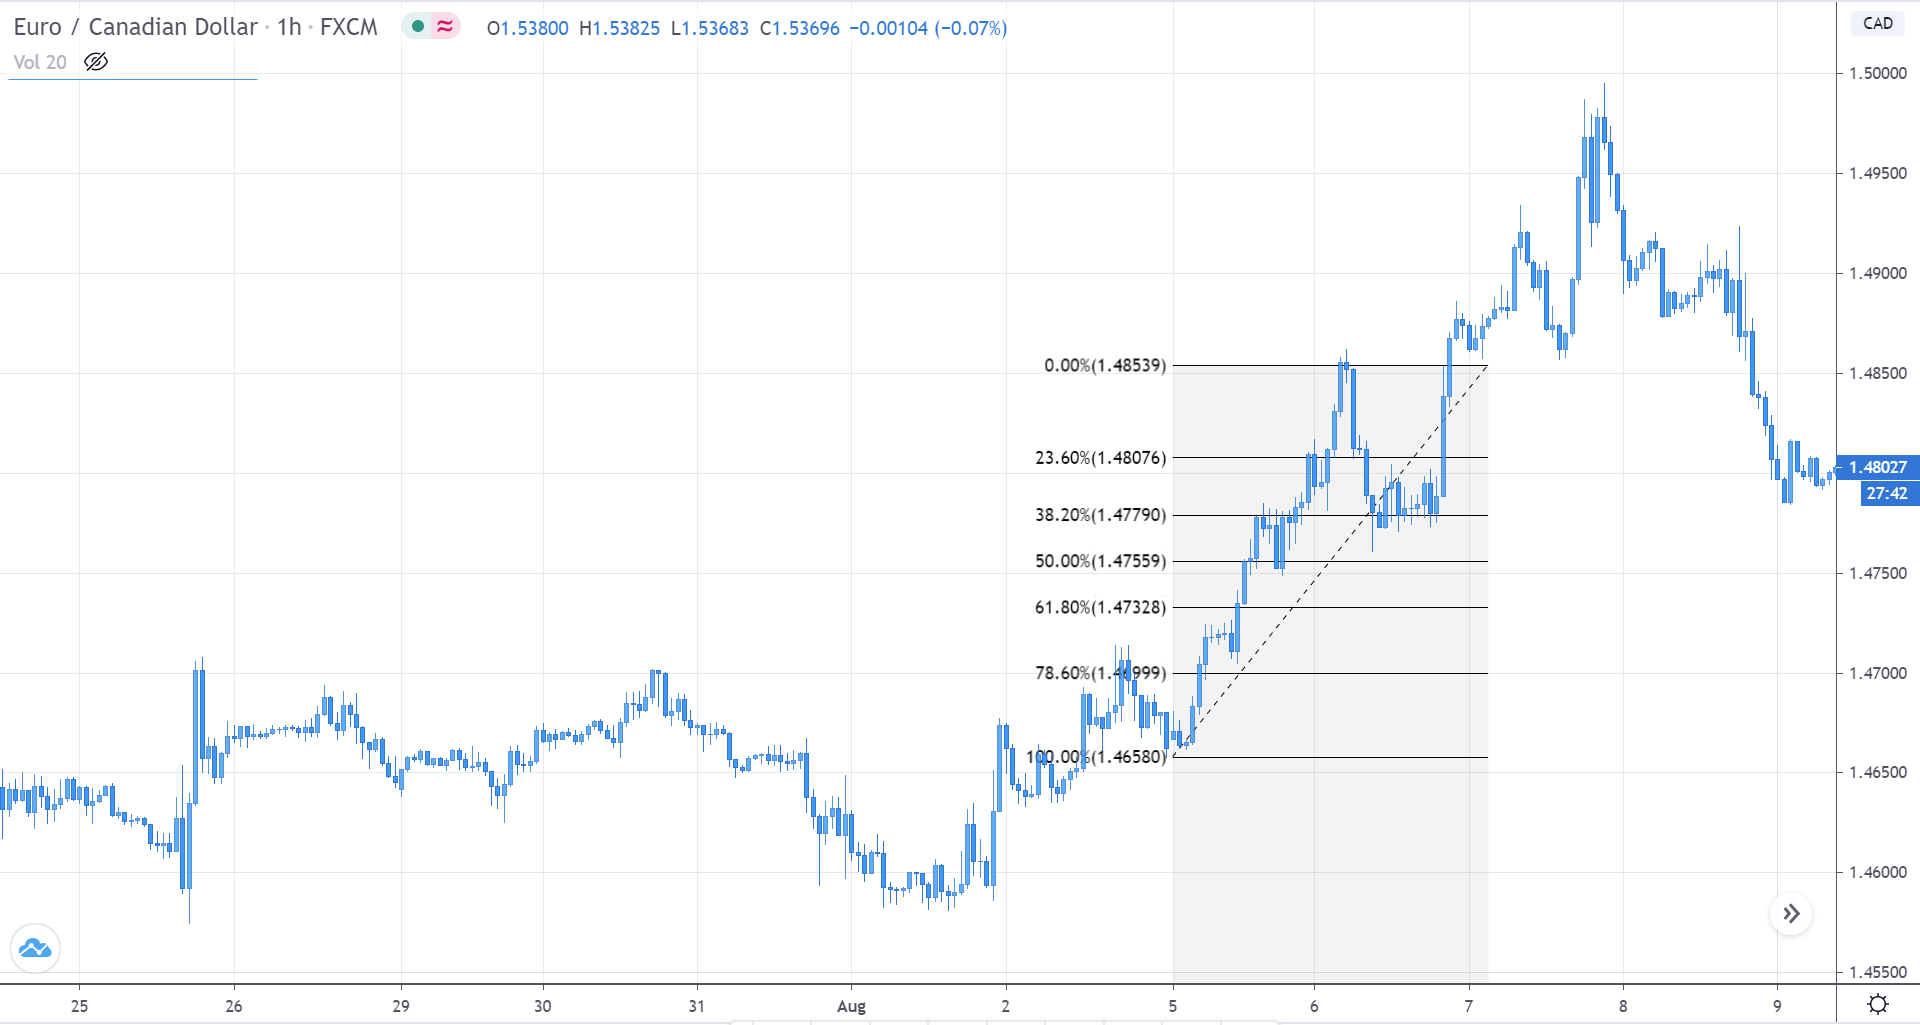
Consider the below chart of EURCAD. In the recent chart, we see that the market is in an uptrend. The grey ray represents the support and resistance level. After making a higher high, the price has retraced to the S&R level.
Now the question arises if this retracement is a pullback to the uptrend or a potential reversal. To figure this out, we shall apply the Fibonacci retracement to the chart.
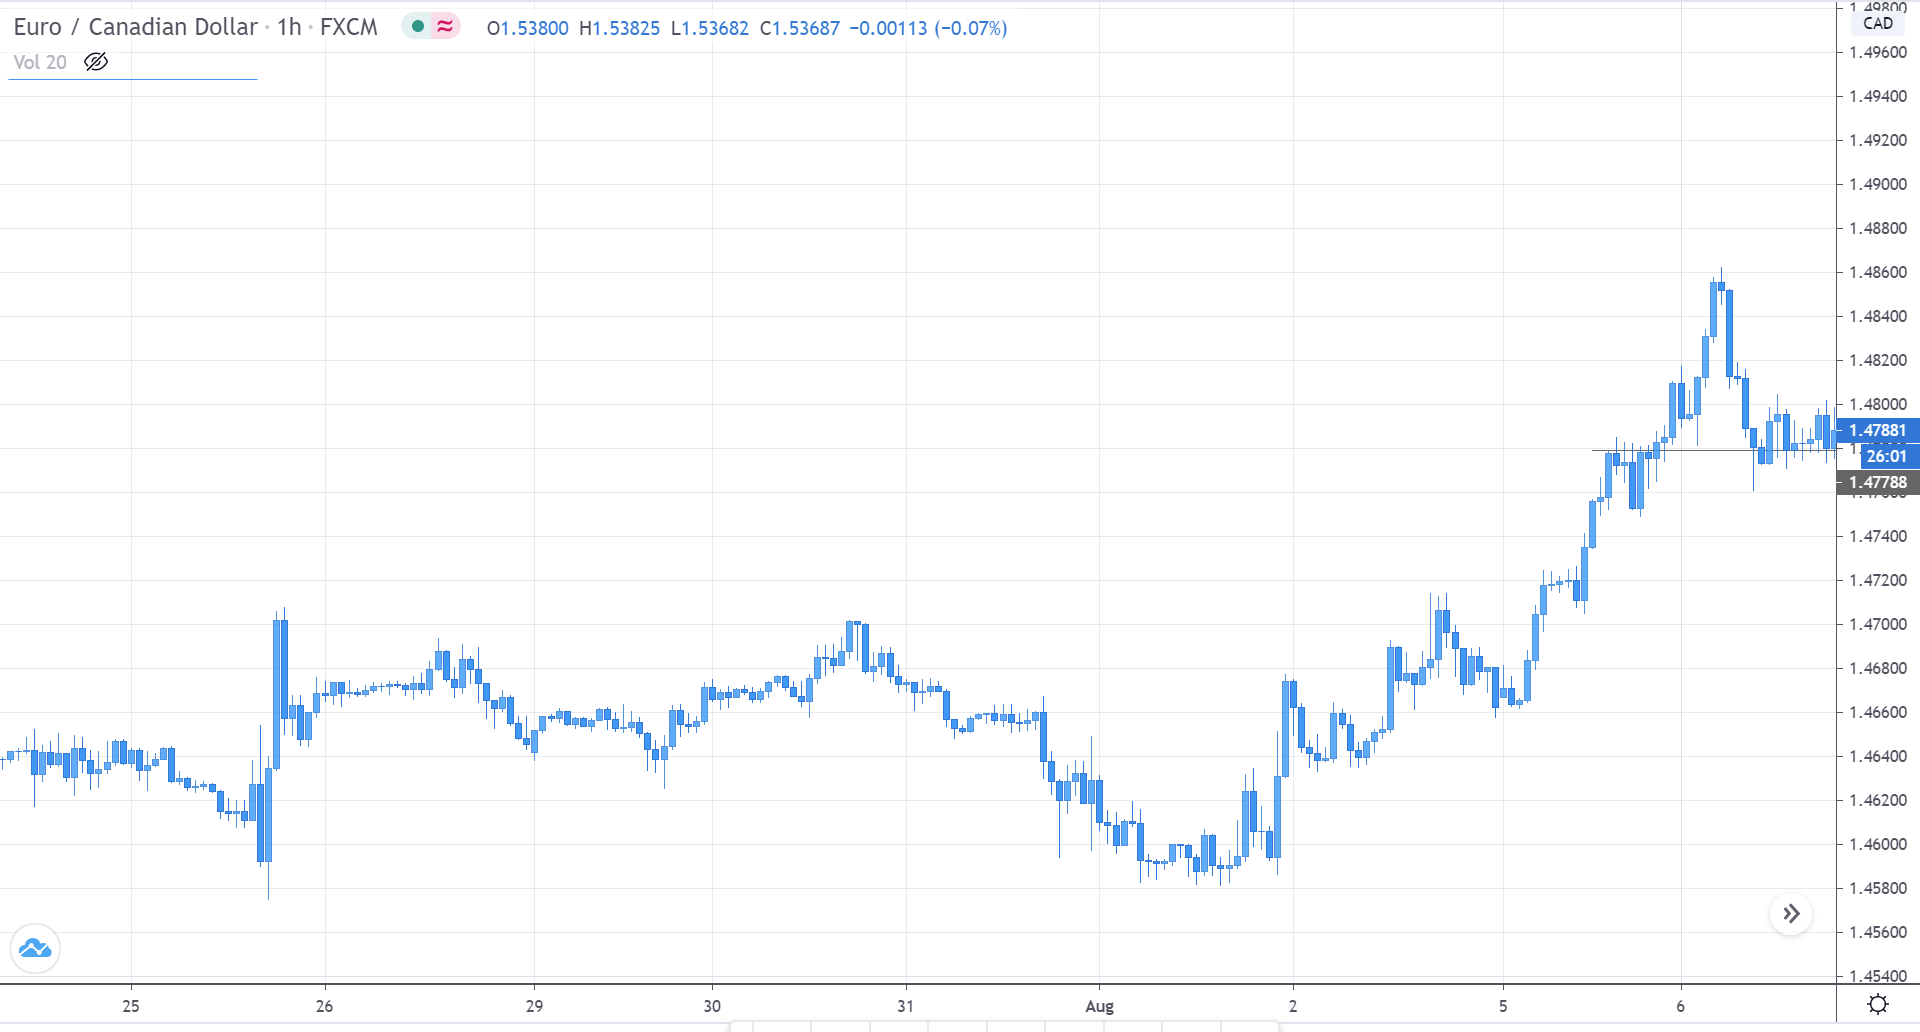
In the below chart, we have incorporated the Fibonacci retracement onto the price chart. If we look at the same S&R level, we see that the price is also holding at the 38% level. Hence, this gives us double confirmation that the market is preparing to head north. And in hindsight, the price does make a higher high.
Market Transition
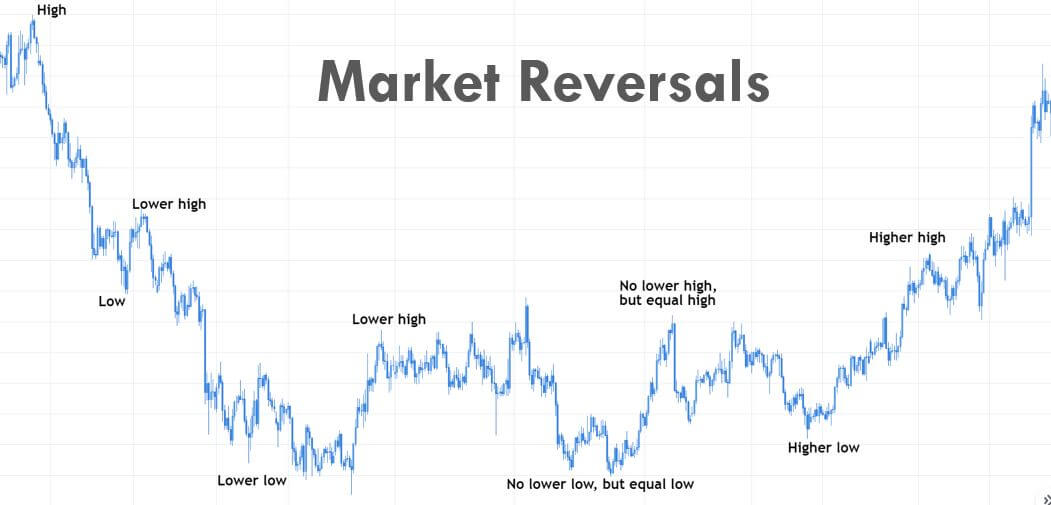
Traders, especially Price Action traders, study the movement in the prices to determine if the market is preparing for a possible reversal. If a market is going for a reversal, the market gives simple yet effective hints and clues about it. The violation from the definition of a trend is the clue that the market is possibly going to turn around for a reversal.
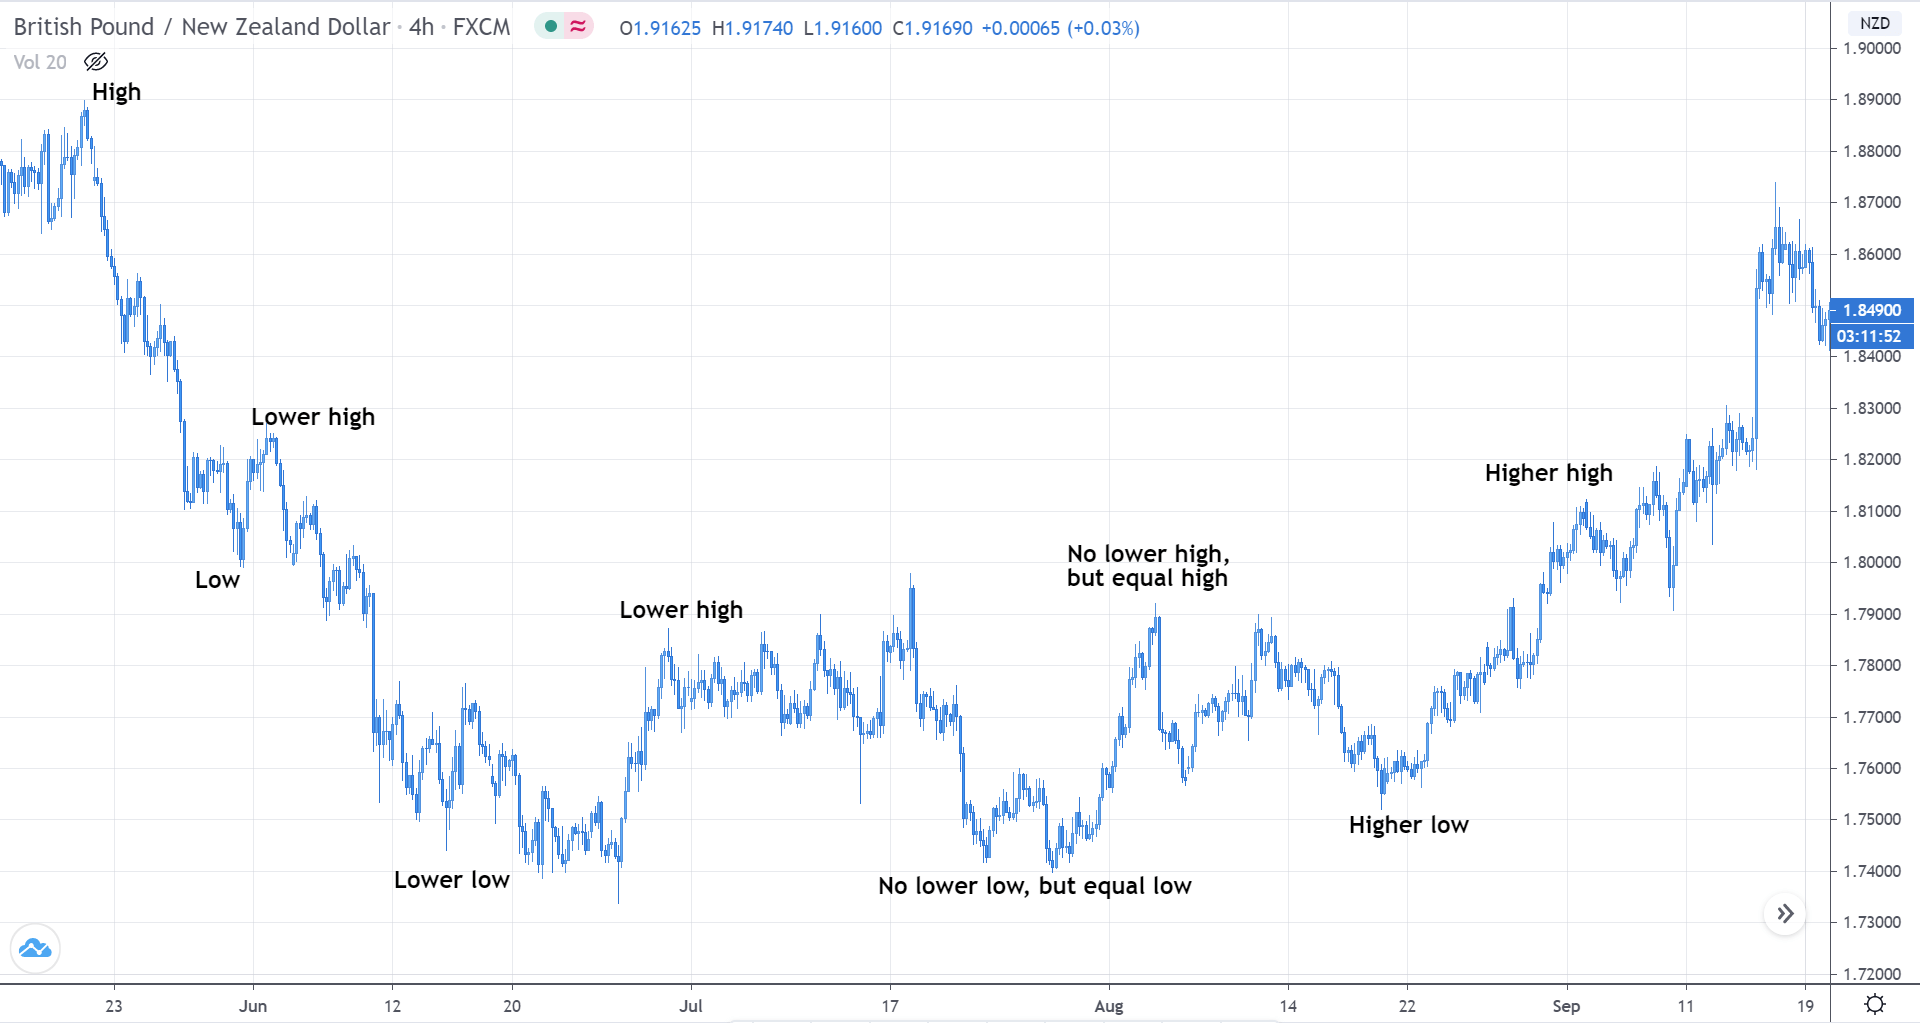
Let us consider the example of a reversal to the upside. Initially, the market will be in a downtrend, making lower lows and lower highs. But, when it retraces and tries to make a new lower low, it leaves equal low. This becomes our first clue on a market reversal. From the point of the equal low, it rallies up but fails to make a lower high.
Instead, it makes an equal high. These two hints are an indication that the price is not moving according to the definition of a downtrend, and there could be a possible reversal. To confirm the same, we wait for the price to make a higher low. If it does make a higher low, instead of a lower low, we can predict that the market is preparing to head north.
Below is a self-explanatory illustration for the above explanation.
Take the below quiz to check if you have got the concepts correctly. Cheers! [wp_quiz id=”79321″]