Categories
Beginners Forex Education Forex Assets

The Connection Between Crude Oil and the Climate Emergency

About ten thousand years ago in the world, there were about five million people; 9,000 years later, the figure was over 300 million. And just as we started consuming large amounts of oil, the world’s population increased by 5 billion people in 80 years.

We can easily see that the population increase, the eradication of a large percentage of global poverty, the increase in life expectancy, the reduction in hours worked, and the increase in the quality of life with the consequent increase in per capita energy consumption, It has only been possible to achieve this by burning huge quantities of oil.

At the present moment, humanity is at a crossroads and has to choose between two paths that seem very different, but, curiously, the end result will be the same in both cases.

Let’s look at the two possibilities:

1 – We believe Greta’s grace of the climate emergency. We start shutting down coal-fired power plants, of course, nuclear power plants, we reduce CO2 emissions a lot, we put an expiration date on fossil fuels and we increase the prices wildly for the rights to pollute.

2 – Or, on the contrary, in a short time Greta goes out of fashion and nobody does anything of everything proposed (most likely option). Even if the subject is still on TV, people are likely to talk a lot and do nothing. It may become a fashion very similar to slimming: everyone says that when the holidays are over they will take the diet seriously, but obesity figures are increasing every year.

As I said before, whether option 1 or option 2 occurs, the result is that the world’s population will collapse in the next 30 or, at most, 50 years. If fossil fuel consumption is drastically reduced and CO2 is severely reduced, the world’s population will plummet. Then we will talk about the possibility that renewable energies can replace fossil fuels. If the climate emergency fails to reduce crude oil consumption (the most likely option), the result will be the same, as crude oil will reduce itself anyway.

Look at the Problems of Renewables

Given that sooner or later the decline of oil will come, we will have to analyze whether renewables will be able to sustain the current model of society with the world population growing at a rate of 80 million consumers per year.

Hydropower is the best renewable energy of all, but it suffers from an unsolvable problem: at present, there is almost no increase in production, because you cannot put reservoirs where there is no abundant water. We cannot, therefore, trust that this type of energy can greatly increase its production and will solve our problems of scarcity.

Solar energy has several problems that I will list below:

1 – It is an economically unviable energy. This serious problem is now solved with subsidies; increase in the price of electricity; budget allocations from taxes to make this energy viable; cheap credits for facilities; negative interest for those investing in solar farms to settle for a miserable return; bad loans for the manufacturing industry, which is also happening with the debt of shale oil companies, that will result in the largest debt default since the subprime.

People do not relate that, to pay for everything said in the previous paragraph, you have to consume abundant and cheap energy that creates wealth with which to pay for the losses produced by renewable energy. Nor does anyone think how and where the wealth will be obtained to pay those subsidies when there is no oil to burn.

Logically, the manufacture of solar panels and the machinery that makes solar panels is done by burning oil. Can they still be produced when there is no oil? People have assumed as a dogma of faith that science advances that it is barbarity and that soon they will invent something that is able to circumvent the laws of thermodynamics. 

2 – The permanent supply of renewable energy (except for hydropower) cannot be assured. To cover the cuts in the supply of renewable energy, there is no choice but to double the installed power with fossil fuels. How will this problem be solved when the only fossils left are the usual politicians and do not produce energy?

Doubling the facilities doubles the investment, and when you double the investment with the same profits, the return drops by half.

We return to the same vicious circle: the State subsidizes electricity companies to invest in unprofitable facilities. Subsidies are paid from taxes. Taxes are a part of the benefits or wages of individuals or businesses. And those benefits come from burning a lot of cheap, abundant oil. At a time when oil is neither abundant nor cheap, the circle is broken and all the lies of politicians (who even believe themselves) clash head-on with the bitter and crude reality.

3 – Battery safety is another difficult problem to solve. When it comes to increasing the energy density of batteries, the danger of fire or explosion increases too much.

4 – Who will invest in solar gardens when interest returns to 5%? And if the cost of electricity increases exponentially, will it be possible to generate wealth by producing products with such a high cost of electricity? Look, I’m talking about wealth, not paper money.

5 – Agricultural tractors and heavy machinery are currently not powered by electricity. So, is there a possibility of trading in the future? After reading point 3, I am not clear.

Most of these points are for windmills.

It is unlikely that the current standard of living can be maintained; the welfare state, which is another way of saying the welfare of the State; the 80 million annual increase in the world’s population, in addition to the increase in life expectancy. All that without oil is unsustainable.

Oil has enabled an increase of 5 billion people in 80 years. Without oil, the world’s population will fall to at least half of what there is now. The sharp decline in the world’s population brings us good news and bad news: the bad news is that future pensioners will be paid just enough not to go hungry but without whims. The good news is that the climate emergency will have cured itself. If there are only half the people consuming energy and polluting, everything goes back to its natural course.
Once we admit that the world’s population is going to be in the middle, we still have two options to choose how we want the population reduction to happen. We can choose to reduce the population to good or bad. As I know the human species, I have not in vain related to bipeds since I was born, my prognosis is that they will not choose either option, and reality will lead us to the bad option.

The bad option is to do nothing, to continue living in an unreal world of dream fantasies, and when the reality of the oil shortage is imposed and everyone exclaims stupefied who would imagine it? It’ll be too late to plan anything. The population will shrink with an exponential increase in resource wars, violence, looting, vandalism, hunger, misery, and deforestation from the cutting of wood for cooking and heating.

The good option is planning. It’s not about killing people, it’s about encouraging people to have fewer than 2 children. What happens is that no politician ever accept or propose to lower the birth rate, because of the following:

“People have been embarked on the pyramid scheme of pensions, also called the Ponzi scheme. All pyramid scams are based on the shape of the pyramid: there has to be a large base of people paying and a small peak of people collecting.”

Categories
Forex Course

201. The Relationship Between The US Dollar & Crude Oil

Introduction

There is a strong and rather undiscovered string that brings together currencies and crude oil. Price actions in one area, it forces opposing or sympathetic reactions in the other. Such a correlation persists for different reasons that include the balance of trade, resource distribution, market psychology, etc.

Additionally, crude oil makes a considerable contribution to deflationary and inflationary pressures that reinforces the inter-relationships amidst the trending periods, to downside and upside.

The Relationship Between The U.S. Dollar and Oil

Oil is quoted in U.S. dollars; therefore, each downtick, as well as an uptick in the currency or in the communities price, create a direct realignment between the numerous forex crosses and greenbacks. Such movements are not that correlated in countries without major crude oil reserve.

The Changing Scenario Of Oil Correlations

Many countries harnessed the crude oil reserved amidst the historical rise of the energy market between the 1990s and 2000s. Borrowings were made excessively to develop infrastructure, execute social programs, and expand military operations.

Post the economic collapse of 2008; the bills came to sue wherein some nations delivered whereas the others decided to double down by borrowing more against the reserved in order to rebuild the trust among their impacted economies.

The substantial burden of debt assisted in keeping high growth rates until the price of the global crude oil collapses in the year 2014. This also threw commodity-sensitive countries in a recession zone. Brazil, Canada, Russian, etc. experienced a struggling period for a couple of years while they adjusted to the plummeting values of their currencies. However, they did make a comeback between 2016 and 2017.

The pressure to sell more has spread across different groups of commodities, increasing concerns related to global deflation. Subsequently, it strengthened the correlation between commodities that were affected that include economic centres without major commodity reserves and crude oil.

Moreover, currencies in countries that have major mining reserves but inadequate energy reserves witness reduced currency value in comparison to oil-rich countries.

The U.S dollar has benefited from the decline of crude oil because the U.S economic growth is for some odd reasons compared to the trading partners, maintaining the right balance.

[wp_quiz id=”97491″]
Categories
Forex Course

200. The Correlation Between USD/CAD Pair & Crude Oil

Introduction

Crude oil, also known as black gold, is the major energy source that runs the economy. Canada is among the top oil producers in the world. It is one of the major oil exporters to the USA. Canada exports more than 3 million barrels of petroleum and oil products, a figure that is sufficient to impact USD/CAD’s movement.

USD/CAD and Crude Oil – The Correlation

The volume of crude oil that Canada exports to the US generate massive demand for the CAD. Moreover, Canada’s economy depends a lot on its exports, and approximately 85% of the country’s exports go to the US.

Therefore, the value of USD/CAD is significantly impacted by how the consumers in the United States reach oil prices. If the US’s demand increases, manufacturers have to order more oil to cater to the rising demand. This can result in rising oil prices, thereby resulting in reducing the value of USD/CAD.

Conversely, if the US’s demand falls, the manufacturer will not need to order in more oil to make goods. Subsequently, the oil prices might fall, which would be bad from the CAD value. So essentially, USD/CAD has a negative correlation.

It’s all about Supply and Demand

Supply and demand are the prominent influencers of the correlation between USD/CAD and crude oil, impacting the demand and supply of US dollars and Canadian dollars.

Export of cruise oil covers a significant percentage of the US currency acquired by Canada. This means that a shift in the price and volume of crude oil will have a considerable impact on the flow of the Greenback into the Canadian dollar.

Furthermore, high crude oil prices also imply a higher flow of USD into Canada due to its exports. This implies that there will be a strong supply of the USD into the Canadian dollar, thereby increasing the value of the Canadian dollar.

Similarly, when the crude price falls, the US dollar supply will be lowered as opposed to the Canadian dollar, leading to a decreasing value of the Canadian dollar.

[wp_quiz id=”97486″]
Categories
Forex Assets

Costs Involved While Trading The XBR/USD Asset Class

Introduction

BCO is an acronym for Brent Crude Oil, which is one of the two types of crude oil and is a benchmark for determining the price of oil, along with West Texas Intermediate (WTI) crude oil. BCO is also known by Brent Blend, Brent Oil, and London Brent. It is the benchmark for the majority of the crude oil from the Atlantic basin, which marks for two-thirds of the crude oil price traded internationally. In the market, it is traded with the ticker XBR/USD.

Understanding XBR/USD

Brent Crude is a commodity traded in barrels. The price of XBR/USD depicts the value of the US Dollar for 1 barrel of crude oil. It is quoted as 1 XBR per X USD. For example, if the market price of XBR/USD is 41.42, then it means that each barrel of crude oil is worth $41.42.

XBR/USD Specification

Spread

It is the basic difference between the bid price and the ask price. The spread on ECN and STP account model is as follows:

ECN: 11 | STP: 15

Fee

There is a fee (commission) for every position a trader opens. However, this fee is only on the ECN account, not the STP account.

Slippage

Slippage is the difference between the price intended by the trader and the price given by the broker. It occurs due to two factors:

  • Broker’s execution price
  • The volatility of the market

 Trading Range in XBR/USD

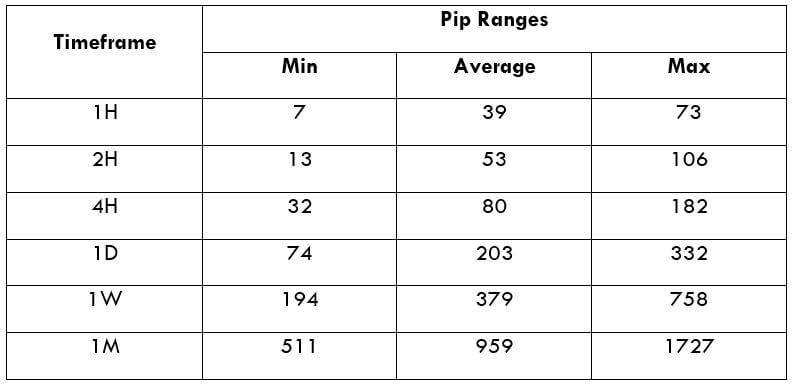
It is the representation of the volatility of the market in different time frames. The table values represent the minimum, average, and maximum pip movements in various time frames. 

Procedure to assess Pip Ranges

  1. Add the ATR indicator to your chart
  2. Set the period to 1
  3. Add a 200-period SMA to this indicator
  4. Shrink the chart so you can assess a large time period
  5. Select your desired timeframe
  6. Measure the floor level and set this value as the min
  7. Measure the level of the 200-period SMA and set this as the average
  8. Measure the peak levels and set this as Max.

XBR/USD Cost as a Percent of the Trading Range

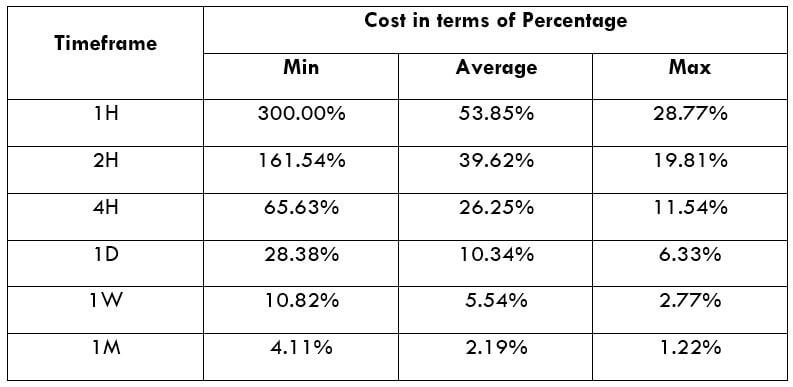
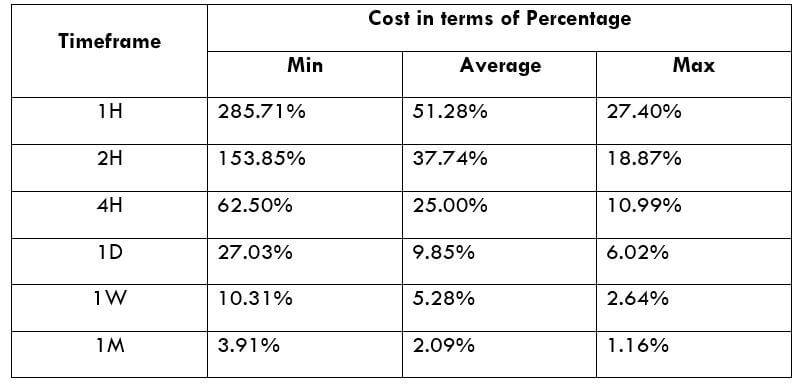
The following are two tables that represent the variation in the fee in terms of a percentage for different time frames. The percentage values are calculated by finding the ratio between the total cost and the volatility values.

ECN Model Account

Spread = 11 | Slippage = 5 | Trading fee = 5

Total fee = Spread + Slippage + Trading fee

Total fee = 11 + 5 + 5 = 21 (pips)

STP Model Account

Spread = 15 | Slippage = 5 | Trading fee = 0

Total fee = Spread + Slippage + Trading fee

Total fee = 15 + 5 + 0 = 20 (pips)

Trading the XBR/USD

Crude oil is a commodity that is rigorously traded in the market. Its volatility and liquidity are comparable to major and minor currency pairs, providing good opportunities for traders to participate in the market. The crude oil prices are driven by various fundamental factors and its Demand and Supply. The reflection of the same is seen on the charts. Thus, traders can apply technical analysis as well to forecast the price movements.

There is a fee on every trade you take with a forex broker. This fee is the same irrespective of the time frame you trade on. So, traders must place themselves in a position that will have a reasonable cost for a sufficient P/L. The trading range and the cost percentage table are the tools for it.

The larger the percentage value, the higher is the relative fee on the trade and vice versa. For example, let’s there are two traders – 1D and 4H trading with the same lot size. The 1D trader places a take profit to 200 pips, while the 4H trader places it at 100 pips. But the fee paid by both the traders is the same. But, seeing the relative fee, the 4H trader pays a higher fee than the 1D trader because his take profit is only 100 pips. Thus, the percentage values are higher in the 1D time frame than the 4H time frame.

There is another scenario where the relative cost changes based on the volatility of the market. In simple terms, the relative fee can vary even if a trader trades in the same time frame. Precisely, the relative fee is higher when the volatility of the market is around the minimum values. Therefore, to balance between the total fee and the P/L, one must trade when the market volatility is above the average volatility, irrespective of the time frame traded.

Categories
Forex Fundamental Analysis

Does The News Release Of ‘Gasoline Prices’ Impact The Forex Market?

Introduction

Despite the advent of alternate and renewable sources of energy, Oil remains the largest consumed non-renewable energy resource on the planet. Even after the Greenhouse effect debates, pollution, etc. we are still using Oil in a big way.

Although a shift has begun, a complete switch out of Oil will definitely take some decades and a lot of technological innovations. Gasoline Price is very closely tied to Consumer Expenditure, and many industrial activities, volatility in Gasoline Prices, affects the economy directly. Hence, understanding of Gasoline Price changes, its causes and consequences are essential for us in assessing macroeconomic indicators like Inflation, Personal Consumption Expenditures, or Consumer Prices Index, etc.

What is Gasoline Price? And Why is it important?

Gasoline is a carbon-based fuel that is extracted from Crude Oil through a process of distillation and refinement. Crude Oil is dark, heavy, and a sticky liquid that is naturally formed inside Earth. It is extracted, boiled to varying degrees, to distill away impurities to obtain purer forms like Diesel, Petrol (or Gasoline), or Fuel Oils, etc. Gasoline is lighter and is more in demand in the market.

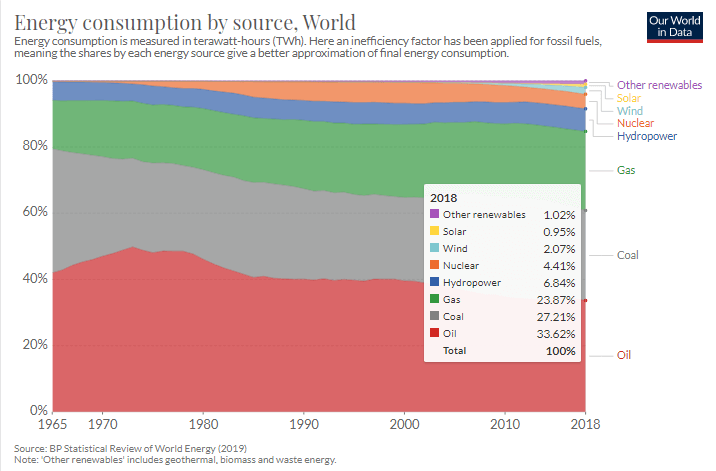
As shown below, Oil is still the largest consumed energy source in the world, accounting for about 34% of all energy sources consumed. Gasoline is one of the first products that is obtained from Crude Oil. The general population and many industries depend on Gasoline heavily to conduct their lifestyle. Today almost, every household has a car or bike that requires Gasoline.

Changing Gasoline prices have a direct effect on the general public and dependent industries like Transportation sectors. Increasing Gasoline prices are always followed by a bitter reaction from the public as it increases their daily expenditures, how industries ship goods.

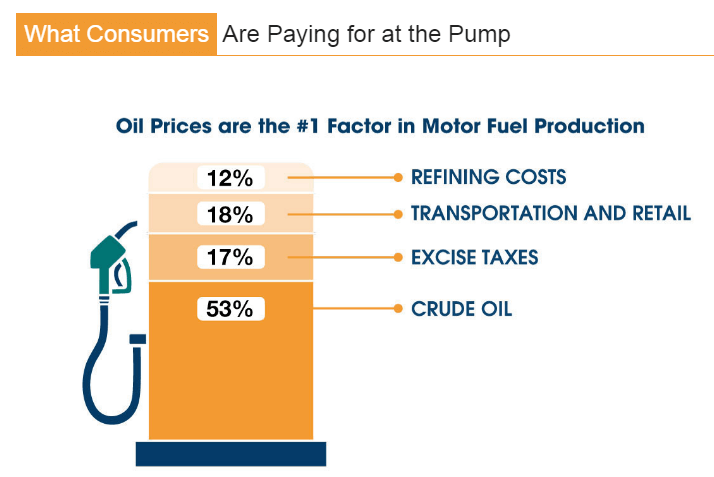
Gasoline prices are dependent on the following critical factors

(Source: gaspricesexplained.com)

Crude Oil Prices: The raw material used for Gasoline production primarily drives the Crude Oil Price as per the United States Energy Information Administration. Crude Oil is available on almost all the continents, except Australia, where it is quite less relatively. Countries like Saudi Arabia, Venezuela have the most abundant reserves of Crude Oil and are essential players in the global Oil market.

The process of extraction is also dependent on terrain where Crude Oil is found. For example, in Canada, the sandpits of Alberta make it challenging to extract Crude Oil that makes it relatively expensive.

Refining: The number of impurities present in the extracted Crude Oil also categorizes the Oil into “sweet or sour Oil.” Sweeter/Lighter Crude Oil contains lesser impurities and hence is easier to refine. The heavy or sour Oil is more abundant and relatively less in demand. The sweet is the more preferred Oil and is the standard when we see Crude Oil pricing. Refining costs vary seasonally as different parts of the world have to follow different mandates on pollution levels, refining technologies available in the regions. Other ingredients like ethanol that are mixed into Gasoline are also minor factors.

Taxes: Taxes add to the Gasoline prices. The Governing body of the country imposes the excise taxes that add to the final consumer price. As of now, on average, all taxes, i.e., federal and local state taxes, included average to 17% of the total Gasoline price.

(Picture Credits: gaspricesexplained.com)

Transportation: Most of the Gasoline is shipped from refineries by pipeline to terminals near consumer regions. It is delivered through tanker trucks to individual gas stations. The price of all this transportation cost and profits are included in the final price. The taxes and transportation costs remain largely constant relative to the Crude Oil price volatility.

Organization of the Petroleum Exporting Countries (OPEC): It is an organization of 12-oil major producing countries that make up 46% of the world’s oil production. They regulate the price of fuel to sustain this non-renewable resource for an extended period.

Speculation: Energy traders speculate Oil prices frequently that drive up or down the Oil prices based on their projected views about the future Oil prices. The volatility is increased due to speculation and tends to create an asset bubble.

How can the Gasoline Price numbers be used for analysis?

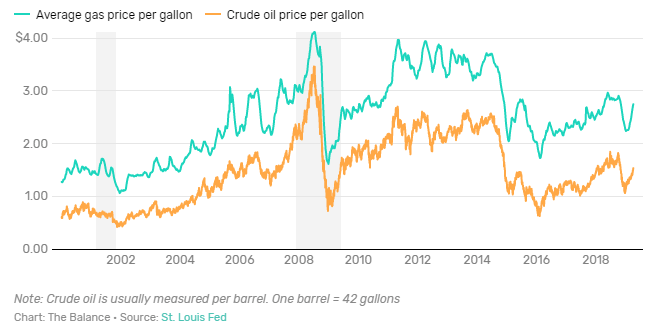
There is a positive correlation between Gasoline and Crude Oil prices in general. The dependency on Gasoline, a high growth rate of the emerging countries, increasing world population, etc. all have increased the demand for Gasoline overtime. For now, there is no significant alternative to compete with Gasoline. Other options like Natural Gas, Electric vehicles are in their budding state and would take some years before they can become worthy alternatives.

Gasoline is a daily consumption, a non-durable commodity that is required by every country. There is no country as of now that is entirely Gasoline-independent. Every country uses Gasoline for one or the other purposes as it has 84% fuel efficiency when burnt (meaning 84% of it is converted into energy).

As attempts to significantly switch to alternate sources of energy are being made, there is still some time left before we see renewable alternatives to Gasoline.

Impact on Currency

An increase in Gasoline Prices is reflected in the Personal Consumption Expenditures reports. As fewer people are able to afford highly-priced Gasoline, Industries dependent on Gasoline mainly observe a cut in their profits that slows down their business. To avoid this, they may increase prices of their end product to compensate for this increase, which again inflates the economy further. The rising costs of Gasoline are terrible for the economy and the currency. It leads to price rises lead to currency depreciation.

Lowered Gasoline prices, stimulate consumption, and increases expenditure in other sectors by public and dependent industries. Changes in Gasoline prices due to Crude Oil price changes take about 4-6 weeks to translate. Gasoline prices are lagging indicators for the Energy traders and have a low impact on the Energy trading community. On the other hand, prolonged increases in Gasoline prices has long term depreciating impact on the currency and the economy.

Economic Reports

Gasoline prices are available daily on the internet on many websites. For the United States, The United States Energy Information and Administration releases the weekly Petroleum status report on its official website.

The OPEC’s Monthly Oil Market Report details the significant causes affecting the world Oil Market that is published on the 12-16th of every month on their website.

Sources of Gasoline Prices

Global Oil market prices & News can be found in the below-mentioned sources.

Oil PricesOPEC – Oil Prices and reserves dataOPEC MOMRGlobal Gasoline Prices – Trading Economics | EIA – Weekly

Impact of the ‘Gasoline Prices’ news release on the price charts 

Gasoline Prices have a major role to play went it comes to the development of the nation. Everyone knows that higher Gas Prices will make each of to pay more at petrol bunks, leaving less to spend on other goods and services. It not only has an effect on the public on an individual level, but higher gas prices also have an effect on the broader economy. Economists and analysts also believe that there is a direct correlation between consumer confidence, spending habits, and gas prices. As gas prices decrease, a large percentage of institutional traders feel that the economy is ‘getting better.’ By this, we can say that the announcement of Gasoline Prices have a major impact on the currency pairs and can cause moderate to high volatility in the pair.

In today’s article, we will be analyzing the impact of Gasoline prices of North America on the U.S. dollar. The Gasoline Prices are published on a Weekly, Monthly, and Annual basis by the U.S. Energy Information Administration. They also provide a statistical analysis of the report. The above image shows the weekly retail Gasoline Prices.

AUD/USD | Before The Announcement

We start our analysis with the AUD/USD currency pair, and the above image shows the state of the chart before the Gasoline Prices are announced. The market essentially is moving in a ‘range’ where the price is repeatedly reacting from ‘resistance’ equals ‘support’ area. Also, the overall trend remains to be up. In such a market scenario, it is prudent to wait for the news announcement and then trade based on the change in volatility in the market. As the Gasoline Price economic indicator is a highly impactful event, there can be extreme movements in the market on either side. However, technically, the bias is on the ‘buy’ side.

AUD/USD | After The Announcement

After the weekly Gasoline Prices are released, price drops sharply, and volatility increases on the downside, owing to a decrease in the Gasoline Prices compared to the previous week. As the U.S. dollar is on the right-hand side of the pair, to buy the U.S. dollar, we need to sell the currency pair. This is why we see a fall in the price after the data is announced, which was positive for the U.S. economy. Even though the market reacted to the news release on expected lines, we should not forget that the price is exactly at the bottom of the range. It is not surprising to see buying strength from here, and therefore we should wait for key levels to be broken to trade based on the News.

EUR/USD | Before The Announcement

EUR/USD | After The Announcement

The above images represent the EUR/USD currency pair. Looking at the first image, we can say that the market is in a downtrend that began recently. Since the selling pressure is above average in the pair, a news announcement that is positive for the U.S. economy is favorable for taking a ‘short’ trade in the pair. On the other hand, we can look to ‘buy’ the pair only if the news release is extremely bad for the U.S. economy.

After the announcement is made, the market falls, and what we see is a firm bearish candle. A decrease in Gasoline Prices is considered to be positive for the economy and, thus, the currency, which is why traders sell Euro and buy U.S. dollars. One can sell the currency pair after a retracement of the price to the moving average.

USD/CAD | Before The Announcement

USD/CAD | After The Announcement

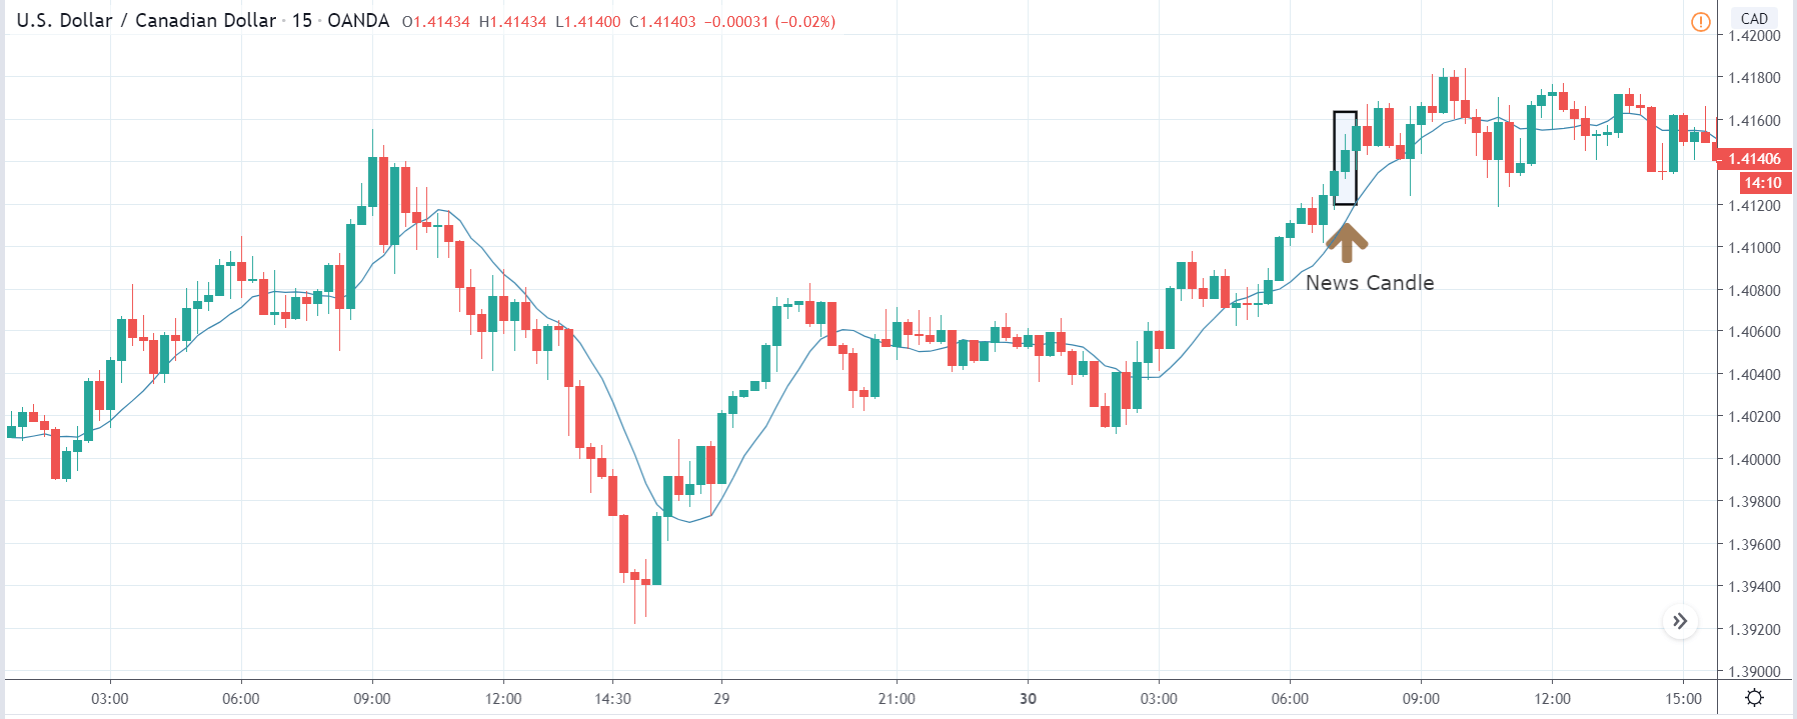
Lastly, we discuss the USD/CAD currency pair where before the news announcement, we see that the market is in a very strong uptrend and currently at a place from where the market had reversed earlier. The continuous bullish green candles suggest a great amount of strength in the U.S. dollar. Thus, a negative Gasoline Price indicator data that is bad enough to cause a reversal in the trend is an appropriate situation for going ‘short’ in the pair. Technically, the chart is more supportive of going ‘long’ in the pair.

After the data is released, we see that the price breaks out above the resistance area and closes as a ‘bullish’ candle. Here too, the market reacted similarly to the above pairs based on the robust Gasoline Prices. One should be ‘buying’ this pair only after the price retraces to the moving average and bounces off from the line. In this way, we will be trading along with the trend, and the stop loss will be below the ‘news candle.’

That’s about ‘Gasoline Prices’ and its news release impact on the Forex market. If you have any questions, let us know in the comments below. Good luck!

Categories
Forex Signals

U.S. Session Trade Setup – Crude Oil on Bullish Run Amid Upward Channel

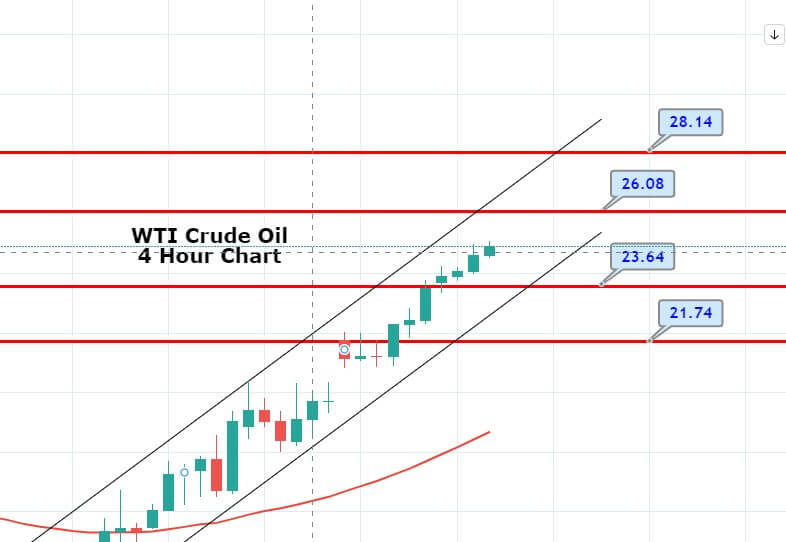
The U.S. WTI crude oil futures continue to advance at $24.39 a barrel in the wake of optimization around the market sentiment and weaker U.S. dollar. Besides this, the latest report about the slowdown in inventories at Cushing since mid-March also continues to support crude oil prices.

The reason for the uptick in crude oil prices could also be attributed to the U.S. dollar weakness. The U.S. dollar is losing its bullish traction and struggling to gain any follow-through traction. Whereas, the U.S. dollar index stalled its moderate bounce just above 99.50 to now trade moderately lower at 99.40.

The start of the OPEC+ production cut by 9.7 million barrels a day also boosted the oil prices. Looking forward, the oil traders will keep their eyes on the weekly release of private inventory data from the American Petroleum Institute (API), which is scheduled to release at 20:30 GMT. The industry stockpile for the week ended on May 1 will likely follow the tracks of the previous reduction to 9.978 million barrels into the inventories.


Crude oil has made a strong bullish recovery, as it has violated the resistance level of 21.82 level. Above 21.82, we may see oil prices soaring further higher until 25.02 level. For now, support holds around 21.85, but the bullish bias remains strong as the RSI is also heading north and may also lead oil prices on the upper side.

WTI Crude Oil – Trade Setup

Categories
Forex Market Analysis

WTI Crude Oil Reaches Double Top – Is It Good Time to Short?

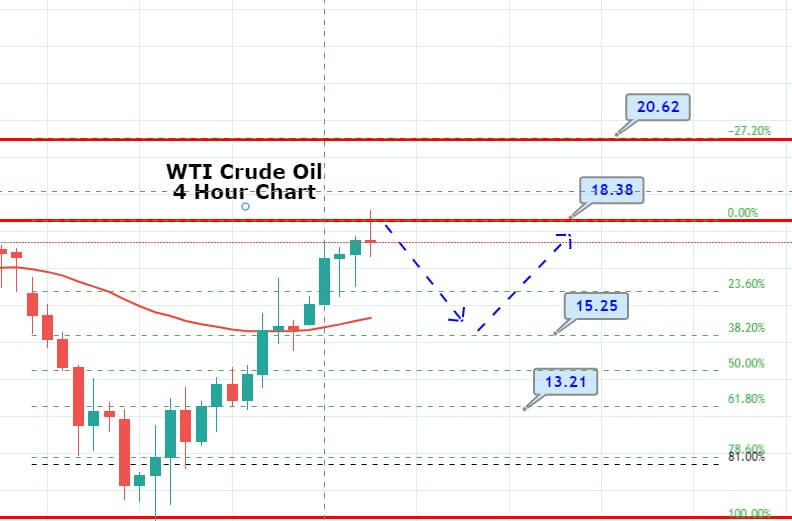
The WTI crude oil prices soar to trade at 17.79 level despite an increased number of inventories. The quantity of crude oil owned by private companies that are incapable of selling the product due to the novel coronavirus (COVID-19) pressure seems to set an all-time high in the weeks ahead. 

Global producers may develop creative measures to find crude storage, which caused by the lack of physical demand due to coronavirus lockdowns, while US President Donald Trump made a commitment to deliver a system to help the country’s oil companies, which also helped the sentiment around the commodity. The Treasury Secretary Steven Mnuchin said the plan could add millions of barrels of oil to already-teeming national reserves.

At the US-China front, US President Donald Trump’s stoked fresh trade war between China and the United States, which weighed on the risk sentiment but not so much. On the other hand, the Fed’s dovish pause and positive updates on the virus medicine have recently improved market sentiment, which is growing crude oil prices.


Daily Support and Resistance

  • S1 9.99
  • S2 13.21
  • S3 14.95

Pivot Point 16.44

  • R1 18.18
  • R2 19.66
  • R3 22.89

On the technical front, the U.S. Oil is holding below the strong double top resistance level of 18.35. On the 4 hour timeframe, WTI seems to close a Doji candle below this level, and if it actually happens, we may see oil prices falling further until 23.6% and 28.2% Fibonacci support areas of 16.33 and 15.17 respectively. The MACD is suggesting an overbought scenario, while the 50 EMA is also far from the CMP (current market price), so we may see a selling opportunity. Good luck! 

Categories
Forex Market Analysis

WTI Crude Oil Recovers – Breace to Trade Sideways Channel

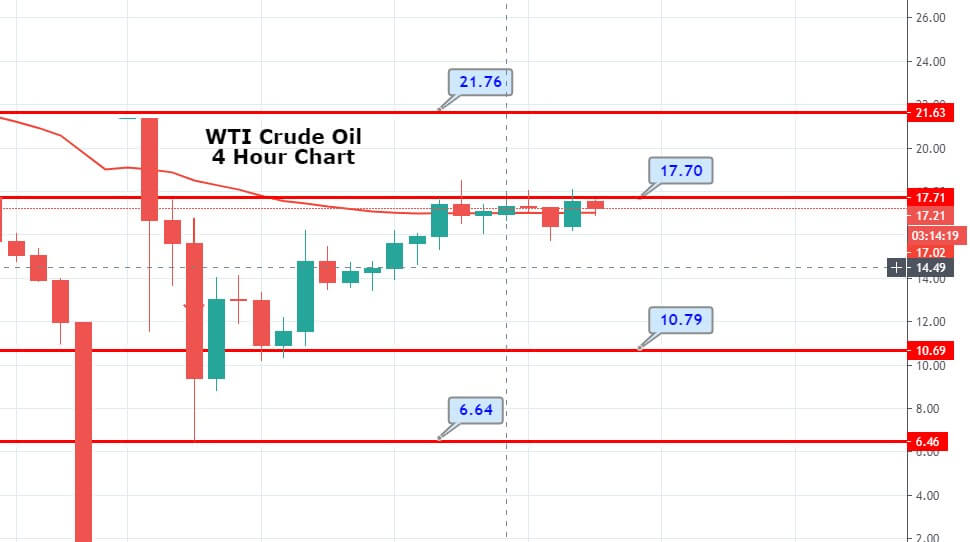
Oil prices staged large-percentage rebounds again. U.S. WTI crude oil futures jumped 20.0% to $16.50 a barrel, and Brent crude oil futures rose 4.7% to $21.33 a barrel. Recently recognized OPEC+ agreement to cut production by 9.7 million barrels per day is ready to come into power on May 1, OPEC’s fourth-largest producer, as Kuwait has already started to cut the supply to the market. As per Kuwait’s Oil Minister Khaled Al-Fadhel, Our country has ducked production while recognizing our responsibility through a hard time.

However, most of the experts saying that these OPEC+ output cuts will not be sufficient to tackle market conditions produced by coronavirus-led demand destruction and the rise in inventory levels. But there is the expectation that the output cuts may stop its sharp declines and put a floor under the prices. 

The best way to boost the oil prices is the recovery in demand, and it is only possible when lockdowns are scrapped and industrial activity start or a generous and unprecedented production cut, in addition to what OPEC+ decided.

At the U.S. front, U.S. senators passed a nearly $500 billion bill for relief from the pandemic, providing support to small businesses and hospitals. The package raises U.S. spending on the crisis to nearly $3 trillion.

Moving on, the demand disruption caused by the coronavirus is set to become the most precipitous fall in global GDP since the Second World War, as per the forecasting a 5.5% reduction in global economies this year, dwarfing the 0.5% fall seen during the global financial crisis in 2008.


Daily Support and Resistance

  • S1 2.33
  • S2 8.26
  • S3 11.59

Pivot Point 14.2

  • R1 17.53
  • R2 20.14
  • R3 26.08

The crude oil recovered after dropping to $7.50 previously. For now, the prices are holding around 16.85 level, right below the next resistance level of 17.55, which marks the 61.8% Fibonacci retracement. Bullish crossover of 17.55 level can extend bullish trend until 20.75 level. On the lower side, immediate support holds around 14.70 level today. Bullish bias will be stronger above 17.55 and bearish below the same.

Good luck!

Categories
Forex Fundamental Analysis

Understanding The Impact Of ‘Crude Oil Production’ On The Forex Market

Introduction

Crude Oil is the primary mineral from which the most widely used petroleum products like Diesel, Petrol (or Gasoline) are produced. For most countries, Oil is a primary energy source. Any decrease or increase in the global production of Crude Oil creates significant Oil market price volatility.

There are many countries whose primary source of revenue is from Crude Oil production alone. Hence, changes in the Crude Oil Production levels hurt the buyers due to raised Oil prices and the sellers due to decreased income. Thus, Crude Oil Production statistics are critical metrics to predict expenditures of Oil Consumers and revenues of Oil Exporters.

What is Crude Oil Production?

Crude Oil

It is a naturally occurring, hydrocarbon mineral, unrefined petroleum product inside Earth. It is dark yellow-black in texture, and, based on the region of extraction, it can have different impurities with it. It is a non-renewable energy source and hence is limited.

If the impurities are more, it is called Sour/Heavy Oil and is generally abundant and is not preferred much due to the additional refining costs that are associated with it. If the impurities are less, it is called Sweet/Light Oil and is the preferred one over the Heavy one and is naturally costlier than its counterpart. Refining of Crude Oil and boiling it distills away the impurities to give useful petroleum products like Petrol, Kerosene, Diesel, etc.

Crude Oil Production

It refers to the process of Oil extracted from the ground after the removal of impurities and inert matter. It consists of Crude Oil, Natural Gas Liquids (NGLs), and additives. It is measured in a thousand tonne of Oil equivalent (toe). The final products, like Gasoline, are measured in the number of barrels produced. One barrel is equivalent to 42 Gallons, or 159 Litres, or 35 Imperial Gallons. The leading Oil Producing countries are the United States, Saudi Arabia, and Russia.

Organization of the Petroleum Exporting Countries (OPEC)

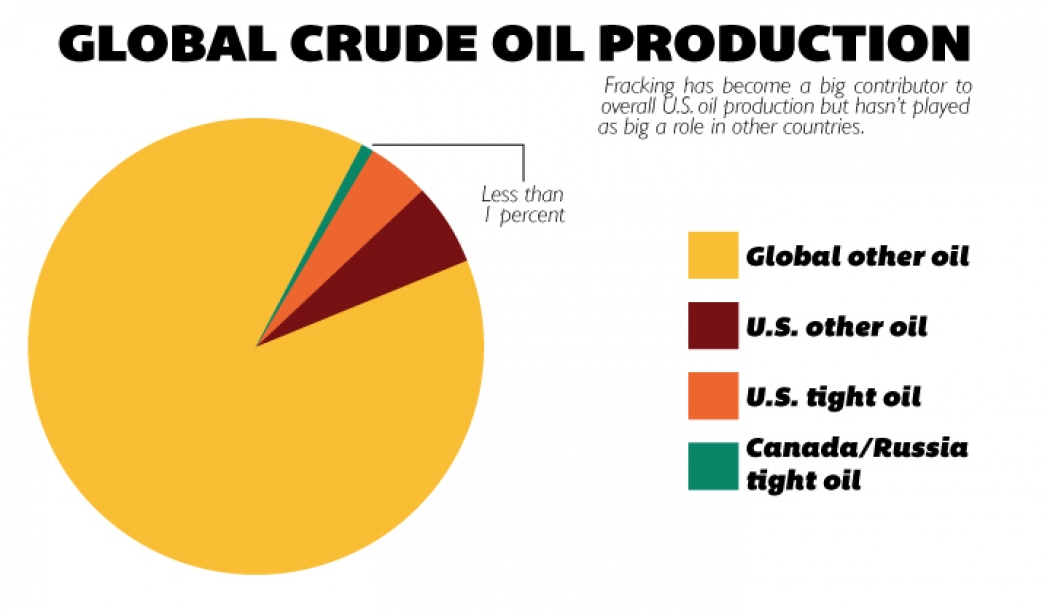
It is an organization of 12-oil major producing countries that make up 46% of the world’s oil production. They regulate the price of fuel to sustain this non-renewable resource for an extended period. In the early 21st century, the advent of new technologies (mainly Hydrofracturing) has led to a boom in the U.S. Oil production numbers, decreasing the influence of OPEC.

How can the Crude Oil Production numbers be used for analysis?

Crude Oil production is susceptible to the following factors:

Political Tensions: Many of the countries sitting on top of Crude Oil reserves are victims of political unrest. Crude Oil supply is drastically affected by political turmoil and wars. Iran-Iraq War, the Persian Gulf wars, Arab Oil Embargo, etc. are some typical examples.

Weather Patterns: Storms and Hurricanes have always threatened Crude Oil deposits and shipments. Oil spillage due to bad sea-weathers is the worst. An example would be the Deepwater Horizon Oil Spill in 2010, where approximately 480 tonnes of Crude Oil was spilled into the Ocean. This type of incident spikes the Crude Oil prices as the supply is reduced.

Exploration and Production: Crude Oil is a non-renewable energy resource. It will be exhausted after a certain period. Exploring new regions for drilling and extraction involves huge costs. Set up of Production units is also a hefty investment

Investments & Innovation: Poor technology and lack of funds can negatively affect Crude Oil Production. The United States gained back its dominance in Crude Oil Production through the innovation of Hydrofracturing that dramatically increased its Crude Oil Production.

Demand: Demand motivates companies and governments to invest more in Crude Oil Production. As the world starts to switch to other resources, it is the demand that will primarily drive the supply of Crude Oil in the long run. Application is linked to population growth and reliance on Crude Oil as an energy source. As emerging economies increase Oil consumption while alternate energy sources are being developed, the current Oil consumption is set to stay steady and, if not, increase more for now.

Impact on Currency

Investors purchase mainly two types of Oil contracts:

Spot Contract: In this, the price of Oil reflects the current market price of Oil. Commodity Contracts in the Spot market are effective immediately, i.e., Money is exchanged, and Oil delivery starts right then.

Futures Contract: This is the more common form of Contracts purchased by traders, as they speculate the price of Crude Oil based on many factors and algorithms. They agree to pay a certain amount for Oil at a set future date. Companies dependent on Crude Oil use these contracts to hedge the risk of price volatility.

In Northern America, West Texas Intermediate (WTI) is the benchmark for Oil futures traded on New York Mercantile Exchange (NYMEX). In the Middle East, Europe, the reference is the North Sea Brent crude exchanged on the Intercontinental Exchange (ICE).

A decrease in Crude Oil Production leads to a rise in oil prices, which is terrible for the economy and currency. As fuels become expensive, currency value depreciates. It creates inflationary conditions within the economy. All Oil dependent industries like textile, chemical, medicine industries increase the cost of their end-products to compensate for the price increase. Gasoline, Petrol, and Other Crude Oil end-products become less affordable.

A sufficient supply of Crude Oil is necessary to keep inflation in check. Hence, it is a proportional indicator. Although the Crude Oil market is more volatile than currency and stock markets, large scale price changes reflect in the currency and stock values over a period. The effect on currency is dependent on the degree of dependence of the nation on Oil. The more dependency, the more the volatility in the currency. Typically, Major currencies do not see a change in values as dramatic as the Oil price.

Economic Reports

Investors, economists, and traders closely watch OPEC’s Monthly Oil Market Report (MOMR). It is released in the middle of the month for the previous month. The International Energy Agency (IEA) Oil Market Report released monthly is also widely used by many. IEA was formed in 1983, and since then, it has been the source for official government statistics from all OECD and few non-OECD countries.

The Weekly Petroleum Status Reports from the United States Energy Information is also a famous report to monitor Crude Oil Inventory levels. The American Petroleum Institute’s Weekly Statistical  Bulletin (WSB) reports the United States and regional Crude inventories and data related to refinery operations.

Sources of Crude Oil Production

The Global Crude Oil Production and Trade statistics can be found in the sources provided below.

OPEC – MOMR | IEA – Oil Market Report

Enerdata – Crude ProductionCrude Oil Production – OECDEIA – Crude Oil Production

EIA Weekly Inventory Status ReportAPI WSB Report

Impact of the ”Crude Oil Production” news release on the price chart 
Crude Oil Production plays a significant role in the economic growth of a country and in determining the rate of inflation. It is especially important for monetary policymakers and Central banks who decide on the interest rates based on oil production. The fundamental factors of demand and supply influence the rise and fall of oil prices. This Crude Oil Production has a direct impact on the oil price.

Low production of crude oil increases the price of Oil, which increases the cost of production and transportation. This increases the cost of goods and services in the country and has an adverse effect on the value of a currency. As Crude Oil Production is such an important news release, it creates a great impact on almost currency pairs, but predominantly more on the U.S. dollar pairs.

In today’s article, we will be analyzing the impact of Crude Oil Production in the Gulf, where the data is published by the Organisation of the Petroleum Exporting Countries, famously known as OPEC. The below image shows the quantity of Crude Oil Production in Barrels for the month of March.

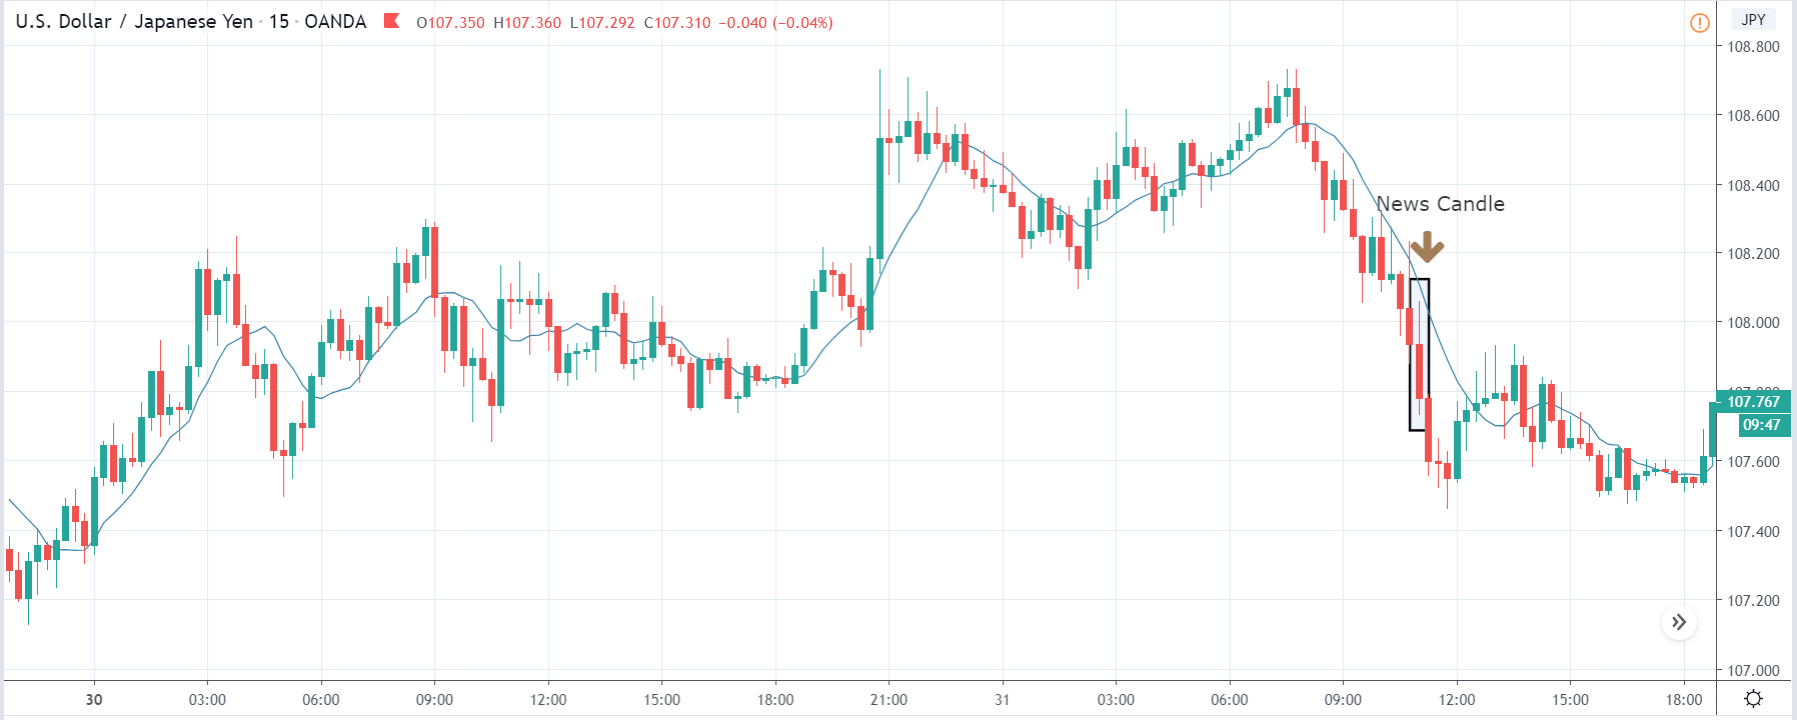
USD/JPY | Before The Announcement

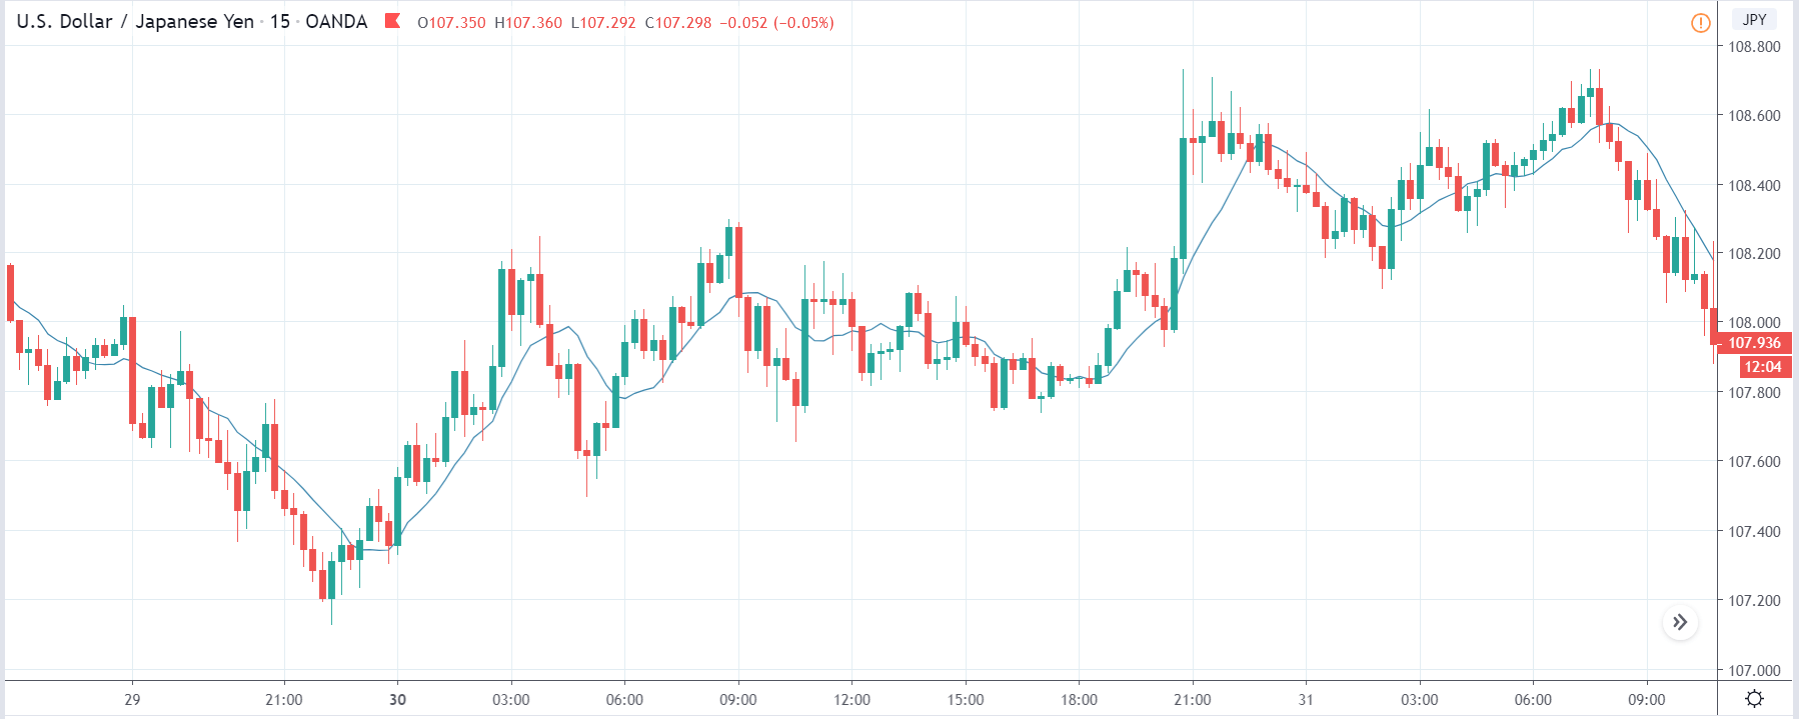
First, we shall analyze the USD/JPY currency pair, and the above image shows the state of the chart before the news announcement.  Around three hours before the release, we see that the market is aggressively moving down, indicating a great amount of downward pressure. If we carefully observe, currently is at a place where this price was portraying as ‘support’ on the previous day. Therefore, we can expect ‘buying’ strength to come back into the market from this point.

USD/JPY | After The Announcement

After the Crude Oil Production data is announced, the price falls drastically, and the ”news candle” closes as a strong bearish candle. The market reacted very negatively because the Crude Oil Production was lower as compared to the previous month. This impacted the U.S dollar adversely, and traders sold the currency, thereby increasing the volatility on the downside. As mentioned in the previous paragraph, since the price at the key ”support” level, taking a ”short” trade can prove to be risky at this point. It is safer to ”sell” after a suitable retracement.

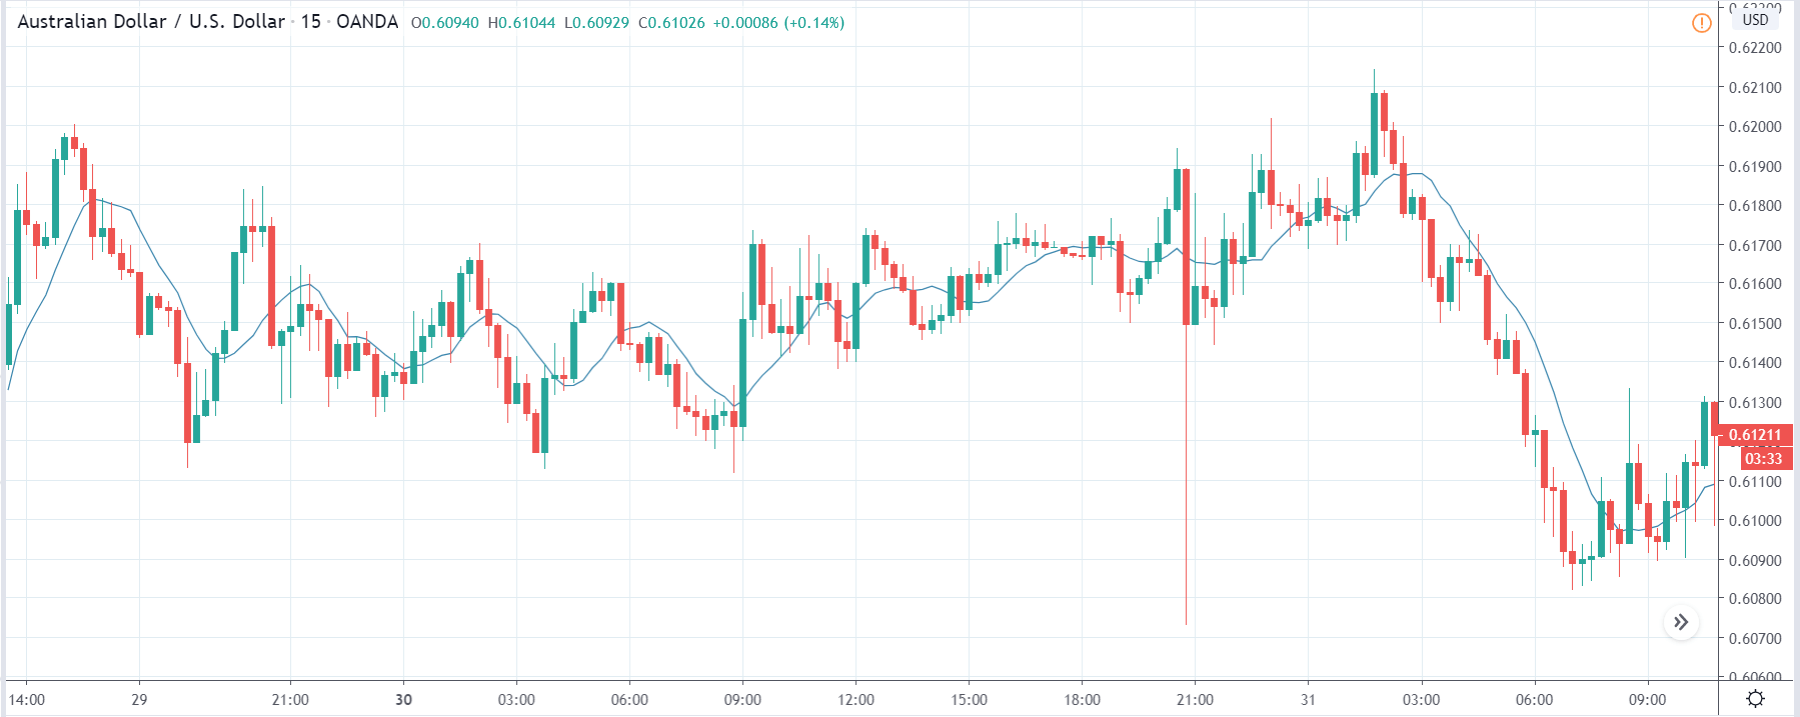
AUD/USD | Before The Announcement

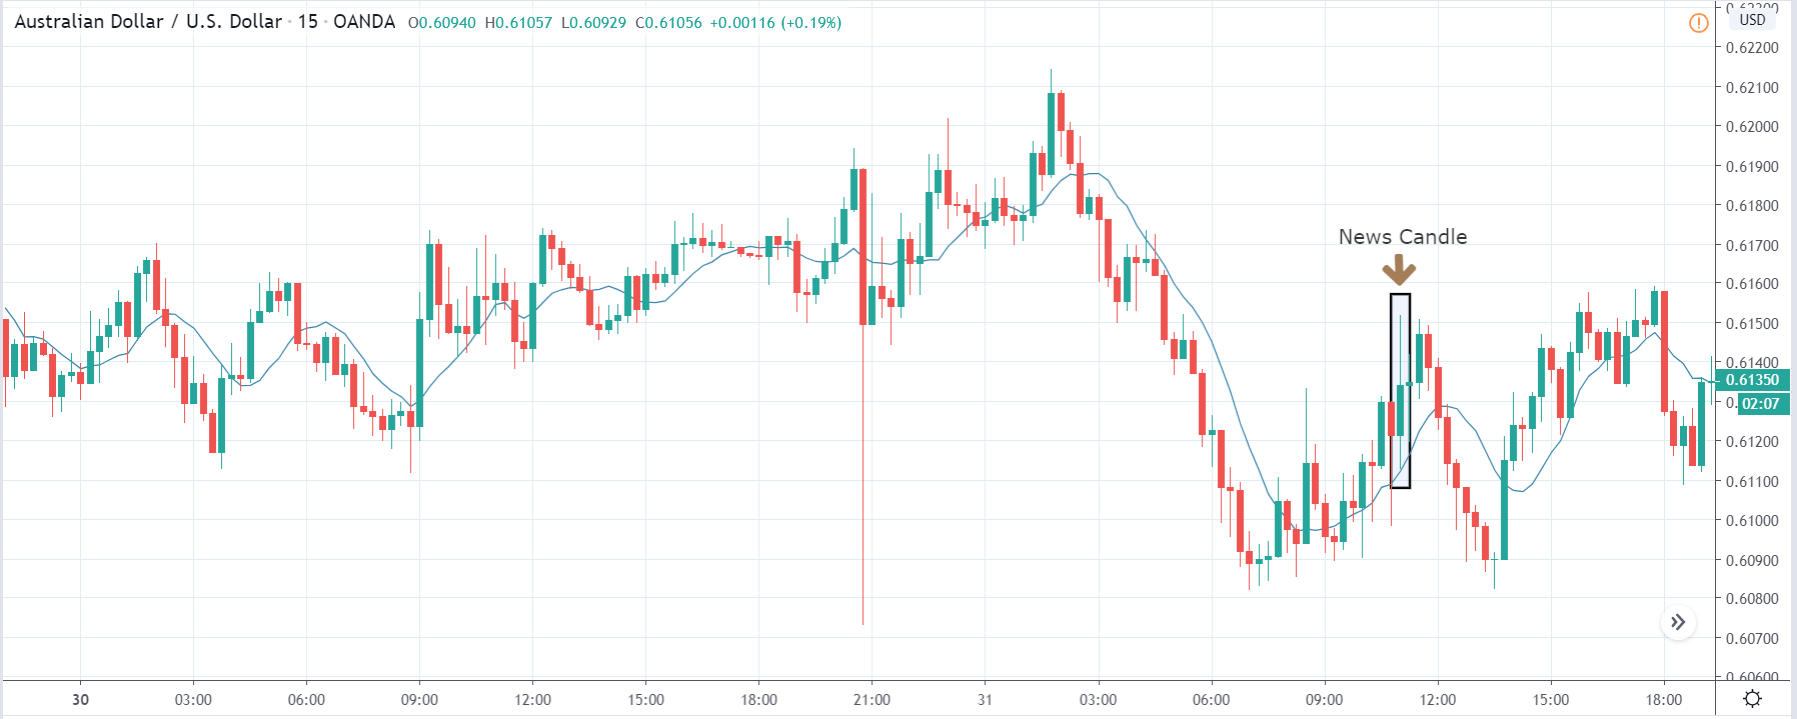
AUD/USD | After The Announcement

The above images are that of the AUD/USD currency pair, where we see that the market is in a strong downtrend, and recently the price has moved higher in the form of retracement. Technically, this is the ideal scenario for trend trading and going ”short” in the pair, but as there is a high impact news announcement in few minutes, the market could sharply move on any side. Therefore, it is wise to wait for the release and then trade based on the data and shift in volatility.

After the news announcement, the price suddenly surges and moves higher in the beginning, but the price sees some selling pressure from the top and closes with a large wick on the top. The sudden up move is because of the weak Crude Oil Production data, which made traders sell the U.S. dollar and cause a short-term reversal in the market. As the ”news candle” still closes as a bullish candle, one should not underestimate the buyer’s strength and go ”short” in this pair. We also cannot go ”long” in the currency pair due to the selling pressure seen later. Thus, we can only trade the pair after he/she gets a sense of clear direction.

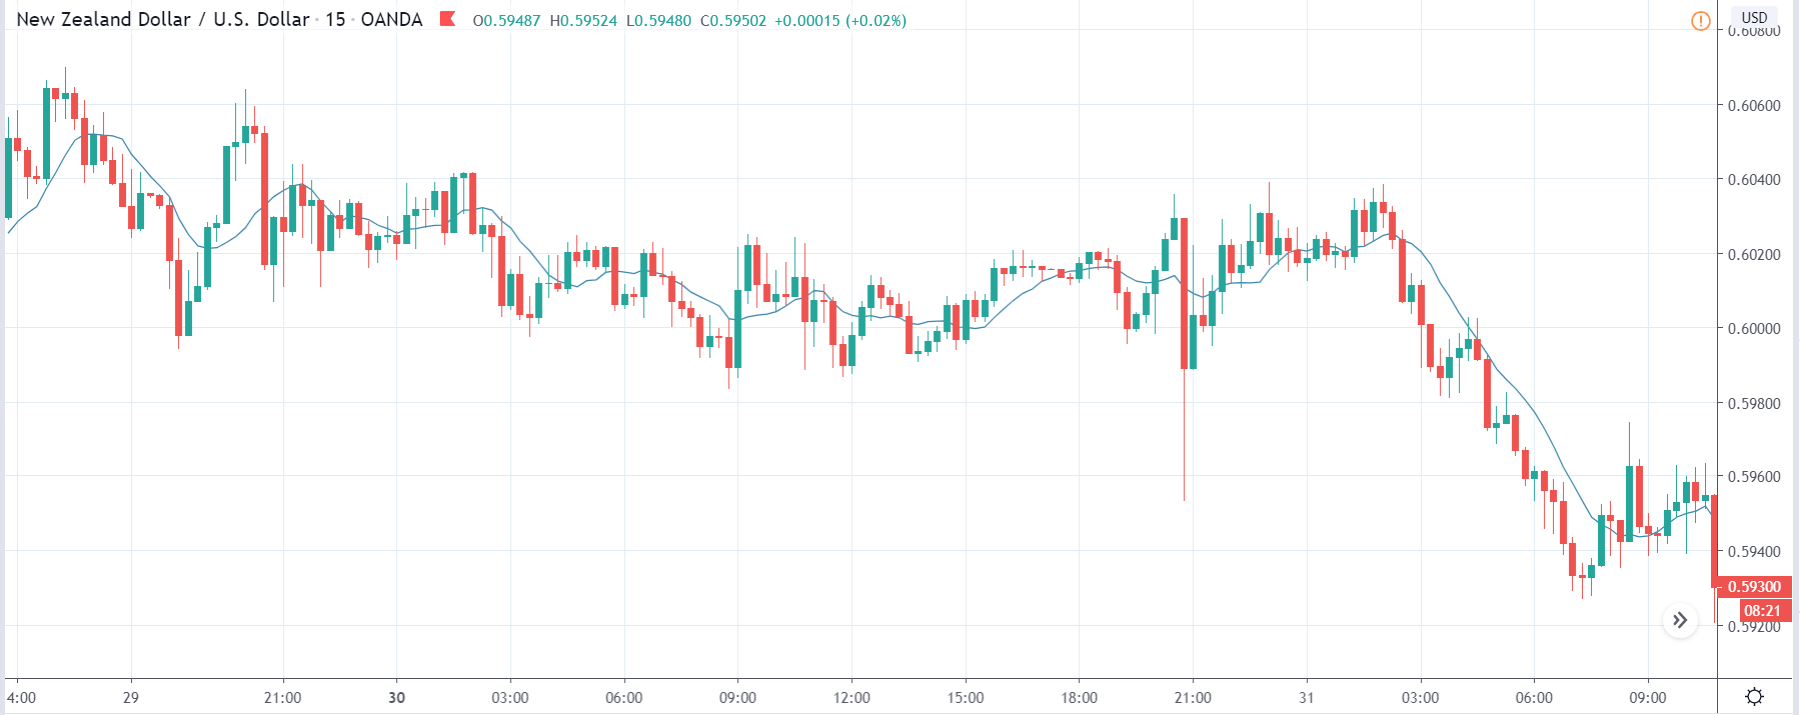
NZD/USD | Before The Announcement


NZD/USD | After The Announcement

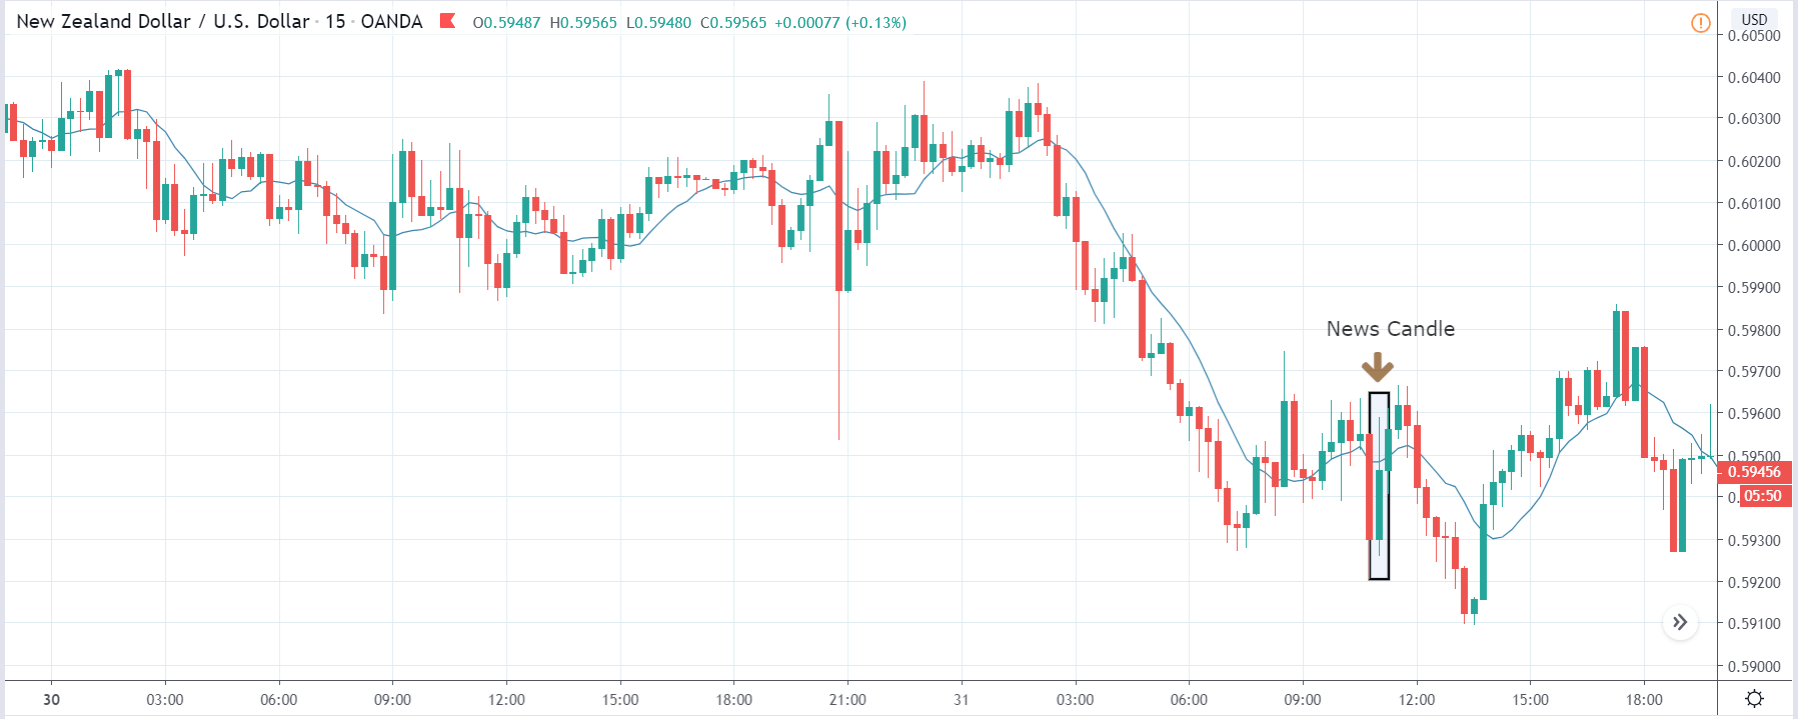
Lastly, we shall discuss the NZD/USD currency pair, where the first image shows the characteristics of the chart before the news announcement. As we can see, the pair is in a strong downtrend, and just before the release, it is at the lowest point. This indicates a great amount of strength in the U.S dollar, as it is on the right-hand side. If the Crude Oil Production is lower than before, the pair will continue to move lower, and we will not have a suitable trade entry.

On the other hand, if the data is better than last time, we can only go ”long” in the market, if we see some reversal patterns. After the data is released, the market moves sharply higher, almost similar to the above pair, and again leaves a wick on the top. The bad news in the form of lesser Crude Oil Production increased the volatility on the upside and shot the price up.

That’s about ‘Crude Oil Production’ and its impact on the Forex market. Let us know if you have any questions in the comments below. Cheers.

Categories
Forex Market Analysis

Crude Oil Boosts Amid Massive Output Cut Sentiment – OPEC Meeting In Focus! 

A day before, the WTI crude oil prices were boosted by reports that massive output cuts would be agreed upon when OPEC and its allies, including Russia, meet later today. U.S. Nymex crude oil futures jumped to trade $27.09 a barrel. 

Meanwhile, the U.S. Energy Information Administration reported that crude oil production in the country sank to a six-month low of 12.4 million barrels per day last week. The agency also said crude oil stockpiles increased 15.2 million barrels, much higher than a build of 8.4 million barrels expected.

Declining demand due to coronavirus fears and lockdowns, Russia’s announcement comes at a suitable time. Whereas, the Energy Information Administration (EIA) said overnight that the U.S. crude oil inventory has grown by 15.2 million barrels for the week ending April 3, against analyst expectations of a 9.37-million-barrel build. The American Petroleum Institute (API) also estimated a build of 11.9 million barrels yesterday. 

OPEC meeting will likely be more successful than their meeting in March, where they failed to agree to continue supply cuts and fueled a price war between Saudi Arabia and Russia.

Apart from the OPEC+ meeting, energy ministers from the Group of 20 major economies are expected to meet in order to find new ways to help ease the impact of the COVID-19 pandemic on global energy markets.

Daily Support and Resistance

  • S1 24.14
  • S2 26.37
  • S3 27.77

Pivot Point 28.59

  • R1 30
  • R2 30.82
  • R3 33.05

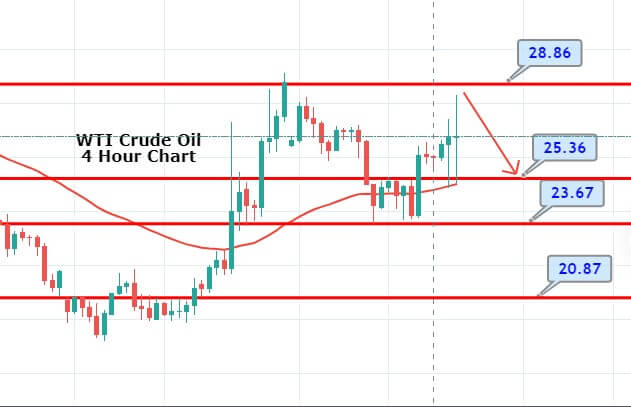
Crude oil is on a bullish run, trading around 27.15 level. The U.S. oil is likely to face immediate resistance around the triple top level of 28.86. Today, crude oil may find immediate support around 25.45 level, and above this, the WTI crude oil prices can show a bullish bias until 28.85 resistance. A bullish breakout of 28.85 level can lead WTI prices further higher until the next resistance area 30.22. The bullish bias remains dominant, and we should look for buying trading over 26.15 today. Good luck!

Categories
Forex Market Analysis

WTI Crude Oil Retest 28.30 – Is It a Good Idea to Sell Here? 

The U.S. crude oil futures soared 25.0% to $27.32 a barrel, and Brent was up 21.0% to $30.94 a barrel. One of the major reasons behind such a bullish trend was a tweet from U.S. President Trump.

He said in his tweet: “Just spoke to my friend MBS (Crown Prince) of Saudi Arabia, who spoke with President Putin of Russia, & I expect & hope that they will be cutting back approximately 10 Million Barrels, and maybe substantially more which, if it happens, will be GREAT for the oil & gas industry!”

The markets were supported by the sentiment of an oil production cut on Thursday in United States markets after news that President Donald Trump said the world oil industry has been ruined this year and has plans to attend meetings with industry executives later this week. Whereas the idea of tariffs on Gulf imports was floated Afterward, WTI rose to the $27 handle overnight. 

Looking forward, the oil traders will now keep their eyes on the U.S. President’s meeting with the key oil company leaders to determine if there are chances of production cut or not. 

WTI Crude Oil – Daily Technical Level

Support Resistance 

22.84     28.87

19.71     31.76

13.68     37.79

Pivot Point 25.74

Technically, U.S. oil has passed over the resistance mark of 24.85, which has exposed additional opportunity for buying unto 28.29 level. Formation of candles beneath this level may support us to capture a bearish trade; however, at the same time, bullish trades can be taken instantly above a 24.85 resistance level. The MACD is making significant histograms, which is proposing the chances of further buying in crude oil. Good luck!

Categories
Forex Market Analysis

Crude Oil’s Bearish Bias Stays Strong – Quick Technical Outlook 

The WTI crude oil has dropped to the weekly support level of 20, before bouncing off to trade at 23.94. Despite the small recovery in oil prices, analysts continue to give a warning about the coronavirus negative impact on the global market because the cases continue to rise and death losses as well. 

Moreover, the continuing price war between producers Saudi Arabia and Russia is also not showing any ending probability, despite Russian hints at a preference for higher prices on Wednesday, as per the latest report. Whereas, the recently positive inventory numbers from the US failed to give any good signals to the buyers.

At the USD front, the greenback continues to flashing green and remains as the market favorite, mainly due to its safe-haven currency status. On the other hand, the moves offer unstable trading sessions due to the downbeat performances of the Asian stocks. A stronger dollar is also placing a bearish bias on the WTI prices due to it’s negative correlation. 

Investors will keep their eyes on the coronavirus headlines since the global struggles to control the pandemic. It should also be noted that the fears of the deadly virus continue to weigh on the markets’ risk-tone, but the US equity futures have recovered off-late after the ECB’s announcement. Eventually, the demand for crude oil is suffering. 


Support Resistance
19.75 26.79
16.61 30.7
9.57 37.74
Pivot Point 23.66

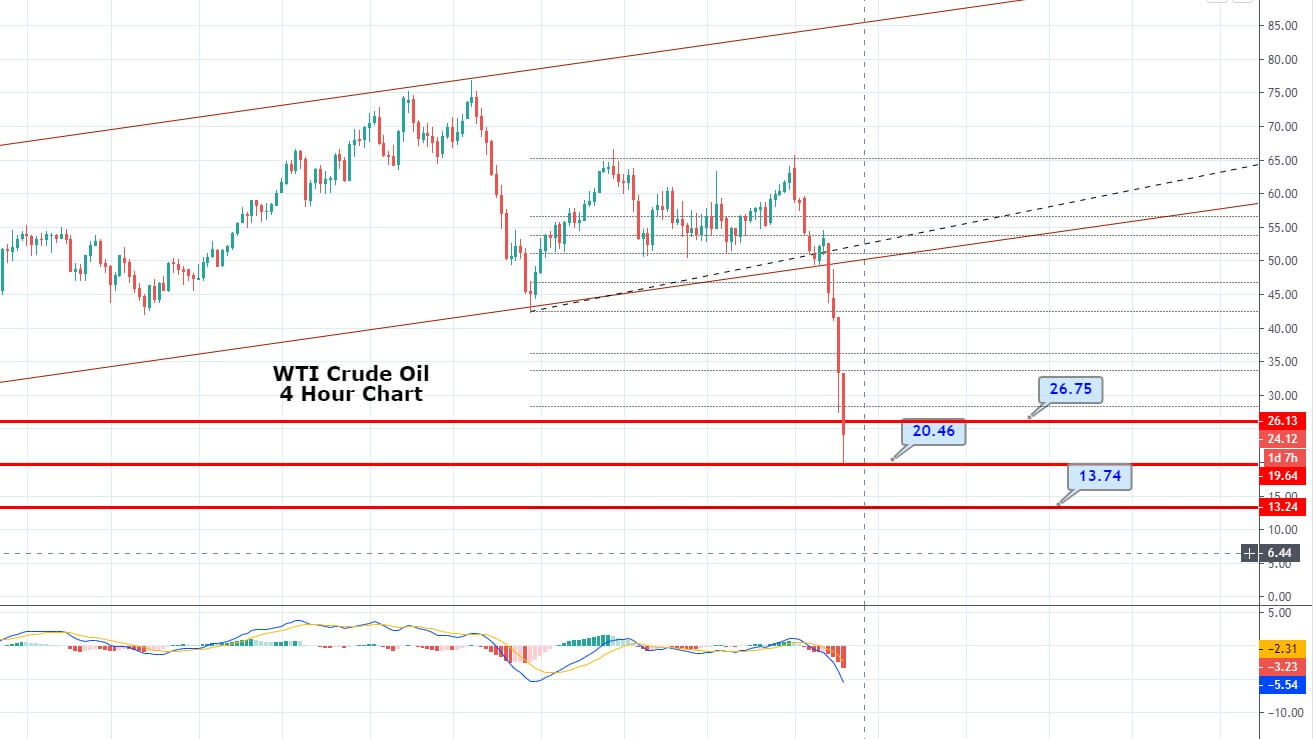
On the technical front, the WTI prices are likely to find support around 20. and 13, while the resistance stays around 26. The MACD and RSI are suggesting a sharp selling trend in the oil, especially after it has closed three black crows pattern on the weekly timeframe, which is making it a big deal. Let’s consider staying bearish below 26 and bullish above 20 today. Good luck! 

Categories
Forex Market Analysis

WTI Crude Oil Slips Below $29- Coronavirus Outbreak Weights! 

The WTI crude oil prices flashing red falling from $30 to $28.70 in the wake of the coronavirus outbreak and uncertainties encompassing the price war between Saudi Arabia and Russia.

Improvements in the oil prices were limited today as new nations have announced COVID-19 lockdowns. Airlines are decreasing the number of regular flights because of increased numbers of cases and countries declaring quarantines to combat the new coronavirus. Canada and Malaysia are the two most recent countries to ban arrivals and close their borders.

The U.S. President Donald Trump said overnight that economic interruptions from the spread of the coronavirus and stimulus measures taken against it could start to a recession.

On the other hand, the ongoing price war between Saudi Arabia and Russia, two of the world’s biggest oil producers, also limits the oil price gains. Saudi Arabia’s Saudi Aramco threw down the gauntlet, with Chief Executive Officer Amin Nassar informing investors that the company is “very comfortable with oil prices below $30 a barrel”.  

Meanwhile, the group has decided to produce at maximum capacity of 12 million barrels a day next month, and there are no changes forecast for May. Consequently, crude oil prices are trading with a selling bias today.

Daily Support and Resistance

  • S1 23.34
  • S2 26.59
  • S3 27.96

Pivot Point 29.84

  • R1 31.21
  • R2 33.08
  • R3 36.33

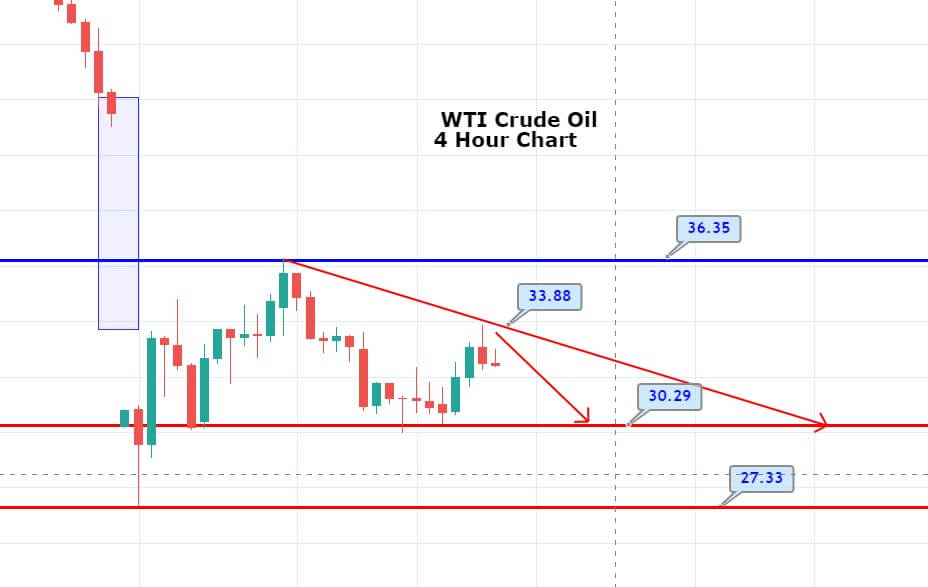
On the technical side, crude oil seems to have formed a descending triangle pattern, which is likely to support crude oil around 27.70. Above this, the oil prices may trade bullish until 30 and 32.50. However, the bearish breakout of 27.70 can lead the WTI prices towards 25.65 and 23.85. Let’s consider staying bearish below $28.95. Good luck!  

Categories
Forex Market Analysis

WTI Crude Oil Slips Beneath $29 as Coronavirus Outbreaks Further! 

Crude oil prices fell sharply to trade below $29 after showing a slight bullish recovery during the previous week. Crude oil prices benefited from President Trump’s saying that his government is to buy large quantities of crude oil for the Strategic Petroleum Reserve to take advantage of lower oil prices. Nymex crude oil futures rose 2.8% to $31.87 a barrel, and Brent rebounded 4.3% to $34.07.

Over the weekend, the global coronavirus pandemic worsened, particularly in Europe. Italy saw the number of coronavirus cases surge past 24,700 (1809 deaths), while Spain reported over 7,800 cases in total, Germany over 5,800 cases and France over 5,400 cases. In the U.S., the number of cases jumped to nearly 3,600 (68 deaths).

The RBA indicated that it would purchase bonds while holding a special meeting on Thursday. Whereas, RBNZ finally also joined the role of major central bankers that offered major rate cuts in order to control the coronavirus (COVID-19). 

China’s National Bureau of Statistics (NBS) said that China’s economy continues to stabilize despite the impact of coronavirus. The comments came after January-February month Retail Sales and Industrial Production disappointed markets. As in result, the risk-tone remains under pressure with the U.S. ten-year treasury yields decreased around 0.673% while stocks in Asia register mild losses due to pandemic fears.

Moving forward, traders will keep their eyes on central banker’s moves and announcements/surprises for near-term trade direction. On the other hand, coronavirus headlines will also be essential to watch.

Daily Support and Resistance

  • S1 26.84
  • S2 29.16
  • S3 30.25

Pivot Point 31.49

  • R1 32.57
  • R2 33.81
  • R3 36.13

On the technical front, crude oil has formed a bearish engulfing candle, which is strengthening the bearish bias among traders. On the lower side, the WTI prices may head further lower towards the support level of 27.33 level. Below this, the next support can be found around 23.95 level. Fundamentals are in favor of a selling trend, and but oil should break below 27.50 level before exhibiting further selling today. Let’s consider staying bearish below $31. Good luck!  

Categories
Forex Market Analysis

WTI Crude Oil Prices Rose To $32.35 – Emergency Cash Injection U.S. Fed Hikes! 

The WTI crude oil prices flashing green and recovered to $32.35, mainly after the emergency liquidity injected from the United States Fedra Reserve. The fresh geopolitical tension from Iraq supporting the energy prices. Moreover, the reason behind the oil price recovery could also be the surprise infusion of liquidity from the Bank Of Japan. The U.S. Crude Oil WTI Futures traded 2.7% higher to $32.35. 

The WTI Crude Oil prices recovered today after the Federal Reserve moved to provide $1.5 trillion in short-term liquidity and changed durations of Treasuries it buys.

Despite today’s recoveries, crude oil markets fell almost 30% this week after Saudi Arabia and Russia prices war and decided not to cut production further and instead sell at lower prices, raising fears of a price war. 

Meanwhile, the U.S. decision to ban travel from some European countries as President Donald Trump’s main tactic to control COVID-19 also disappointed the investor’s sentiment.

Traders are expecting that the talks between U.S. President Donald Trump and Saudi Prince may help to stop the fall in crude prices while, on the other hand, Russia’s willingness to attend the OPEC+ meeting on March 18 adds smiles on the face of the oil trades.

Looking forward, qualitative catalysts could keep the driver’s seat, whereas the weekly release of the Baker Hughes US Oil Rig Counts, prior 682, will entertain the traders.

Daily Support and Resistance

  • S1 26.84
  • S2 29.16
  • S3 30.25

Pivot Point 31.49

  • R1 32.57
  • R2 33.81
  • R3 36.13

Technically, crude oil is trading at $32.36 per barrel, mostly maintaining sideways trading range of 34.40 – 27.33. At the moment, 34.35 resistance is very, very crucial for crude oil as the MACD is in the buying zone, and traders need a reason to go long on crude oil. Breakout of 34.35/40 can be that reason which may attract some buying in crude oil and may lead its prices towards 38. Let’s look to stay bearish below 34 as below this; crude can head to target the next support level of 31.50. Good luck! 

Categories
Forex Market Analysis

WTI Crude Oil Recovered Slightly From Yesterday’s Historical Fall – Trade Plan! 

The WTI crude oil prices recovered on the day, representing an 8% gain after yesterday’s historical drop, having hit a multi-year low of $27.40 on Monday. The U.S. Crude Oil WTI Futures gained 6.2% to $33.05. 

The WTI Crude Oil prices marked a historical 30% fall yesterday because tensions between Saudi Arabia and Russia escalated, whereas intensifying fears about the spread of the new coronavirus continued to affect investor sentiment.

After a failure in talks between OPEC and its allies last week, Saudi Arabia cut its April official selling prices by $6 to $8 to grab market share. It also plans to increase its crude output above 10 million barrels per day in April from 9.7 million BPD in recent months.

On the other hand, Russia also said that it might raise output and said that it could manage with low oil prices for six to ten years. It is worth to mention that possibly 50% of the public exploration and production companies will become bankrupt during the next two years as per the report that came from the Pioneer Natural Resources Co. Chief Executive Scott Sheffield. 

The risk-sentiment was also recovered after Chinese President Xi Jinping visited Wuhan, the epicenter of the coronavirus outbreak, for the first time since the disease started, and because of the spread of the virus in mainland China sharply decreases.

At the demand side, the International Energy Agency said oil demand was set to contract in 2020 for the first time since 2009.

Daily Support and Resistance

  • S1 16.27
  • S2 23.67
  • S3 27.07

Pivot Point 31.07

  • R1 34.47
  • R2 38.47
  • R3 45.87

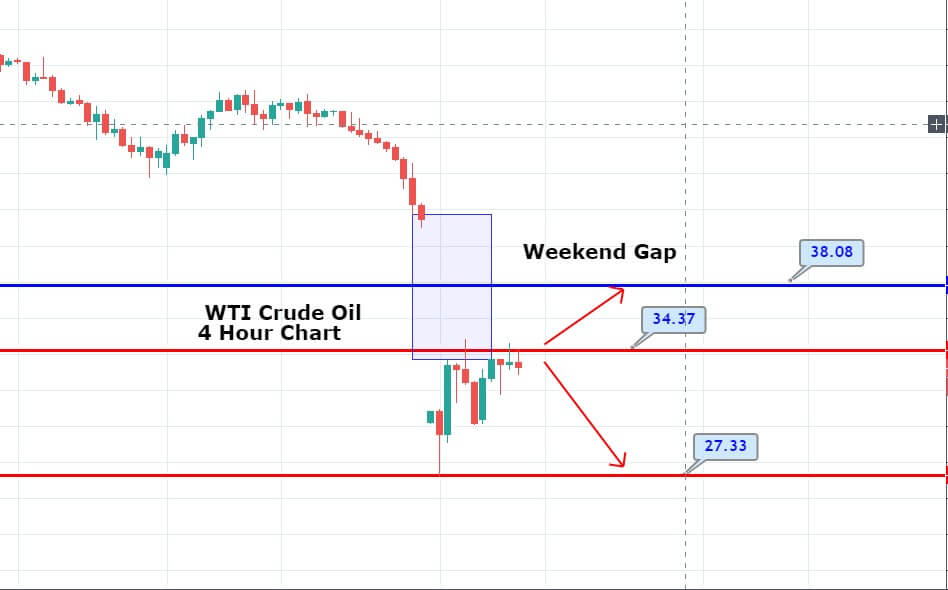
Technically, crude oil is trading at $34 per barrel, mostly maintaining sideways trading range of 34.40 – 27.33. At the moment, 34.35 resistance is very, very crucial for crude oil as the MACD is extremely oversold, and traders need a reason to long on crude oil. Breakout of 34.35/40 can be that reason which may attract some buying in crude oil and may lead its prices towards 38. Let’s look to stay bearish below 34 and bullish above 34.40 area today. Good luck! 

Categories
Forex Market Analysis

WTI Crude Oil Prices Came Under Pressure Despite OPEC Agreed To Cut Production! 

The WTI crude oil prices dropped despite the report that OPEC minister agreed to cut the oil output by 1.5 million barrels per day. It’s worth to mention that the cut is finalized after approval from Russia. A meeting of both OPEC and OPEC+ members later in the day is in focus. 

Russia’s willingness for deeper production cuts is still doubtful because recent reports suggested that Moscow was supporting an increase to the current level of cuts rather than a further reduction. The news failed to boost oil prices today because falling U.S. equities places a further burden on oil markets. 

Despite some improvement in prices this week, the WTI is still below 24% on the year, and the coronavirus is playing a major role. The coronavirus cases continue to rise in the world’s largest economy. Some time ago, the U.S. Vice President Mike Pence accepted that they have a shortage of virus testing kits for now. Moreover, New York officials also recently crossed wires while saying that the coronavirus infects nearly 2,733 people in the city, which is also putting bearish pressure on the crude oil prices.

Daily Support and Resistance

  • S1 42.01
  • S2 41.76
  • S3 41.42

Pivot Point 43.51

  • R1 43.72
  • R2 44.26
  • R3 45.01

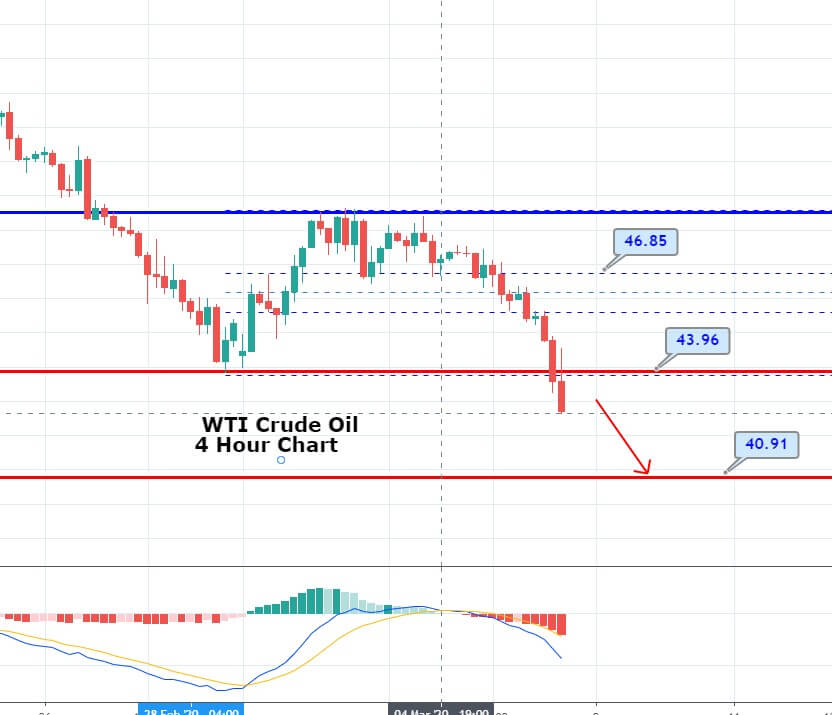
On the technical front, the crude oil price has broken below the double bottom support level of 43.95, which opens up further room for selling until 40.95. Recently, the MACD of crude oil has also forming bigger histograms on the 4-hour chart, which are supporting the selling trend in the WTI prices. Closing of candles below 43.96 may confirm the chances of more bearish bias in the WTI prices today. Let’s consider staying bearish below 43 to target 42.25 and 41.75. Good luck! 

Categories
Forex Market Analysis

WTI Crude Oil Prices Rose – Eyes On OPEC Meeting

The WTI crude oil prices rose because the traders evaluated the latest headlines regarding OPEC’s meeting this week. At the moment, the U.S. Crude Oil WTI Futures gained 1.4% to $47.45.

According to earlier reports, the OPEC+ alliance will agree to a total production cut of at least 1 million barrels per day from this quarter onward to fight the impact caused by the deadly coronavirus outbreak.

On the other hand, the prices were also supported by a lower-than-expected rise in crude oil inventories in the United States, easing some concerns of oversupply in the world’s biggest oil consumer.

It is deserving to consider that Saudi Arabia wants extra cuts of 1 million to 1.5 million BPD for the next quarter and to retain current reductions of 2.1 million BPD in place until the end of 2020.

The geopolitical tensions in the Middle East also increased prices. The Saudi-led alliance fighting in Yemen said it had stopped an attack on an oil tanker off Yemen’s coast on the Arabian Sea.

The WTI crude oil inventories rose by 785,000 barrels for the week ended Feb. 28, the EIA said. That contrasted with forecasts for a build of 2.64 million barrels.

Daily Support and Resistance

  • S1 44.01
  • S2 45.76
  • S3 46.52

Pivot Point 47.51

  • R1 48.27
  • R2 49.26
  • R3 51.01

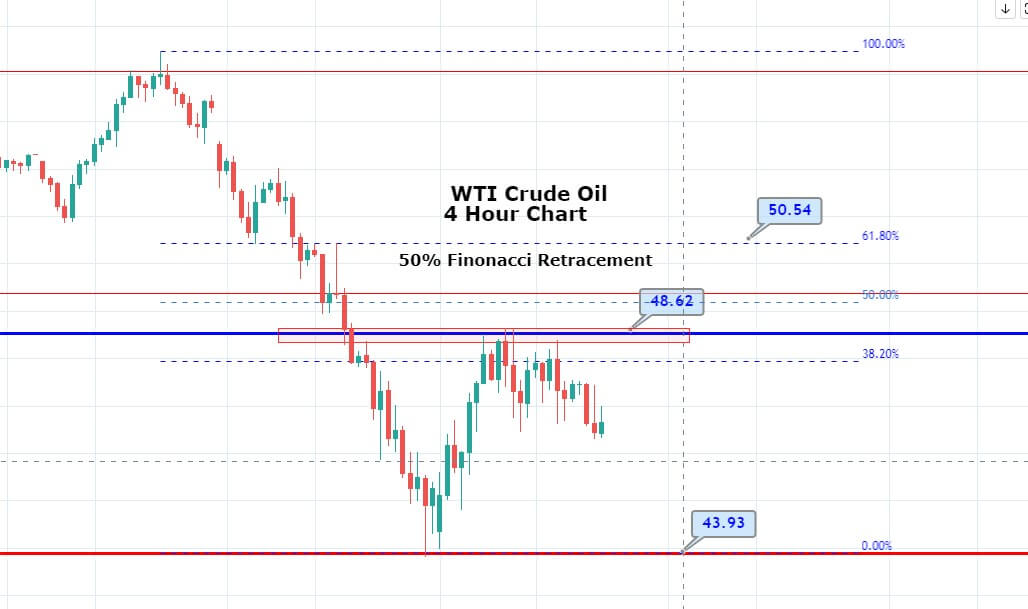
On the technical front, the WTI crude oil prices have completed the 38.2% Fibonacci retracement at 48.50 level. Closing of candles below 38.2% Fibo level is driving further bearish bias for the crude oil, and it may lead its prices towards the next support area of 45. Continuation of a selling trend can cause a further drop to 43.85. Alternatively, the bullish breakout of 48.50 can lead oil towards 50 and 50.54 levels. The MACD is crossing into the selling zone, supporting the bearish bias. Consider looking for sell trades below 47 today to target 46.10 and 45.86. Good luck! 

Categories
Forex Market Analysis

WTI Crude Oil Drops Amid Coronavirus Fears – 61.8% Fibonacci Level In Focus! 

The WTI crude oil prices flashing red and dropped to $53.42 because the fears of coronavirus burdened on the crude inventories. The U.S. Crude Oil WTI Futures dropped 0.9% to $53.42.

The WTI oil inventories increased by 414,000 barrels for the week ended Feb. 14, the EIA said. That compared with expectations for a build of 2.5 million barrels, according to forecasts. The data supported crude oil prices yesterday, which raised more than 1% before decreasing today due to intensifying fears of the new coronavirus.

The global risk-off sentiment increased further on Friday after the World Health Organization (WHO) officials gave warning that the new coronavirus may break out globally at any time. 

According to the latest report, there are now 74,675 cases of the coronavirus in China, including 2,121 deaths in the country. Outside of China, there are 1,076 confirmed cases in 26 countries. The Chinese Commerce Ministry stays ready to take further steps to control the economic impact of coronavirus.

On the other hand, the U.S. State Department recently reiterated its travel warnings while Japanese officials and German Finance Ministry reports also showed attention about the coronavirus negative impact. Looking forward, coronavirus headlines will be the key to watch for fresh direction.

Daily Support and Resistance

  • S1 51.55
  • S2 52.75
  • S3 53.24

Pivot Point 53.95

  • R1 54.44
  • R2 55.15
  • R3 56.35

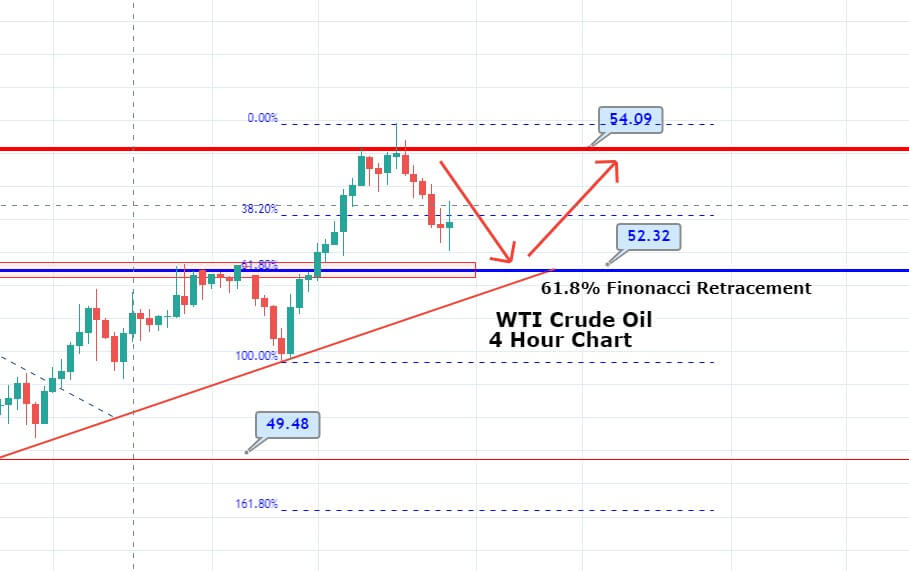
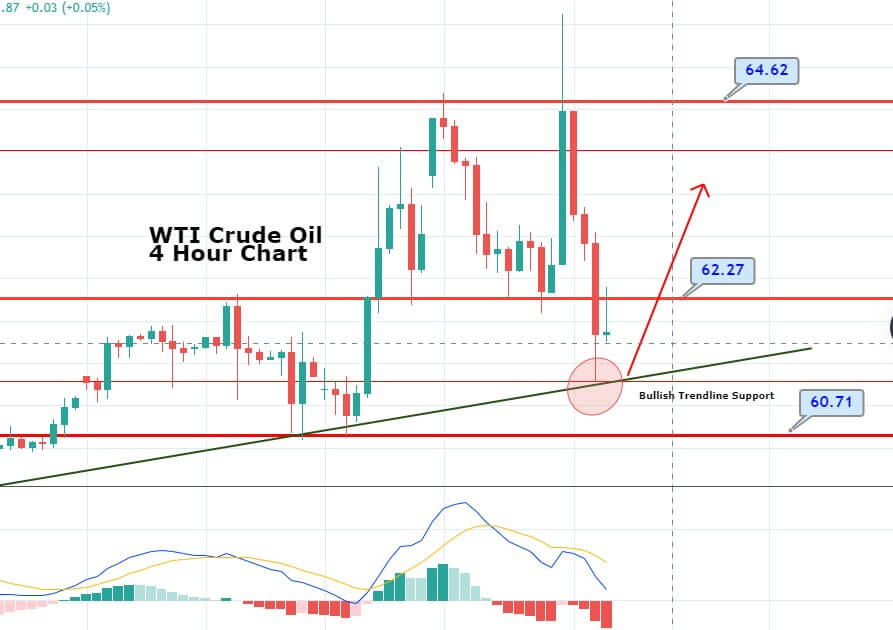
On the technical front, the WTI crude oil is trading at 52.94, heading towards 61.8% Fibonacci retracement at 52.25. On the 4 hour timeframe, the WTI prices are also expected to gain support around 52.25, which is the most extended by bullish trendline. Above this level, we may see bullish recovery in the WTI crude oil prices until 53.50 and 54. Good luck! 

Categories
Forex Market Analysis

Crude Oil’s Ascending Triangle Pattern Breakout – What’s Next?

The WTI crude oil prices dropped mainly due to falling demand in the wake of intensifying coronavirus fears. The U.S. Crude Oil fell 0.6% to trade at $51.99during the European session.

The crude oil prices recently dropped despite China’s report that the pace of virus infection in the region continued to decrease. It is worth to mention that the Chinese health authorities confirmed 1,886 new cases of coronavirus and 98 further deaths as per yesterday’s report.

China recently imposed tighter restrictions on travel and movement within the country to control the spread of the virus. The International Energy Agency announced this month that the virus could reduce oil demand by 435,000 barrels per day in the first 3-months of the year. In contrast, global experts stated it is yet too immature to announce the outbreak is being controlled.

The equity market risk-tone is getting worse, and U.S. stock futures slipped from record levels after tech giant Apple said on Monday that it would not reach its revenue target of the March quarter, due mainly to slower iPhone production and weaker demand in China, as a side effect of the coronavirus outbreak. 

Looking forward, the traders are also awaiting news from the Organization of the Petroleum Exporting Countries and its allies about deepening production cuts to support oil prices.


Daily Support and Resistance

  • S1 51.57
  • S2 52
  • S3 52.28

Pivot Point 52.44

  • R1 52.72
  • R2 52.88
  • R3 53.31

On the technical front, the WTI crude oil prices have violated the ascending triangle pattern on the lower side to trade at 51.45 level. The breakout patterns open further room for selling until 50.50 and 49.45. While the MACD has recently started forming histograms below zero level, which are suggesting odds of more selling in the WTI crude oil prices. In case the WTI crude oil violates 52.30 resistance mark, we may see crude oil prices heading towards 53.50. Good luck! 

Categories
Forex Market Analysis

Crude Oil Testing Double Top – U.S. Session Trade Setup!

The WTI crude oil prices rose slightly, mainly due to the hopes of deeper supply cuts from the major producers. The U.S. Crude Oil WTI Futures inched up 0.1% to $51.48 by 12:30 AM ET (04:30 GMT).

The Organization of the Petroleum Exporting Countries (OPEC) dropped its 2020 demand forecast for its crude by 200,000 barrels per day, indicating worries regarding the coronavirus outbreak in China, the world’s biggest oil importer.

While the International Energy Agency expected a drop of 435,000 barrels a day during the first 3-months of the year, it had previously expected world fuel consumption to rise by 800,000 barrels a day as compared to a year earlier.

The WTI oil prices have fallen nearly 20% from their tops in early January, mainly due to oil demand from China fell in the wake of travel restrictions. The China Health Commission, the epicenter Hubei province, reports 4,823 new cases on the second day of using the new diagnosing method. The number of people in severe and critical conditions rose to 9,638 from the prior figures of 7,084.

Daily Support and Resistance

  • S1 49.01
  • S2 50.24
  • S3 51.05

Pivot Point 51.47

  • R1 52.28
  • R2 52.7
  • R3 53.92

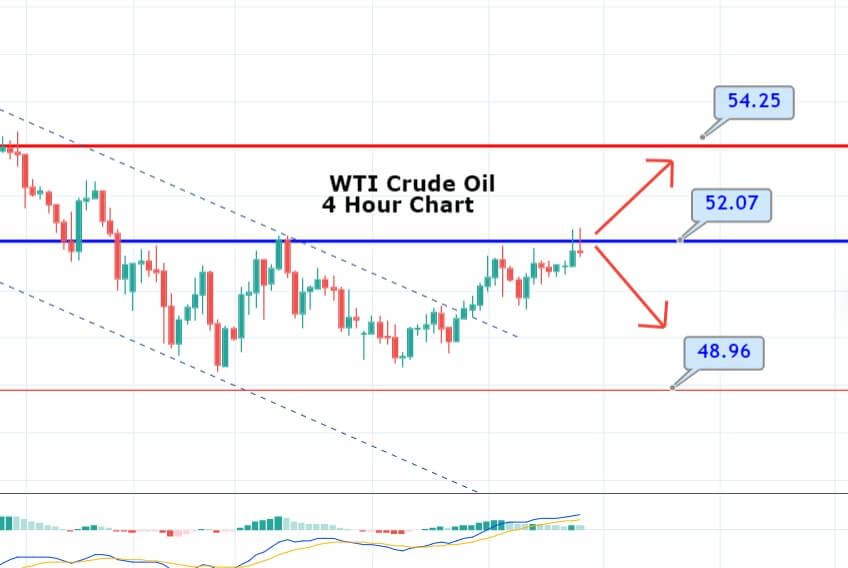
On the technical side, the WTI crude oil is holding below 52.07 resistance level, which is keeping the oil prices under pressure. The market is lacking volatility, as traders are staying out of the market ahead of the weekend. In any case, the bullish breakout of 52.07 level can extend buying until 53 and 53.25 while the selling can be seen below the 52.07 mark. The RSI and MACD are holding in the buying zone, suggesting chances of buying trends in the WTI. Today, we can place a buy stop around 52.15 to target 52.65. Good luck! 

Categories
Forex Market Analysis

WTI Crude Oil Trade Plan – Prices Rose Amid Possible Outputs Cuts by OPEC+

The WTI crude oil prices rose by 0.4% while registering $51.40, mainly due to the possible output cuts by the OPEC+. The U.S. West Texas Intermediate (WTI) crude (CLc1) futures were up 15 cents, or 0.3%, at $51.10 a barrel, also heading for a fifth consecutive week of losses.

It is worth to mention that the oil prices managed to recover despite registering an increase in the inventory numbers. By the way, oil prices got support after the latest activity figures from the global powerhouses like the U.S., E.U., and the U.K.

Crude oil prices sharply rose earlier in the session after China’s central bank governor said the world’s second-biggest economy could experience disruptions in the first quarter, while Japan announced a significant increase in confirmed coronavirus cases among thousands of passengers.

Traders now will keep their focus on the U.S. employment data and Baker Hughes Rig Counts for taking fresh directions. While January month employment figures from the U.S. are more expected to keep the U.S. dollar on the front foot, a continued drop in rig counts could help energy optimists.


Daily Support and Resistance

  • S1 46.76
  • S2 48.89
  • S3 50.08

Pivot Point 51.02

  • R1 52.22
  • R2 53.15
  • R3 55.29

The technical side of the crude oil remains bearish as the U.S. Oil is still trading bearish at 50.30, maintaining a bearish channel. Crude oil may find resistance at the double top level at 52.09, which is the same level where downward trend line tests the previous high, making it a more stronger level. On the lower side, the support is likely to be found around 49.75 and 49. Consider taking sell trades below 51.02 level today. Good luck! 

Categories
Forex Market Analysis

WTI Crude Oil Prices Rose Despite Rising Stockpiles! 

Today in the early Asian session, the WTI crude oil prices rose, although the report of the American Petroleum Institute (API) said U.S. oil inventories increased last week.

The U.S. Crude Oil WTI Futures gained 1.0% to $51.12. The WTI Crude Oil prices started tp recover yesterday after reports said the OPEC+ representatives meeting in Vienna discussed additional cuts of up to 1.0 million barrels per day to cope with lost demand from China’s coronavirus crisis.

Despite the gains this week, WTI crude oil is still down more than 20% since early January because of the coronavirus depressed global demand. It is worth to mention that the issue for the market will likely be increased if the restriction continues for an extended period because due to this demand loss will become increasingly difficult for the market to swallow.

The API said in its weekly report that crude stockpiles rose by 4.2 million barrels for the week ended Jan. 31, compared with a draw of about 4.3 million barrels reported for the week before.

At the coronavirus front, over 490 people have died in China from the coronavirus infection, said officials on Wednesday. Also, the confirmed number of infected citizens grew to 24,324 from 20,438 confirmed cases the day before.

There are still plenty to be concerned for, and the price of oil is valid, sliding further overnight to a low of $49.41bbls. Chinese oil demand has already dropped by 20% because of dwindling air travel, road transportation, and manufacturing.


Daily Support and Resistance

  • S3 45.79
  • S2 48
  • S1 48.77

Pivot Point 50.2

  • R1 50.98
  • R2 52.41
  • R3 54.62

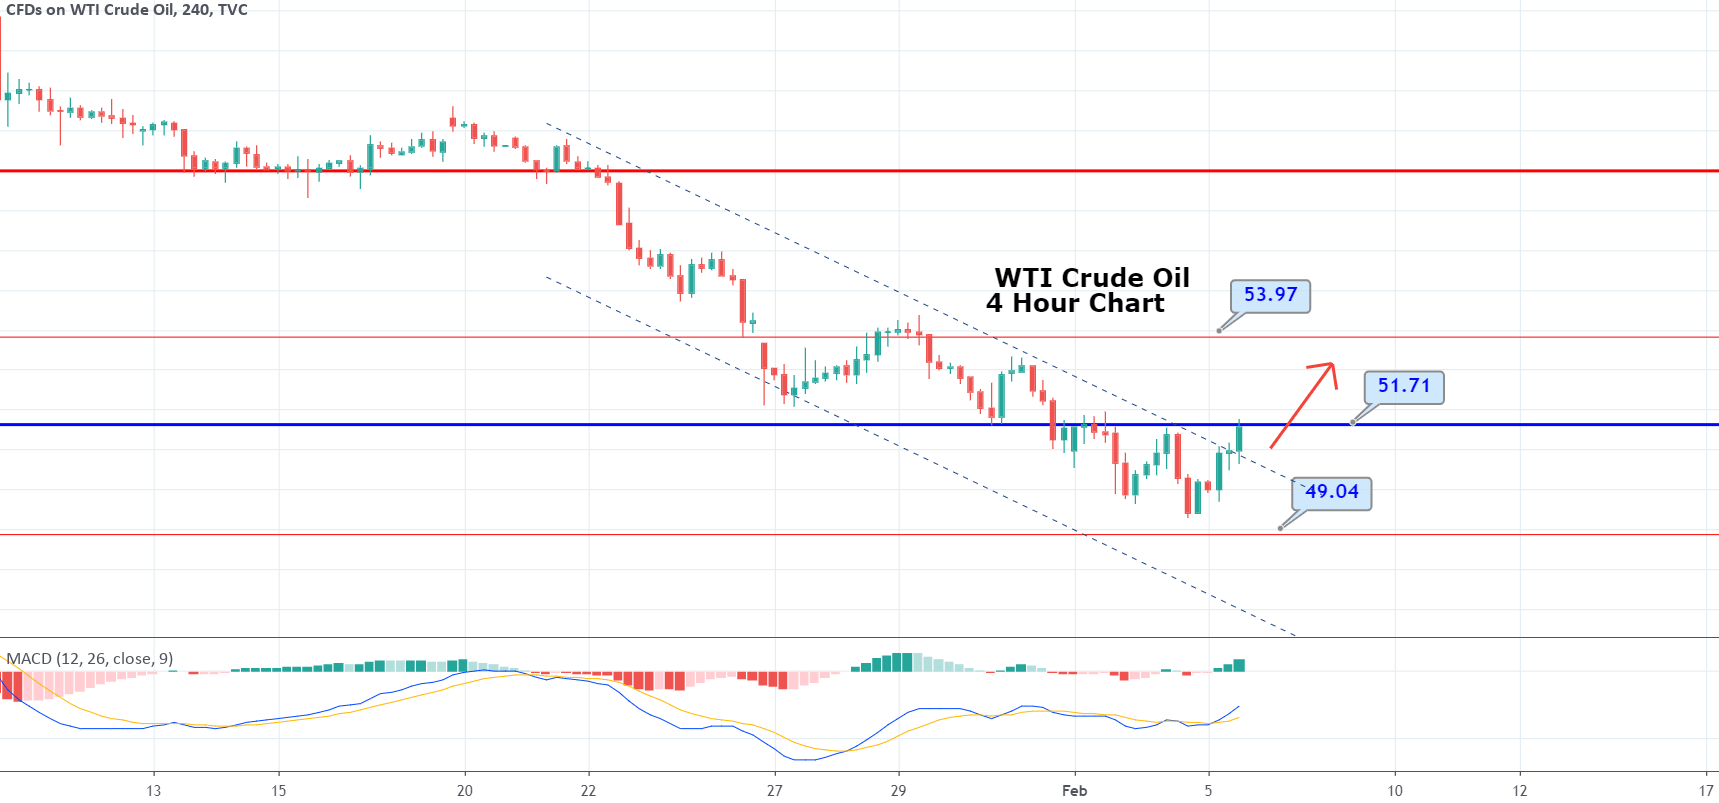
Technically, the WTI crude oil seems to violate the downward channel at 51.50, which may drive the WTI prices higher until 51.70. A bullish breakout of this level can lead oil prices further higher towards 52.25 today. The EMA and MACD are pointing into the bullish zone, suggesting the chances of a bullish trend continuation. Let’s consider taking buying trade above 51.25 today to aim for 52.25. All the best! 

Categories
Forex Market Analysis

WTI Crude Oil Prices Continue To drop Due To Coronavirus Fears! 

The WTI crude oil prices continue its losing streak mainly due to the worries of the lower demand in China in the wake of coronavirus outbreak fears. As we know, China is the biggest importer in the world.

WTI U.S. West Texas Intermediate (WTI) crude fell for a 4th-week in a row last week after airlines canceled flights to China. Supply chains across the world’s 2nd-largest economy have also been disturbed.

U.S. West Texas Intermediate (WTI) crude fell 24 cents to $51.32 a barrel, after earlier hitting a session low of $50.42. The front-month WTI price fell 15.6% in January, the most significant monthly drop since May.

At the China front, the Fears of coronavirus outbreak have increased stronger during the weekend because the number of affected peoples crossed 14,300, whereas the death losses rose above 300. Apart from the coronavirus, there is another virus that occurred in Hunan that name is H5N1 bird flu virus.

Whereas, the People’s Bank of China (PBoC) has announced to provide 1.2 trillion yuan liquidity to support money markets and ease the sell-off, whereas securities’ regulator said to stop short-selling stocks. Moreover, the authorities have also informed banks to continue to provide loans to those companies affected by the outbreak.

On the other hand, the Organization of the Petroleum Exporting Countries (OPEC) and its allies will likely do the meeting in February instead of in March, to discuss the impact on oil demand from the virus flare-up. Already, OPEC and non-OPEC’s Joint Technical Committee (JTC) have scheduled to meet in early February to assess the impact of the virus.


Daily Support and Resistance

  • S3 47.46
  • S2 49.74
  • S1 50.71

Pivot Point 52.01

  • R1 52.99
  • R2 54.29
  • R3 56.57

The WTI crude oil prices are holding above the double bottom level of 51.04, which is very much likely to get violated considering the ongoing fundamentals in the market. If this happens, the next target for WTI will be 49.05. Let’s wait for a breakout to enter a sell trade today. Good luck! 

Categories
Forex Market Analysis

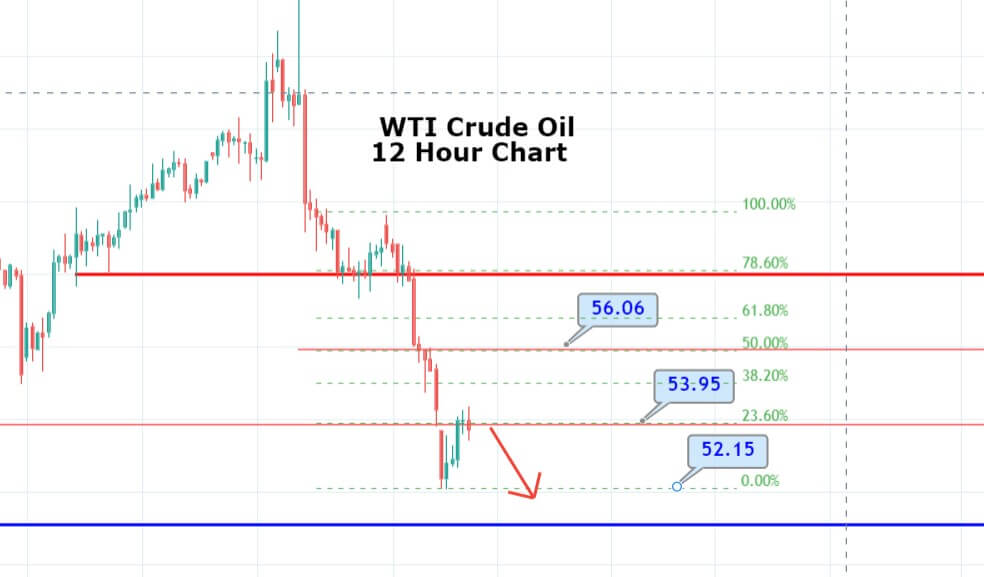
Crude Oil Completes 23.6% Retracement – Who’s Up for Selling?

The WTI crude oil is trading with a bearish bias at 53.85 level, which marks the 23.6% Fibonacci retracement level. Most of the bullish recovering in oil prices came in response to the inventory report released by the API. 

The inventories of U.S. crude sank dramatically during the previous week. The API posted a dip of 4.3 million for the week concluded Jan. 24 versus the build of 1.6 million announced last week.

The WTI crude oil prices grew 1.6% in response to the report in post-settlement trading. For now, the eyes will remain on the Energy Information Administration report, which is due at 10:30 AM ET Wednesday. The economists are expecting a build in crude stocks of 482,000.


Daily Support and Resistance

S3 50.85
S2 52.21
S1 53.1
Pivot Point 53.58
R1 54.47
R2 54.95
R3 56.32

The WTI finally dispensed some bullish momentum. However, it still lingers beneath 55.30. The leading technical indicators such as the RSI and Stochastics are in the oversold area, though it’s attempting to come out of the oversold territory. 

Currently, U.S. Oil may find support nearby 51.30. So we can watch for bearish trades beneath 55.30 and bullish over 53.50.

Good luck!

Categories
Forex Market Analysis

WTI Crude Oil Prices Rose Amid Fresh Fear of China Coronavirus! 

The WTI crude oil prices flashed green and rose to $55.84 after dropping to 9-week lows, mainly due to the fears regarding China coronavirus. The U.S. West Texas Intermediate futures (CLc1) were 24 cents up, or 0.4%, higher at $55.83 a barrel. The contract fell 2% on Thursday and is 5% lower for the week.

On the front of the main headlines, the market’s risk tone has already badly shaken by the headlines from China regarding the increased number of affected people and deaths because of coronavirus. China has reportedly blocked millions of people in two cities to prevent the virus spread.

Whereas the World Health Organization (WHO) still needs some time to understand the cause behind the coronavirus as an international threat. The SARS fighting team of China returned to find the reason and battle the coronavirus.

On the flip side, oil inventories dropped by 405,000, the EIA reported in its weekly report. Traders were looking for a drop of about 1 million barrels for oil inventories.

After the massive build in fuels during the previous two weeks, you can say that this is slightly positive news for the crude oil future buyers, as well as it did not prove to be much help because the market’s worries are all on China’s demand now, under the coronavirus problem.

While we had a near 1-million barrel decline in Cushing stockpiles, U.S. crude exports fell about 70,000 bpd on the week, and production remained at an unreasonable high of 13 million bpd.


Daily Support and Resistance       

S3 52.98

S2 54.25

S1 54.97

Pivot Point 55.51

R1 56.24

R2 56.78

R3 58.04

Technically, crude oil has violated the horizontal intraday support level of 55.90, which is now working as resistance for oil. It’s trading at 54.50, having formed strong bearish candles, which are known as “Three Black Crows.” These patterns are likely to drive more sales until 53.95, the next support level for crude oil. The MACD also supporting the strong bearish trend in the crude oil, although there’s a need for a bullish correction. Let’s consider to take sell tradings below 55 today to target 53.95. Good luck! 

Categories
Forex Market Analysis

Crude oil gains support – Is It a good time to go long?

The WTI crude oil prices unchanged and maintain its biggest gain in the wake of sluggish economic growth in China, the world’s largest crude importer, as it increased concerns regarding the fuel demand.

In the 4th-quarter of 2019, the world’s 2nd-largest economy grew by an expected 6% from a year earlier, whereas the full-year expansion was 6.1%, the slowest in 29 years. The U.S. West Texas Intermediate dropped 7 cents at $58.45 a barrel, having risen more than 1% in the previous session. The contract was down about 1% for the week and also set for a second weekly decline.

WTI crude oil prices rose yesterday after the United States and China signed the phase-one trade agreement. The sentiment in the market was further recovered after the United States Senate approved changes to the U.S.-Mexico-Canada Free Trade Agreement.

On the flip side, decreasing chances of the US-Iran war and the U.S. dollar strength, which generally weighs on the commodity basket. The International Energy Agency gave a dark picture of the oil market outlook for 2020 on Thursday. The agency expected that oil supply would exceed demand for crude from the Organization of the Petroleum Exporting Countries (OPEC), even if members are fully compliant in their agreement with Russia and other producers to curb output, a grouping known as OPEC+.

On the other hand, the United Arab Emirates energy minister said this week that he is expecting a positive meeting with OPEC and its allies to meet next in March.

Daily Support and Resistance

S3 55.83
S2 57.1
S1 57.86
Pivot Point 58.37
R1 59.13
R2 59.64
R3 60.91

The U.S. Oil is holding around 58.80 with a bullish bias to target a 23.6% Fibonacci retracement mark of 59.46. On the higher side, further bullish bias can lead to crude oil prices towards 60.60, which marks 38.2% Fibonacci retracement. Today consider staying bullish above 58.40 to target 9.45. Good luck!

Categories
Forex Market Analysis

WTI Crude Oil Prices Jumped On US-Iran War Sentiment! 

Earlier today, the WTI crude oil prices hit the bullish track and climbed to 1.3% to $63.53, mainly after Iran attacked two United States airbases in the wake of U.S. airstrike that killed the Iranian general last week, flashing worries regarding the escalating conflict between the United States and Iran.

The U.S. crude oil later fell from $63.53 to trade around $62 during the European session. Crude oil prices soared as much as 5% earlier in the day following the news, but gave up all of their increases following in the day as Iran’s foreign minister announced it had “settled proportionate steps in protection” and is not attempting war.

Supply worries extended due to an intensifying conflict between the United States and Iran after the U.S. airstrike killed general Qassem Soleimani last week. In total13 missies have been reported launched at the Ain Assad Air Base. White House answers they are aware of the attack, and U.S. President Trump has been briefed and is monitoring the situation.

It is worth to mention that the United States President Donal Trump will make a statement tonight. With this, the U.S. Defense Secretary Esper and U.S. Secretary of State Pompeo have arrived at the White House. On the other hand, Iran’s guards warn the U.S. any aggression against Tehran will get a worse response.

Meanwhile, the American Petroleum Institute reported that crude stockpiles dropped by 5.9 million barrels for the week ended Jan. 3, compared with a plunge of about 11.5 million barrels reported for the week before.

Whereas, the Energy Information Administration is expected to report a decline of around 3.6 million barrels when it publishes official figures tomorrow.

At the Sino-US front, the improvements on the Sino-U.S. trade front also remained as the focus. The two nations were reportedly going to sign a phase one trade deal on Jan. 15.

Daily Support and Resistance

S3 57.4

S2 60.7

S1 62.71

Pivot Point 64.01

R1 66.01

R2 67.31

R3 70.62

Looking at the 4-hour timeframe, the WTI prices are holding around 62 after violating the support level of 62.30. Crude oil is now facing support around 61.30, which is extended by an upward trendline. The WTI prices are likely bouncing off above this level to target 62.30.  

On the chart above, we can see the WTI seems to form a Doji candle, which is followed by a strong bearish bias. Typically such candles drive bullish trends in the market. I will consider taking buying positions above 61.20 to target 62.27. Above 62.30, the U.S. Oil can soar up to 63. Good luck! 

Categories
Forex Market Analysis

Crude Oil Completes 23.6% Retracement – EIA Report Ahead! 

The WTI crude oil prices continue to increase, mainly due to intensifying tension in the Middle East. The U.S. Crude Oil WTI Futures jumped 2.9% to $62.98 yesterday.

Reports came from the Middle East that the airstrike killed key Iranian and Iraqi military, and consequently, the tension increased as well as the concerns of crude oil supplies diruption increased too, so that’s why oil markets are hugely supported today.

On the other hand, the WTI crude oil prices gained support from the announcement of the People’s Bank of China that it was cutting the amount of cash that banks must hold in reserve, releasing around 800 billion yuan ($115 billion) in funds to support the slowing Chinese economy.

Meanwhile, the Positive data that showed China’s production activities business confidence rose. President Trump is expected to take a break on being ‘tariff man’ until we get beyond the presidential election in November. Besides this, Trump said a phase one trade deal would be signed on Jan. 15 at the White House.

Meanwhile, the sentiment around the oil markets remains underpinned by the US-China trade deal optimism and declining US crude inventories, as reported by the American Petroleum Institute (API) earlier this week. The API data showed a draw of 7.8M barrels of oil for the week ending Dec. 27.

For now, the WTI barrel now awaits for the weekly US Crude Stocks data due to be published by the Energy Information Administration.


Daily Support and Resistance

Support Resistance
63.09       63.47
62.85       63.6
62.47       63.98
Pivot Point 63.23

The WTI crude oil is holding in the overbought zone at 63.50, having an immediate resistance around 64 and support at 62.75. The U.S. Oil has already completed 23.6% Fibonacci retracement at 63.15. 

In case, the EIA reports another draw in U.S. Oil stocks; we may see further buying in crude oil prices until 65. Alternatively, the oil may extend the bearish trend until 62.75, which marks a 38.2% Fibonacci retracement level. All the best! 

Categories
Forex Market Analysis

Dramatic Dip in Crude Oil – Bullish Channel Breakout 

During the European session, the WTI crude oil prices were unchanged near the 3-months highs due to optimism surrounding the United States and China trade deal that has left an impact on the oil demand as well as the global economic growth outlook.

The WTI crude oil has dropped dramatically from 61.01 to 60.35 level upon the bearish breakout of the bullish channel and bearish fundamentals. 

It should be noted that the improvement in an 18-months trade war between the United States and China, the world’s two biggest oil consumers, had raised expectations for higher energy demand next year.

China on Thursday declared a list of import tariff exemptions for six oil and chemical products from the United States, days after the world’s two largest economies announced an incomplete trade deal. 

As a result, U.S. Oil is facing intense bearish pressure. What’s next? The technical side of the market is likely to extend support around 60.30, and below this, the black crack can drop until 59.65 support zone. 


Daily Support and Resistance

  • S3 59.65
  • S2 60.35
  • S1 60.71

Pivot Point 61.04

  • R1 61.4
  • R2 61.74
  • R3 62.44

The RSI and MACD have entered the selling zone, and demonstrate strong bearish bias among traders. As we can also see, the upward channel which supported the oil around 61 has already been violated, and now 61 is likely to work as resistance for crude oil. Consider trading bearish below 60.74 today and buying above 59.65. All the best!

Categories
Forex Market Analysis

WTI Crude Oil Slipped Amid Rising Crude Inventories – Quick Trade Plan! 

The WTI crude oil prices are flashing red and traded lower after the American Petroleum Institute reported a large build of weekly crude inventories. The WTI crude oil inventories increased by 4.7 million barrels in its snapshot of stockpiles for the week ended December 13, the API said.

The U.S. government data is anticipated to point a drop of 1.3 million barrels while the Energy Information Administration(EIA) publishes its weekly figures.

In the previous week, the EIA announced the advance of a crude stock of 822K barrels versus a market forecast for a dip of 2.76 million barrels.

The WTI crude oil prices got some benefit earlier in the day after data showed U.S. November manufacturing output and housing figures both outperformed expectations.

It should be noted that the declines in crude oil prices have been limited due to Sino-US trade optimism. A phase-one trade deal was agreed between the United States and China last week, decreasing some fears over the economic impact of a continued dispute between the two biggest crude oil importers. 

Technically, the WTI is trading in a bullish channel, which is supporting it around 60.20, while the same bullish channel is likely to resistance around 62.22. 

On the way to upside, the WTI crude oil may find a horizontal resistance level around 61 while the RSI and MACD are suggesting bearish bias. Lately, the crude oil has formed a series of neutral candles which exhibits indecision among traders.

Daily Support and Resistance

  • S3 58.49
  • S2 59.48
  • S1 59.97

Pivot Point 60.47

  • R1 60.96
  • R2 61.46
  • R3 62.45

Consider taking buying trade above 60.20 to target 60.50, and above this, the WTI may soar to test 61.10. Good luck! 

Categories
Forex Market Analysis

Crude Oil Bearish Retracement In Play – Brace for a Bullish Trade!

The WTI crude oil prices slightly dropped even after positive headlines regarding the United States and China trade news. Chinese state media Xinhua reported that Chinese Vice Premier Liu He discussed an incomplete deal with U.S. Treasury Secretary Steven Mnuchin and U.S. Trade Representative Robert Lighthizer in a phone call during the weekend.

Both sides had helpful discussions about “each other’s core concerns,” the article said. The USTR confirmed the call took place. Besides, the Asian stocks got the support due to the headlines, but unfortunate WTI crude oil prices were little impacted.

A monthly report from the International Energy Agency (IEA) was cited as a potential catalyst for selling today. The IEA estimated that non-OPEC supply growth would grow to 2.3 million barrels per day (BPD) next year compared with 1.8 million BPD in 2019.

Daily Support and Resistance

S3 54.44
S2 55.98
S1 56.99
Pivot Point 57.53
R1 58.54
R2 59.08
R3 60.63

The oil prices remained under pressure over the data that showed weekly U.S. crude stockpiles surge by 2.2 million barrels, crossing the forecast of a 1.649 million-barrel rise.

WTI Crude Oil – Trade Idea 

Consider taking buying positions above $57.20 with a take profit at $57.75 and stop loss of $56.90.

Categories
Forex Market Analysis

WTI Crude Oil Completes 38.2% Retracement – What’s Next?

The WTI Crude oil prices dropped As the Energy Information Administration, EIA reported that the U.S. oil inventories increased unexpectedly last week.

The EIA said oil stockpiles rose by 7.9 million barrels, compared with expectations from analysts for an increase of about 1.5 million barrels.

From now, we expect many negative factors to increase. The risk we feel, especially with the recent crude oil inventories builds and reduction in demand anticipates, could be the bearish trend in the prices in the energy markets.

WTI crude oil prices got some support during the starting of this week due to expectations that China and the United States were close in the signing of the trade deal.

As per the recent updates, the report came that the signing of the deal may not be signed during this month and will likely happen later this month. By the way, it all depends on the discussion between the Sino-US.

Daily Support and Resistance

S3 53.37
S2 55.09
S1 55.75
Pivot Point 56.8
R1 57.46
R2 58.52
R3 60.23

Technically, the WTI crude oil has completed a 38.2% Fibonacci retracement on the 4-hour chart. Closing of Doji candles above this level is suggesting bullish bias among traders. Most importantly, crude oil has recently closed a bullish engulfing pattern, which may drive sharp buying in the black crack.

On the upper side, crude oil may face resistance at 57.50, along with support at 56.20. I will be looking to trade a choppy session today until this range breakout.

All the best!

Categories
Forex Market Analysis

WTI Crude Oil Exhibits a Weekly Gain – Supply Concern Weights!

On Friday, the WTI crude oil prices continue to hold bullish bias maintaining substantial weekly gains as support from a surprise draws in U.S. inventories and possible action from OPEC and its allies to increase production cuts burdened broader economic interests.

The strong buying in crude oil was mostly underpinned by the surprise plunge in U.S. stockpile data. The U.S. crude oil inventories fell by about 10 million barrels during the previous week.

Whereas, the officials at the Organization of the Petroleum Exporting Countries (OPEC) remarked to extended supply cut is an option to balance the softer demand outlook in 2020, hence extending another reliable support to the WTI crude oil prices.

Technically, the WTI has violated an asymmetric triangle pattern, which keeps the crude oil prices on hold between 54.75 to 53.50. The violation of this range has pushed crude oil higher towards 56.50 area.

WTI Crude Oil – Daily Technical Levels

Support Resistance
55.5 56.59
54.91 57.1
53.82 58.19
Pivot Point 56.01

At the moment, crude oil is facing stiff resistance at 56.50 area. However, the WTI is looking to complete bearish retracement on the 240 mins chart. Crude oil has already completed 23.6% Fibonacci retracement at 55.85 area, and below this, further sell-off is expected until 55.50.

Despite the bearish correction, I would suggest looking for a bullish trades above 55.30 level today. All the best!

Categories
Forex Market

Trading Energy Commodities – Crude Oil, Coal & Natural Gas

Introduction

Energy belongs to that category of commodities, which has the most significant impact on our daily lives. Energy prices affect the cost of almost everything that we consume on a daily basis, including the clothes we wear, the fuel we put in our cars, and the electronic gadgets. They, in turn, determine the increase or decrease in the prices of homes, hospitals, schools, etc. We cannot imagine ourselves in a world without energy.

The unit that is used to define the quantities of energy is the British thermal unit (Btu), which measures the heat content of fuels. According to the Energy Information Agency (EIA), every year, worldwide energy consumption exceeds 575 quadrillions Btu and is expected to reach 736 quadrillions by 2040.

Major energy commodities

Highly traded energy commodities are from non-renewable energy sources, except for ethanol and electricity generation. These commodities are very liquid when it comes to trading. Traders can also invest in these commodities through ETFs and CFDs.

Crude oil

Crude oil is one of the most actively traded commodities in the world. The price of crude oil affects many other commodities, including natural gas and gasoline. Crude oil comes in different grades. Light Crude oil is traded on the New York Mercantile Exchange (NYMEX). This type of crude oil is popular because it is the easiest to distill into other products. The next grade of oil is Brent Crude oil, which is primarily traded in London and is seeing the increasing interest. The last grade of oil is the West Texas Intermediate (WTI) oil from U.S. wells. The product is light and sweet and is ideal for making gasoline. The reports for crude oil are found in the U.S. Energy Information Administration (EIA) reports. This report is released every Wednesday around 10:30 PM ET. Traders take investment decisions based on the data of this report.

Coal

Coal is a fossil fuel that is formed from dead plant matter trapped between rock deposits. Coal is used as an energy source for hundreds of years. This mineral generates 41% of the global supply of electricity and plays a crucial role in other industries. The top 5 coal-producing countries are China, the USA, India, Australia, and New Zealand.

Natural gas

Natural gas is formed either by methane-releasing microorganisms in swamps or by pressurizing organic material deep underground. Three major reserves for natural gas are Canada, USA, and Russia. This commodity has many applications, from electricity generation to fertilizers. Natural gas futures and ETFs are available for traders and investors. The price of natural gas depends on the demand and supply of the commodity itself.

Energy commodities can also be traded through Forex Brokers these days. Many of the credible and regulated and unregulated Foreign exchange brokers allow their customers to trade all the major energy commodities like Crude Oil, Coal, and Natural Gas.

Factors affecting the prices of energy commodities

  • Market growth
  • Energy efficiency
  • Population growth
  • Electricity penetration
  • Industrialization in developing economies

Conclusion

Investors who want to invest in the energy sector should track the indices of that sector. These indices measure the production and sale of energy. One can also monitor the performance of energy company shares prices. Energy company’s revenue depends on the price of the commodity they are selling. Other factors include production costs, competition, and interest rates. That’s about Energy commodity. Cheers!

Categories
Forex Elliott Wave Forex Market Analysis

Divergence between Gasoline and Crude Oil

A divergence between Gasoline and Crude Oil

Gasoline and Crude Oil are two energy commodities highly correlated. In the current session, Gasoline is moving bearish, but Crude Oil is moving bullish. We expect that Crude Oil would make a new lower high and continue inside the area between $70.61 to $73.06 to, then, develop a new bearish leg, with a target the zone between $63.47 to $60.28. Invalidation level is $75.24.


Forex Academy

Categories
Forex Market Analysis

Transitioning Week


Macroeconomic Outlook


Bearing in mind the  current situation of the markets, it would be necessary to take positions in line with the three P strategy:

  • Priority
  • Preserve
  • Patience

It is still a good moment to take long positions, to buy banks after sell-offs, to buy retail companies and to buy industrials and technologies.

As references, this week we have:

  • Oil Price: Risk that inflation goes up with oil prices again as Central Banks act in a very dovish way every time there is a risk. Markets in the short term will be conditioned to this risk.
  • Geopolitics: Politics, tariffs and trade deals will condition the markets.

o   In the end, this situation will lead to observe if the USA realises that it does not need China as an intermediary for North Korea which will put pressure on the markets in the short term.

o   On the other side, it is politics. European politics are making a bigger noise with the uncertainty about the Italian government which is not that big, and the risk of a vote of no confidence in Spain.

o   So, bearing this in mind, the immediate influence over the markets is high. Therefore the markets slow down. However, it should not concern us that much as politics have less weight on the economies with time.

Moving to macroeconomics, there are a couple of indicators this week. Most relevant are:

  • Wednesday we have American GDP which should remain at 2.3%
  • Thursday, we have European inflation that should increase to 1.6%
  • Then on Friday, we have American wages which should go to 2.6% – 2.7%

o   Ideally 2.6%

The probability that all this happens is low plus New York and London are closed on Monday leading to a slow start. It will be a week of transition, observing all this information and digesting it to know what the reaction of the markets will be. It will be intense in the short term, but as said in the beginning, it is important to persist, have patience and remain where we are.

  • Indexes should be the place where we should remain since the expansive economic cycle continues, politics have low influence on economics, and we are in a period where global growth is happening in a positive synchronised way.


Technical Outlook


US Dollar Index


As expected, the US Dollar Index retested the recent resistance it broke it, confirming the bull trendline. For now, as we got the retest as confirmation, we remain with our bullish position.

EURUSD


After catching the first bearish wave, we are capturing the second one. We were waiting for a retest of the support for confirmation, but we did not even need it as it continued falling without chance of retesting the support. Remain bearish for now unless unexpected circumstances arise.


GBPUSD


After breaking the strong monthly support on Friday, it opens space for a short position. We were waiting for a rebound, but instead of that, we got a strong breakout which gives us the confirmation of the strength of the bearish trend. Hence, it would be convenient to change the position into a bearish one with a huge risk-reward. As for now, we leave the profit taking open until the next monthly support.

USDJPY


We will remain on the side this week as USDJPY is in a dead space between supports and resistance. Hence, we do not take any position, remain neutral and await what direction it takes.

Crude Oil


We took profits and now it is time to wait on the sides to see what happens. We’ll look closely to see which trendline it gets closer to if it continues the bullish run or breaks any near support. Looking at its reaction, we’ll take another position next week.

DAX


Retest confirmation is on its way creating another good time to enter. We remain bullish as there is nothing to be concerned about for now.


Categories
Forex Market Analysis

Are The Global Indices Bouncing Back?

Global Indices

In the last week, we have seen some bullish momentum come into the US Equity indices. We have experienced a bullish week and for now, this appears likely to extend into next week. What is interesting to note from a technical perspective is that we have now seen over the last week is a major structural break to the upside, albeit at different times with the Nasdaq leading the way, followed by the SP500 and then the DJ30. Despite all of the concerns about the global equity space, we are very close to all-time highs once more, these are definitely markets to watch over the coming weeks. Elsewhere in the global equity space, the FTSE has been the star performer and is currently trading very close to its all-time high around the 7790 level as we observe a fairly straight linear move to the upside from the 6852 lows back in March.

EURUSD

This week has seen USD bulls give back some of the territory they conquered over the past few weeks. At this stage, it looks like the move lower in the USD is a correction and will likely provide better levels to consider longs from in the near term. When observing this pullback, we can identify two significant levels of key resistance in EURUSD, firstly, around the 1.2072 and then the more important level of 1.2155, if the price gets that far. It is also worth noting that the 1.2155 level marked the significant breakout point of consolidation a few weeks back.

USDJPY

In contrast, the USDJPY has not really behaved like many other of the major dollar pairs, meaning both the dollar and the yen are both weak.  Looking at the chart below, we can see the consolidation between 108.61 and 110.04. So, the next step for this market is to be patient and wait for the breakout of either the upside level of 110.04, which is the higher probability trade or a structural failure back below the 108.61, either way, it could prove a decent trading opportunity.  However, it would take a move above 110.04 to confirm a resumption of the uptrend in this market.

GBPUSD

Cable is also looking vulnerable and the recent consolidation has taken on the appearance of a bear flag which, if correct, signals an extension lower. Sterling is also likely to remain vulnerable near-term following the BOE decision last week not to hike rates. Furthermore, the recent double top confirmation further highlights the potential for a continuation of the bearish technical outlook.

USDCHF

It might also be worth keeping an eye on the USDCHF market as well, which has this week traded back above parity at the 1.0000 level. It is also interesting to note that the EURCHF continues to hover below 1.2000, a level which the Swiss National Bank defended resolutely for so long until they removed the 1.2000 peg at 9am on the 15th Jan 2015. A break of this level to the upside any time soon would be significant and further highlight the bearish CHF outlook across the board.

GOLD

Gold has pulled away from its range base around $1303 as USD bullish pressure eases. Price actions suggest that the range based on $1303 is somewhat exposed, meaning a confirmed break below $1303 would represent a significant technical break for the yellow metal. If alternatively, gold continues to push higher next week, then we would need to consider the possibility of a move towards the top of the range around the $1357 level instead, however, a bit of patience right now is probably the wisest option.

Crude Oil

Crude oil has extended trend gains this week aided by Donald Trump’s decision to pull the US out of the Iran nuclear deal. For now, the ability for this market to hold prices above the $70 level provides an overall bullish technical signal.  We all know the current OPEC and Non-OPEC agreement till December 2018, is designed to restrict the supply of oil on a global basis in order to push the price of oil higher.  The Saudis, we believe are looking for prices to push to the $80-$85 level so don’t be surprised if we see these prices before the end of the year.

US 10 Year Note

To conclude, this weekly round-up, we should look at what is happening with the US 10-Y note, which has largely consolidated over the last couple of weeks. With yields in the US breaking above the 3% level, we are likely to see the price of the 10-year note push lower at least in the short term. The key bear trigger again is a move below the April low of 118.95, this is a market to watch over the coming weeks.

Categories
Forex Market Analysis

Opposing forces drive the markets in the upcoming week

Weekly Update

Regarding fundamentals, we are expecting opposing forces drive the markets in the upcoming week. Volatility has sparked bearing in mind the recent intervention of the USA in Syria. However, stock futures are up, and oil is down on hopes Syria attack a one-off.

Thus, we’ll focus on the most foreseeable variables. There are three variables that are mainly moving the markets

  • Protectionism
    • A less negative pressure in the short term as fears erase
    • Recent formal declarations by Chinese president rise expectations of a friendlier trade
    • There are still two months until Trump takes in action any tariff measure
  • Technology
    • Recent testimony by Mark Zuckerberg leaves good feelings and calms the markets
    • Relieves pressure on technology companies
  • Quarterly results
    • 2018 benefits are revised downwards
    • However, 1st quarter is expected to be robust with strong corporate volumes and margins which will be positive in the short term
Macro Data

This week there is no major macroeconomic event that will affect considerably the markets.

On Monday we have American Retail Sales which are expected to increase to 0.4% from the last- 0.1%. This can benefit the US Dollar. On Tuesday, the German ZEW Economic Sentiment can have some impact on the Euro and DAX. It is expected to decrease to -0.8 from 5.1. Finally, on Thursday, the American Manufacturing Index is released, and it is expected to decrease around one point.

In general, the macro outlook is more pessimist than positive. However, the previous three variables provide a more positive outlook and provide a better understanding than the macroeconomics events on how the markets will act this week. So that, we could expect a stabilization phase in the markets after the recent volatility. In general, slightly more positive than negative.


 USD Index

Weekly Chart


In the weekly chart, it is possible to appreciate how the USD Index is not only below the 200 EMA but also broke below the weekly support that has been retesting in the recent weeks and which has not been successful so far. In the short term is facing a bearish trend line caused by its recent devaluation.

During the first half of this week, there are not big news. However, on Wednesday, American Inflation numbers come out. It is forecasted that the core CPI will increase to 2.1% from previous 1.8%. Furthermore, on Friday, Moody’s published its USA rating, which right now has the highest rating possible with stable perspective. Hence, recent controversial policies from the American government making protectionism and a trade war a reality can alter the expectations for the mention economic events. In case the forecast does not vary the USD should not be hurt. However, an unexpected increase in the Core CPI and a rating downgrade from Moody’s can really hurt the Dollar.

Daily Chart 

The daily chart is similar to the weekly chart. The retest cannot break above the recently broken support and is facing more bearish pressure ahead. Nevertheless, it just formed double bottom pattern followed by a short-term bullish trendline. This week will be critical to know whether the bearish support is strong enough or it holds on to the current bullish trend.

EURUSD

Daily Chart

Regarding the EURUSD, it has been flat since February. Last month it broke its monthly bullish trend, and the consequently retest it.  From there, it has remained flat with no major fluctuations. However, with the recent uncertainties facing both the Eurozone and the USA it will not be surprising to see the EURUSD leaning towards a side. For now, it is holding at a strong resistance that dates back to September of 2017.  It is facing a couple of support and resistance which will help to know towards what side it will lean and leave the rectangle it is in now.

USDJPY

Daily Chart

Moving into the USDJPY, it has just bounced from a monthly bullish trend after doing a fake breakout and consequently bouncing back. A bullish trend could be considered since there are not big resistances ahead part from the 200 EMA and the recent bearish monthly trend. In the short term, there are two resistances not very strong, but that may cause a small retracement. However, the monthly support is stronger than the resistance it is locked up between.

GBPUSD

Daily Chart

GBPUSD seems to have no limits. At the beginning of the year, the Pound broke an important bearish trendline holding to its current bullish trendline. Moreover, last week just broke another key resistance. With no more important resistance ahead it has a clear path to keep up with the current upward trend. Maybe it is possible to do small retest as we saw with the previous one.

Crude Oil

Daily Chart

Recent political events, like the recent issue of the missile attack against Syria, have created volatility in the markets and consequently, the price of oil has been on the rise. After holding to the trendline and breaking above $65 it is possible to see a retest of the recent resistances it just broke above. Without more resistances ahead, analyst set that next target is $70 per barrel.

DAX

Daily Chart

Regarding technical, it is within a bearish trend that can be prolonged as there is still uncertainty in terms of politics and the recent macroeconomics event have not been reaching the forecasted ones. However, an improvement in the economic sentiment and political stability can help the DAX to break the ahead resistance and enter a bullish trend, leaving the current flat to bearish trend it is involved in now.

As commented at the beginning, on Tuesday the German ZEW Economic Sentiment is released. Hence, it can major point to decide whether it breaks the recent resistance and follows the daily bearish trend.

© Forex.Academy

Categories
Forex Market Analysis

US Trade Balance Deficit Reaches the Highest Level Since December 2008

Hot Topics:

  • US Trade Balance deficit reaches the highest level since December 2008.
  • PMI Markit Composite of the Eurozone shows signs of a slowdown.
  • PMI UK Services falls to the lowest value since 2016.
  • Yen fails in its attempt to approach the 108.
  • Aussie developing the second leg.
  • Loonie moves sideways while waiting for the employment data.
  • Dow Jones closes bearish on new tariffs to China.
  • Crude Oil performs a pullback towards the $64 level.

US Trade Balance deficit reaches the highest level since December 2008.

February 2018 Trade Balance, has reached its highest level since December 2008, as indicated by the Department of Commerce. The deficit in goods and services for the year to date has increased by 22.7% ($ 21.1 billion) compared to the same period of 2017. Exports, meanwhile, have increased 5.9% ($ 22.4 billion) and imports have risen 9.1% ($ 43.6 billion).

On the technical side, the Dollar Index has reached the control area we mentioned in the last Daily Update. Now we have to wait for a confirmation of the reversal zone to look for continuity in the bearish positions against the dollar.


PMI Markit Composite of the Eurozone shows signs of a slowdown.

The Purchasing Managers’ Index (PMI) published by the agency Markit Economics, has reported a sharp fall in March, reaching 55.2 points, below February’s  57.1 pts. This lower PMI Index level is a sign of deceleration in new orders growth. This situation may be the result of a combination between the consequences of inclement weather in some regions of northern Europe and a limitation in the capacities of the supply-chain to meet the number of orders that have been accomplished in previous periods. Despite these pessimistic signals, as reported by the latest Daily Update, the Euro has drilled 1.2240 control support, at which we began to assess potential purchases that could take us to levels close to 1.235.


PMI UK Services falls to the lowest value since 2016.

The Service Purchasing Managers’ Index has sunk to its lowest registered value since 2016, reaching 51.7 pts compared to the 54.5 pts reported in March. This index value is worse than its quarterly moving average of 53.07 pts. As a result of this data, the cable has perforated the psychological support of 1.40, reaching 1.3965. This break-down has activated a Head-Shoulders pattern, which level of invalidation is above the 1.42 level. However, our long-term vision is in favour of long positions of the pound due to the weakness expected in the Dollar Index.

Yen fails in its attempt to approach the 108.

The weakness of the dollar has caused the yen to fail in its attempt for the USD-JPY to reach 108. In the midst of trade tension between the United States and China over tariffs, the yen exceeded 107, the key resistance that we were reporting in the last Daily Update reaching 107.44. The Japanese currency is developing a bearish leg to 107.01, a level that could act as support in the future. In today’s session, in where the US employment levels will be announced, we expect it to build enough volatility to validate if the pair manages to overcome the long-term resistance at 108.


Aussie developing the second leg.

The oceanic currency is developing a corrective structure that began at the 1.8135 high level, starting in January. The price is currently approaching a long-term bullish trend-line, and the bearish guidelines of the current formation give us a potential reversal zone between 0.7620 and 0.7573, the invalidation level is below 0.7501.


Loonie lateralizes while waiting for the employment data.

The Canadian dollar is consolidating in the range of 1.2745 – 1.28 pending the employment data from the United States and Canada that will be announced in the last trading session of the week. Our view is that the USD-CAD could make a limited bearish movement until 1.2715 to begin a bullish move as a potential second shoulder. Our long-term outlook for the pair continues to be bearish due to the inverse correlation with crude oil.


Dow Jones closes bearish for new tariffs to China.

The escalation of volatility due to tariffs between the United States and China continues. During this Thursday, President Trump has instructed the Trade Representative to consider the application of $100 billion in additional tariffs against China. In a statement, Trump said: “In light of China’s unfair retaliation, I have instructed the USTR to consider whether $100 billion of additional tariffs would be appropriate under section 301 and if so, to identify the products upon which to impose such tariffs.” Once this statement was published, the Dow Jones index that started the bullish session collapsed more than 400 points testing 24,037 points. Our vision is a scenario in which the Dow Jones could perform a corrective process in the form of A-B-C, as long as the price does not close below 23,330 pts, we will maintain the view of bullish positions.


Crude Oil performs a pullback towards the $64.

Crude oil has retreated to the neckline of the Head-Shoulder pattern at $64.1 that has been activated with a profit target at $61.8. The falls could reach even $61.44, a level that could coincide with the base of the long-term uptrend line. The invalidation level of the long-term bullish scenario is $60.2.

©Forex.Academy