Technical Analysis; The Difference Between Leading and Lagging Indicators
When it comes to technical analysis, there are literally dozens of indicators which are available to traders. Choosing the right one for you will depend on your trading style and methodology. Most new traders will go through a process of trial and error when it comes to choosing the correct technical indicators for them. However, it is critical that you know how they work and how they can affect your trading.
Technical indicators are tools and fall into two brackets: leading and lagging indicators. Lagging indicators capture the movements of historical price action data and plots this information onto a chart screen. Traders decipher the patterns and then use it to determine entry and exit points by accessing if a pair is overbought and likely to fall, all or if it oversold and likely to rise, or if it is sideways trading.
Example A
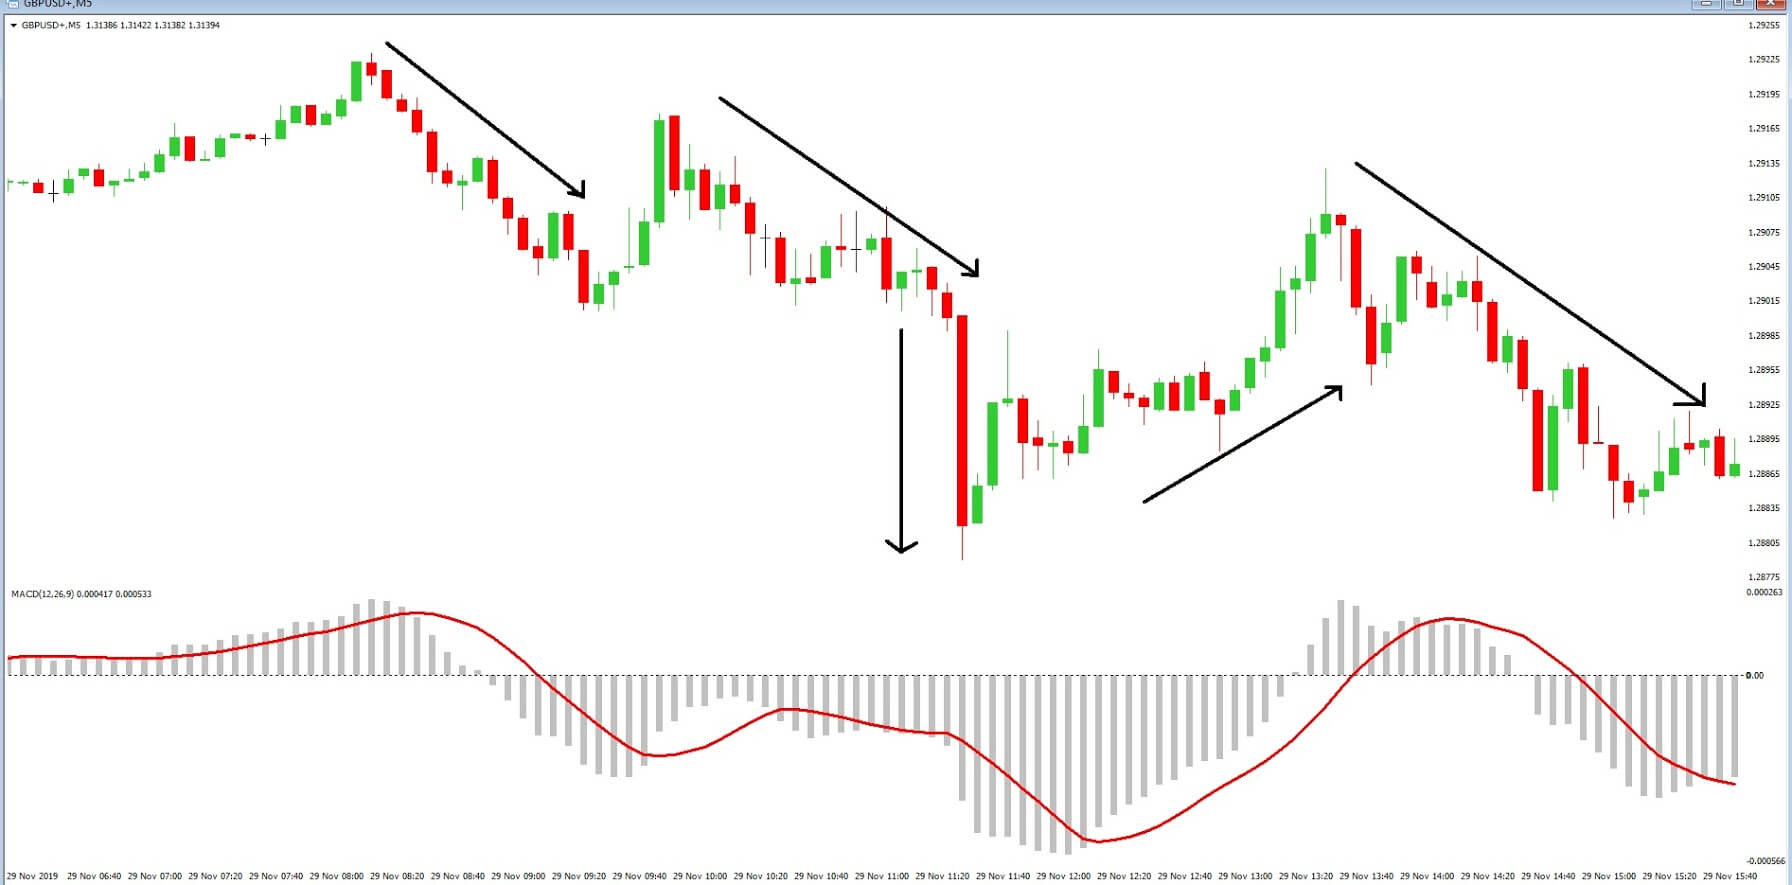
Example ‘A’ is an example of a lagging indicator; the Moving Average Convergence Divergence or MACD takes the average move of historical price action over a set period of time and plots the information onto a chart. In this chart of the GBPUSD pair with the 5-minute time frame, we can see that the price action of the pair is very similarly reflected in the MACD with its moving average, which both fluctuate around its 0 axes. Traders use the imagery to back up their theory of future price action.
Example B
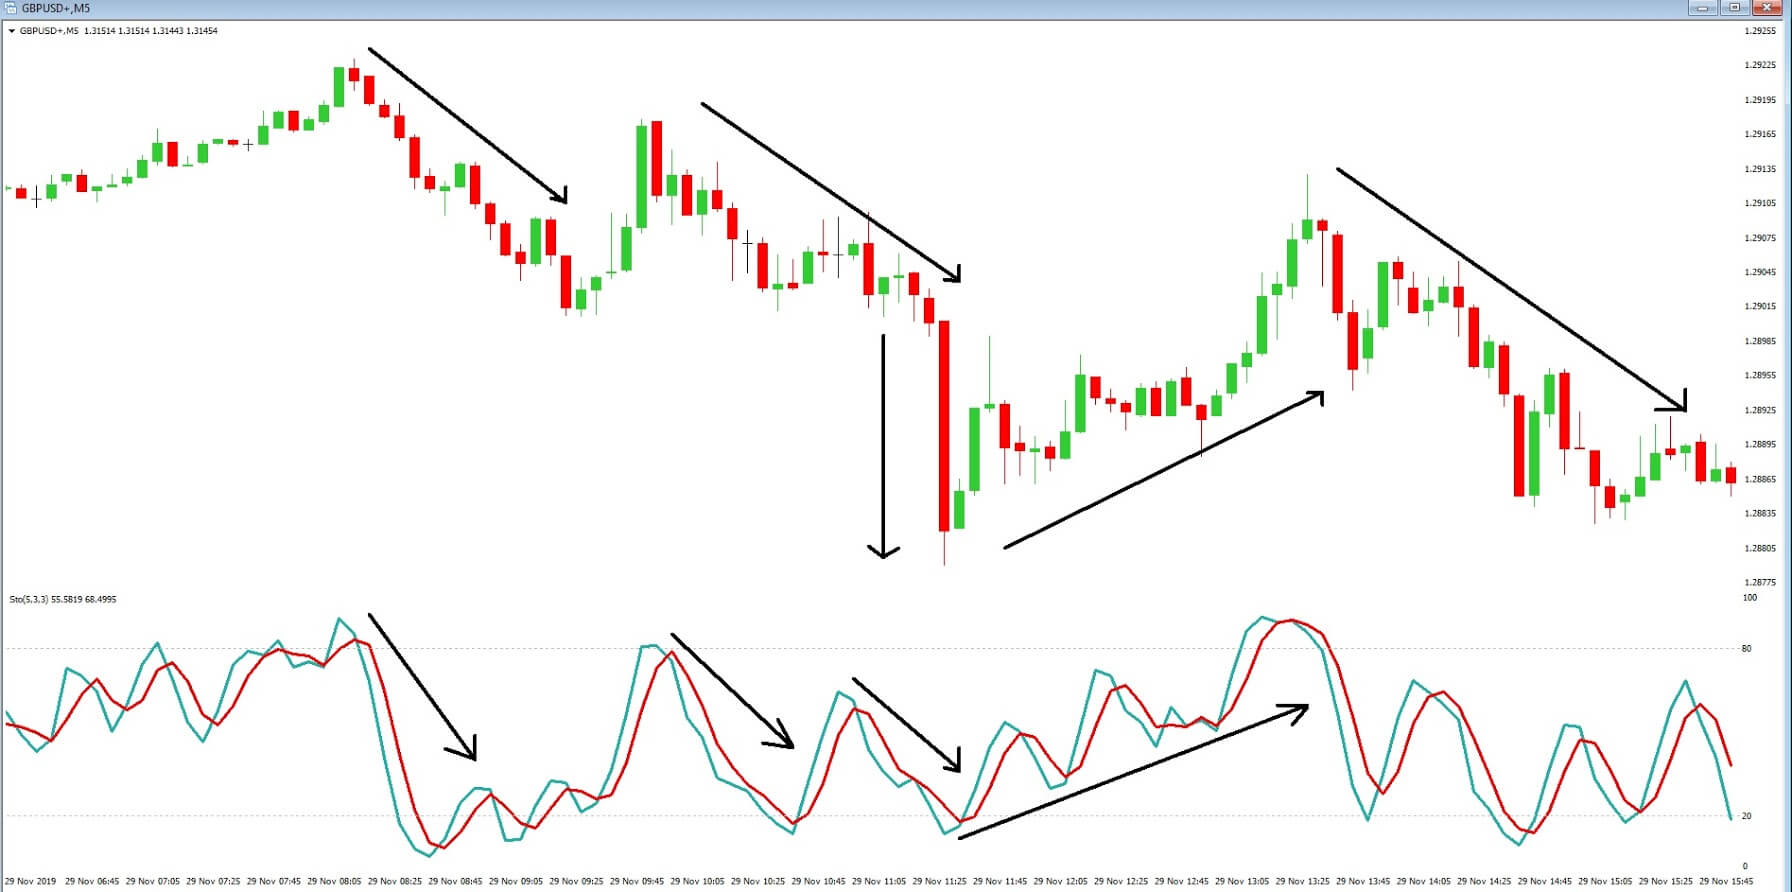
Example ‘B,’ on the same pair and time frame, is of another lagging indicator, the Stochastic oscillator, which plots historical price action data and tells a trader when a pair is entering into overbought territory such as above the 80-line and when a pair maybe oversold such as below the 20-line. Again, traders use the data to help predict future reversals in price.
Example C
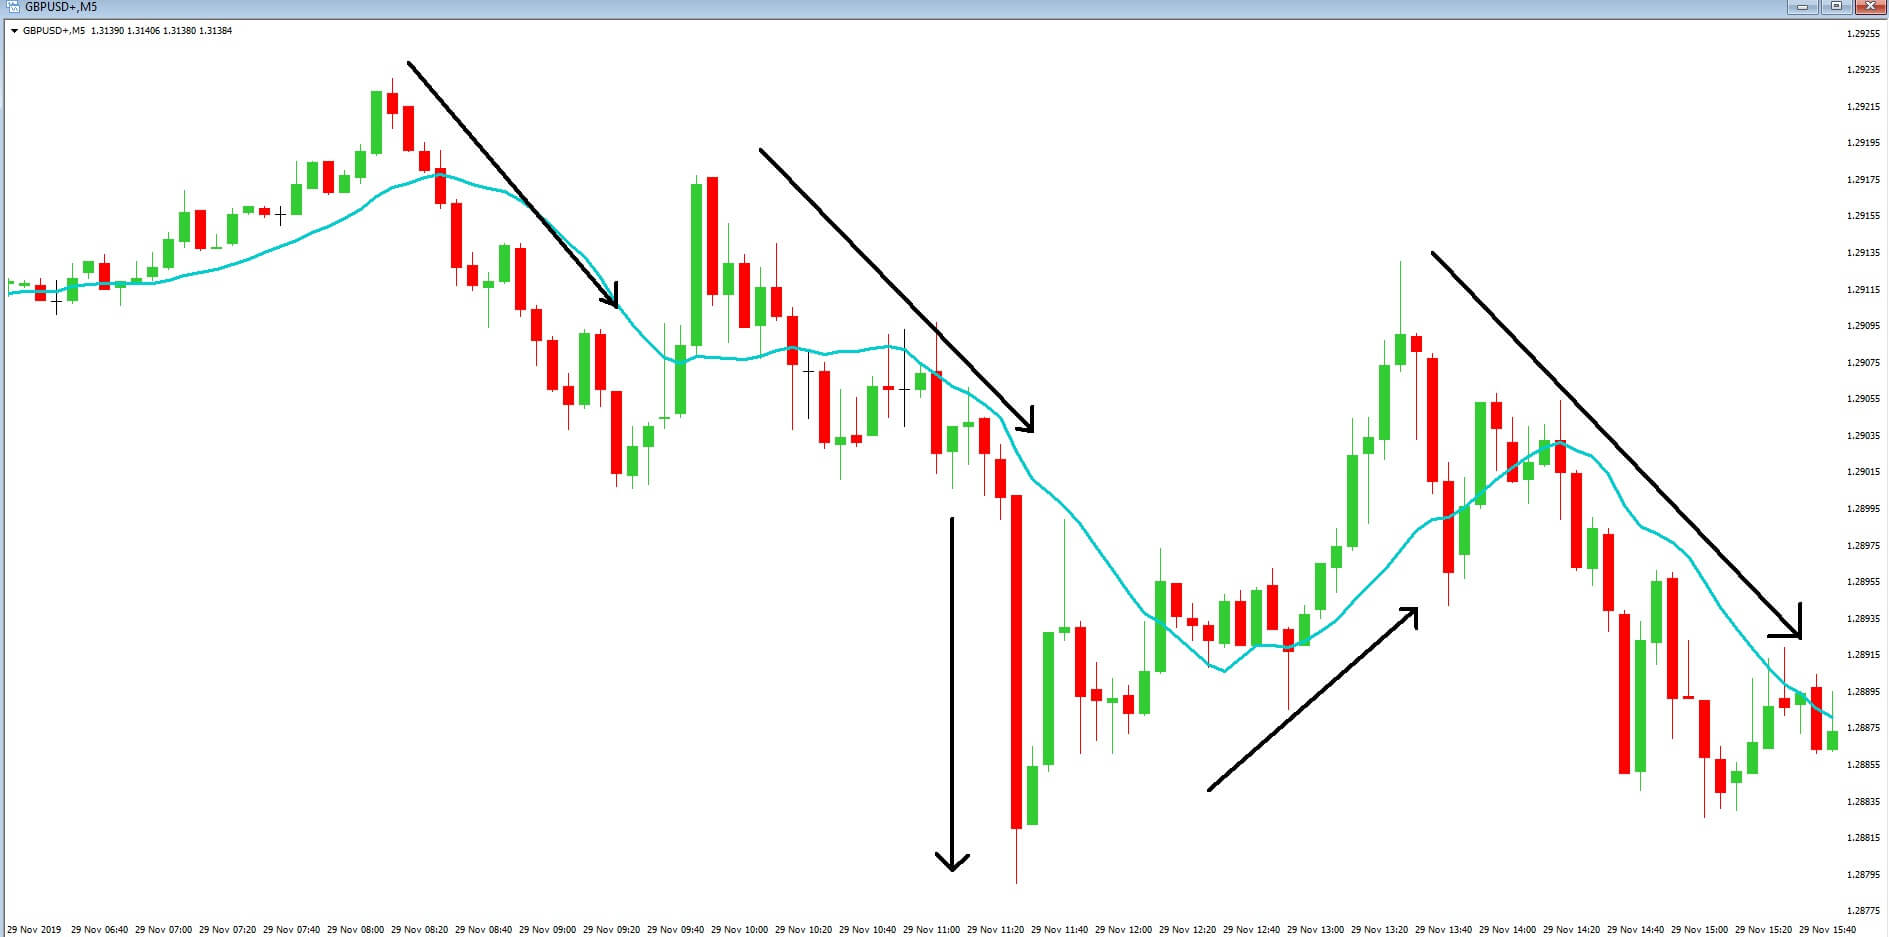
Example C, again on the same GBPUSD, a chart, is a simple moving average lagging indicator, which plots the average move of the previous price action, where, in this case, a continuous line is formed onto the chart of the average of the previous 14 candlesticks. As we can see, when price action falls underneath the moving average, it tends to trend lower, and it is also easy to identify on this chart that when price action moves above the moving average, a tren higher follows.
Example D
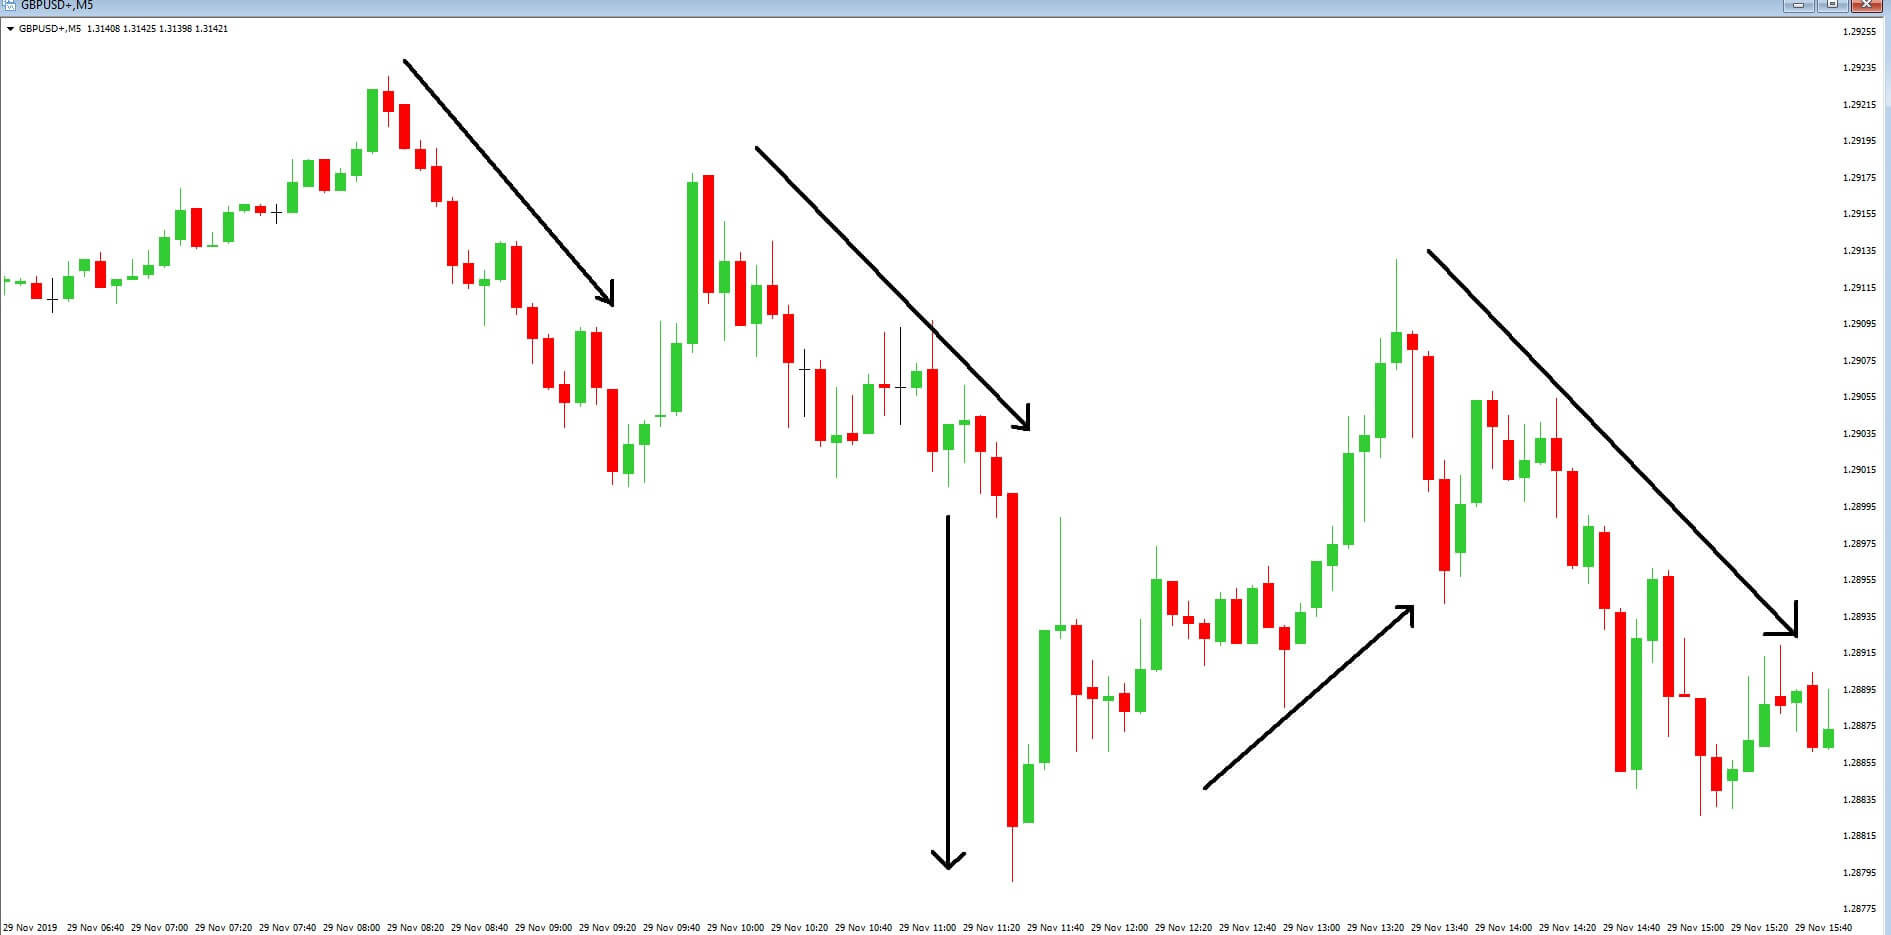
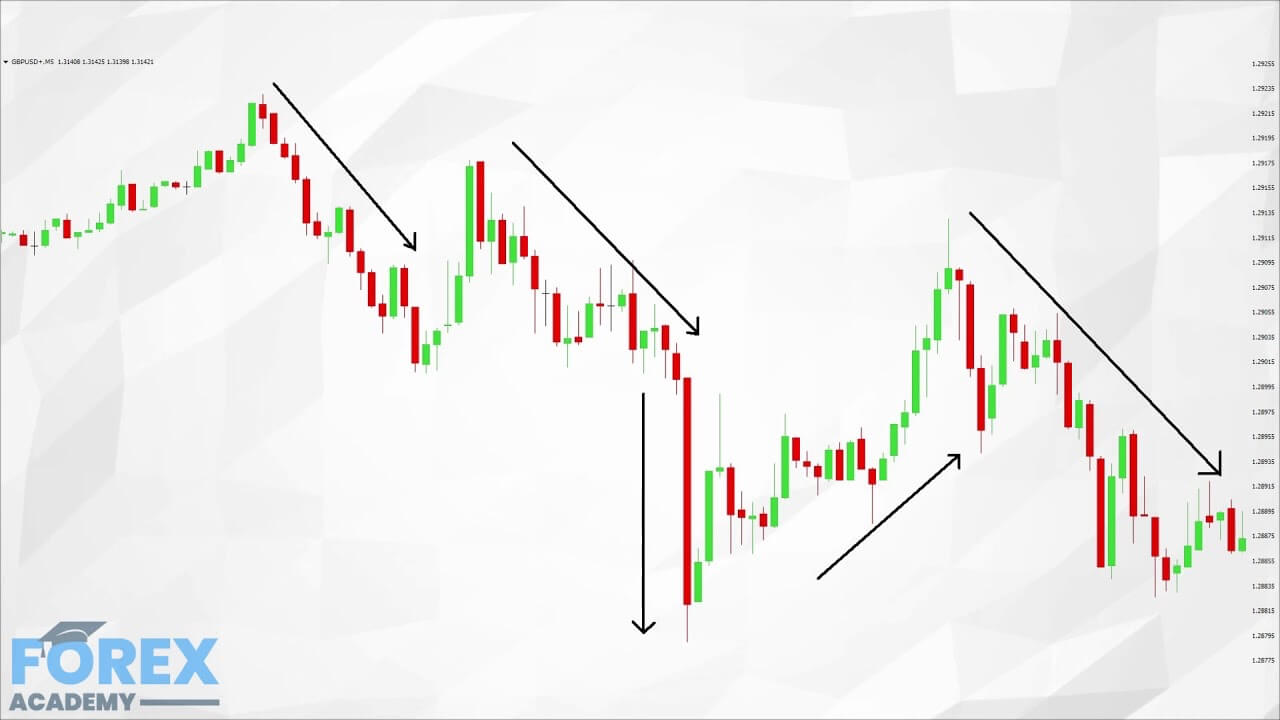
Example D is price action itself on the same chart as defined by our Japanese candlesticks, and where the price action itself is a leading indicator. Leading indicators are the most widely used by professional traders to help anticipate future price movements and help to define entry and exit points with much greater accuracy the lagging indicators. When traders use price action in the form of candlesticks, they study the size shape and patterns of the candlesticks to predict future movements.
Example E
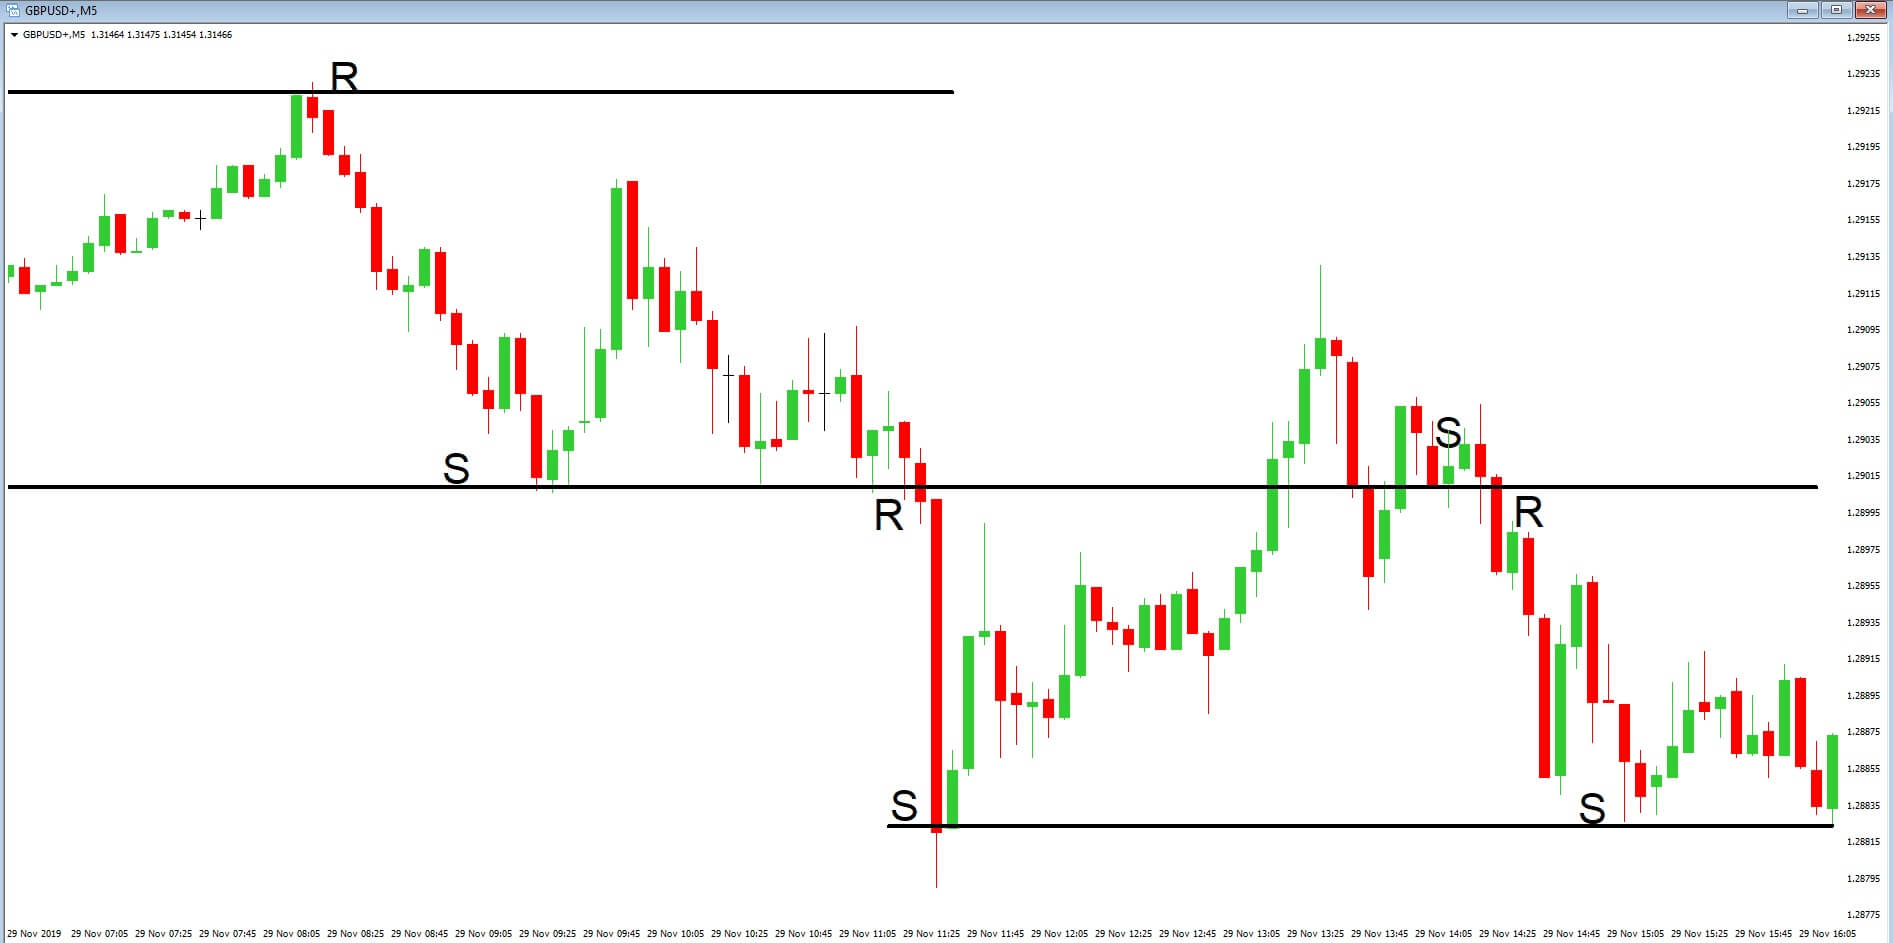
Example E, on the same chart, is another leading indicator. These are support and resistance lines, Which Traders will draw onto the grass themselves at ware price action tends to find support which it is likely to move up from and resistance where the price is likely to fall from, in order to decipher future price action. As you will see from our screen-shot, these lines will often alternate between being levels of support and levels of resistance due to price action retracement.
Example F
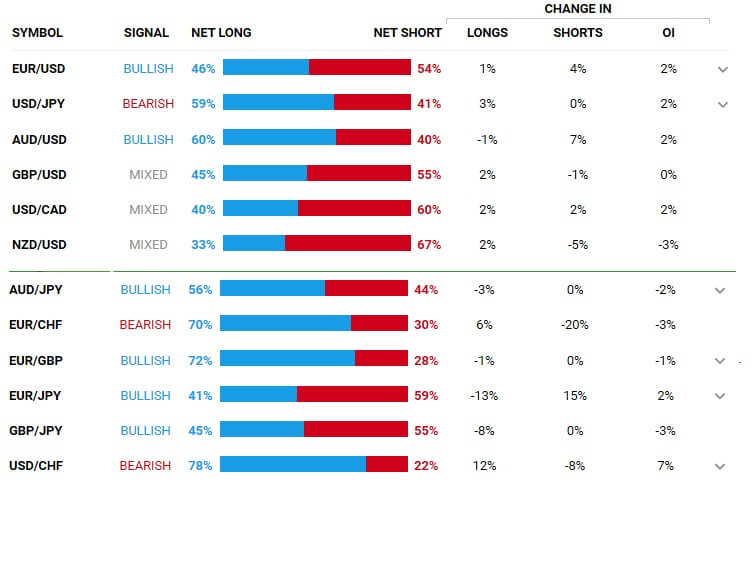
Example F is another leading indicator. This is a screenshot from a forex broker’s clients’ positions table, which shows the net positions of how their traders are positioned on various currency pairs. Many brokers now offer this superb facility which will give traders added comfort when it comes to taking on trades, or act as a warning if the majority of traders on the position table are trading in the opposite direction.