

Forex Tips For Beginners – Stacking The Odds In Your Favour!
Thank you for joining this Forex academy educational video.
In this session, we will be looking at how to tilt the odds in your favour by showing you some cool tips to keep you out of trouble and tilt the odds in your favour of making successful trades.
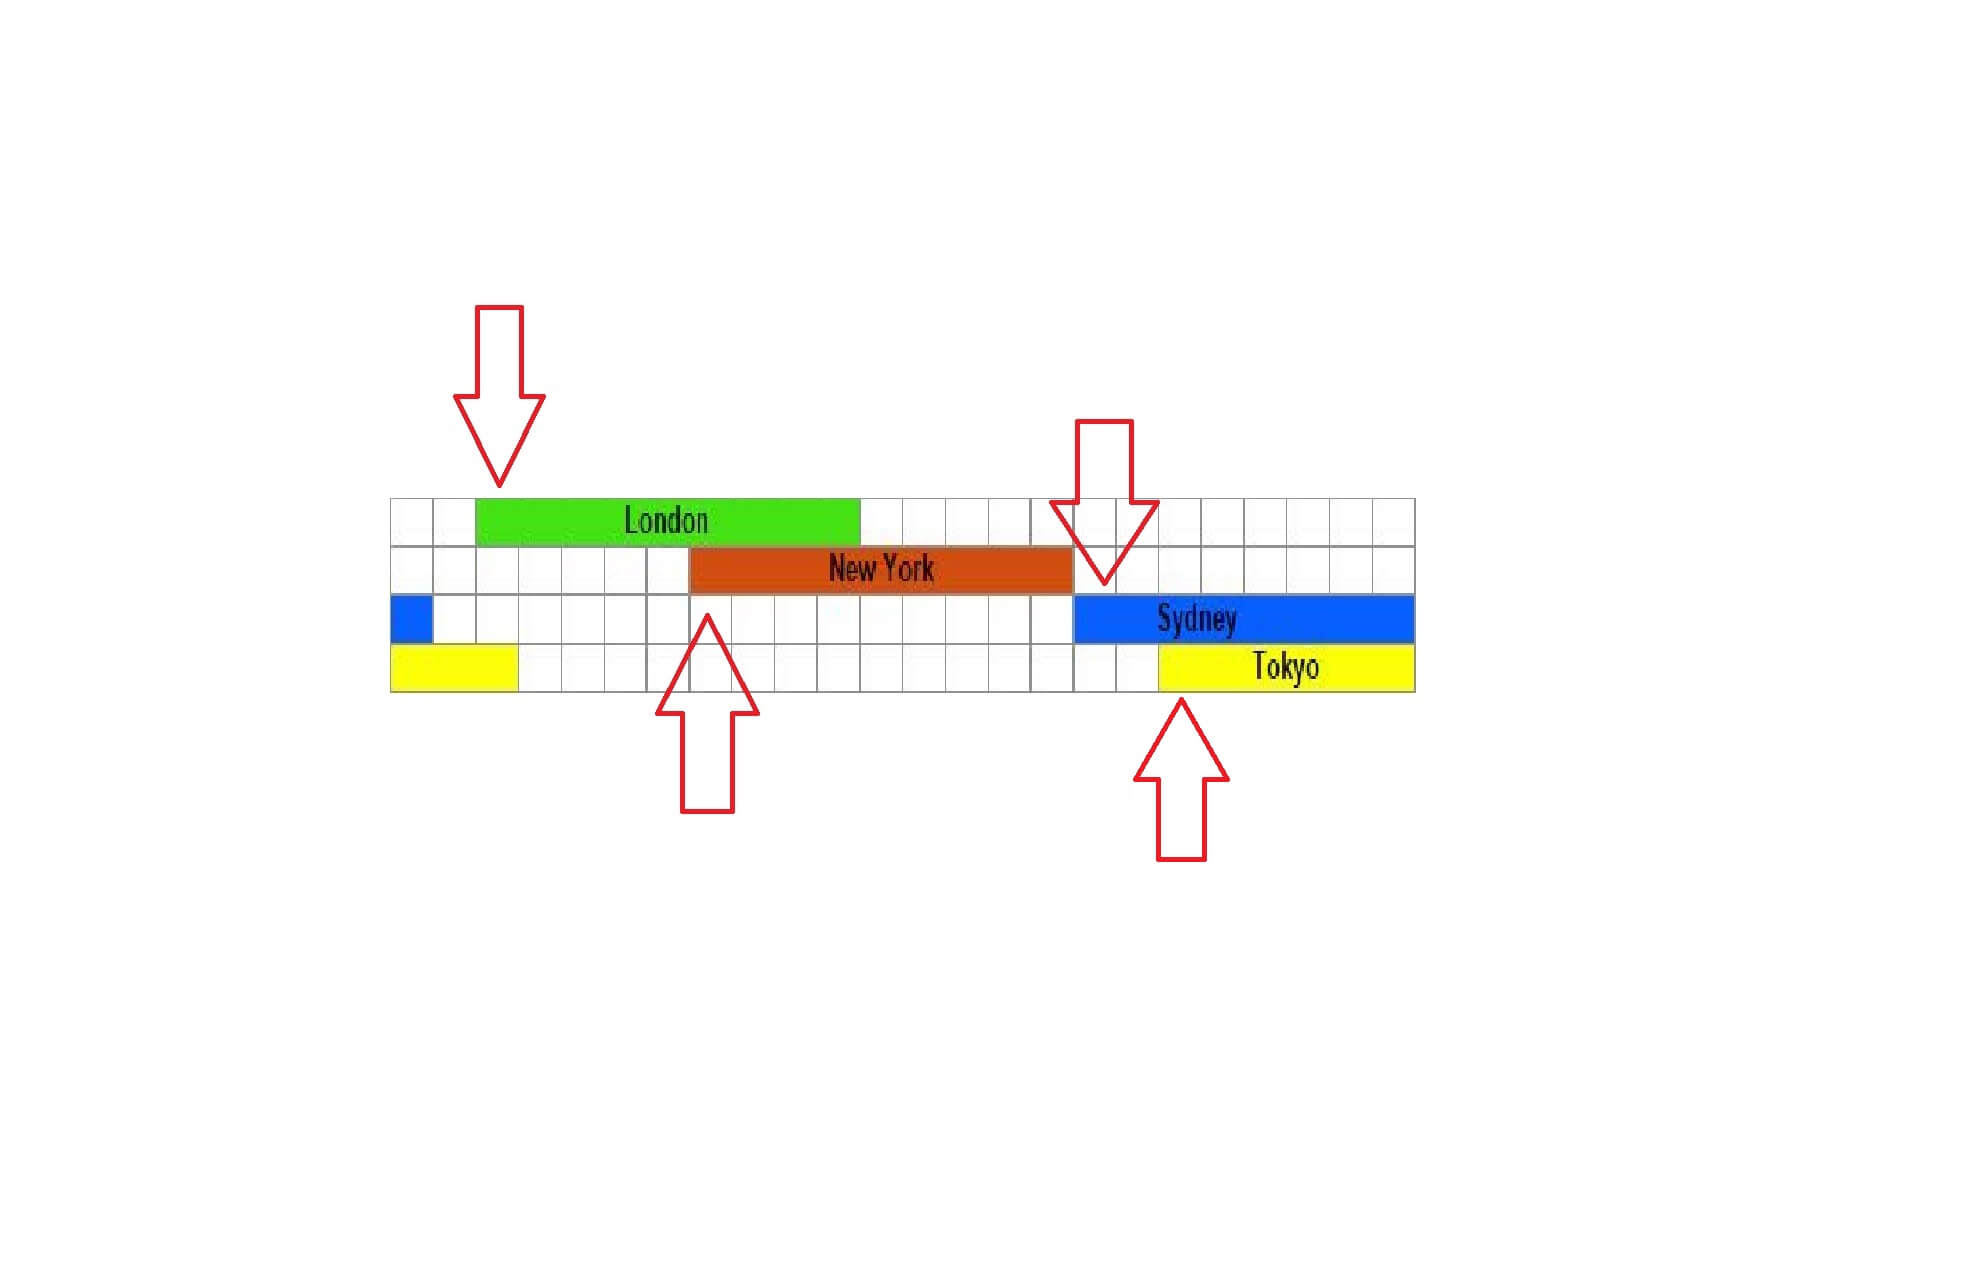
The forex market runs 24-hours a day, 5 days a week, but typically, the busiest times, where you might expect a spike in volatility and larger price movements, is during the first hour of the beginning of a particular regional session. So, for example, at around 7:30-8:30 AM GMT, the European and UK session starts, and the FX market will usually become more active as more cash volume flows into the market. The same applies to the US session and then the Asia session as led by Sydney and followed by Japan.
Often trends will finish in one region and turn in the direction as the new region opens. This is down to differences of opinion, economic data releases, sentiment, and profit-taking as one region retires for the night. Wait until such times as the new trading session is well underway and until you can identify a potential trend.
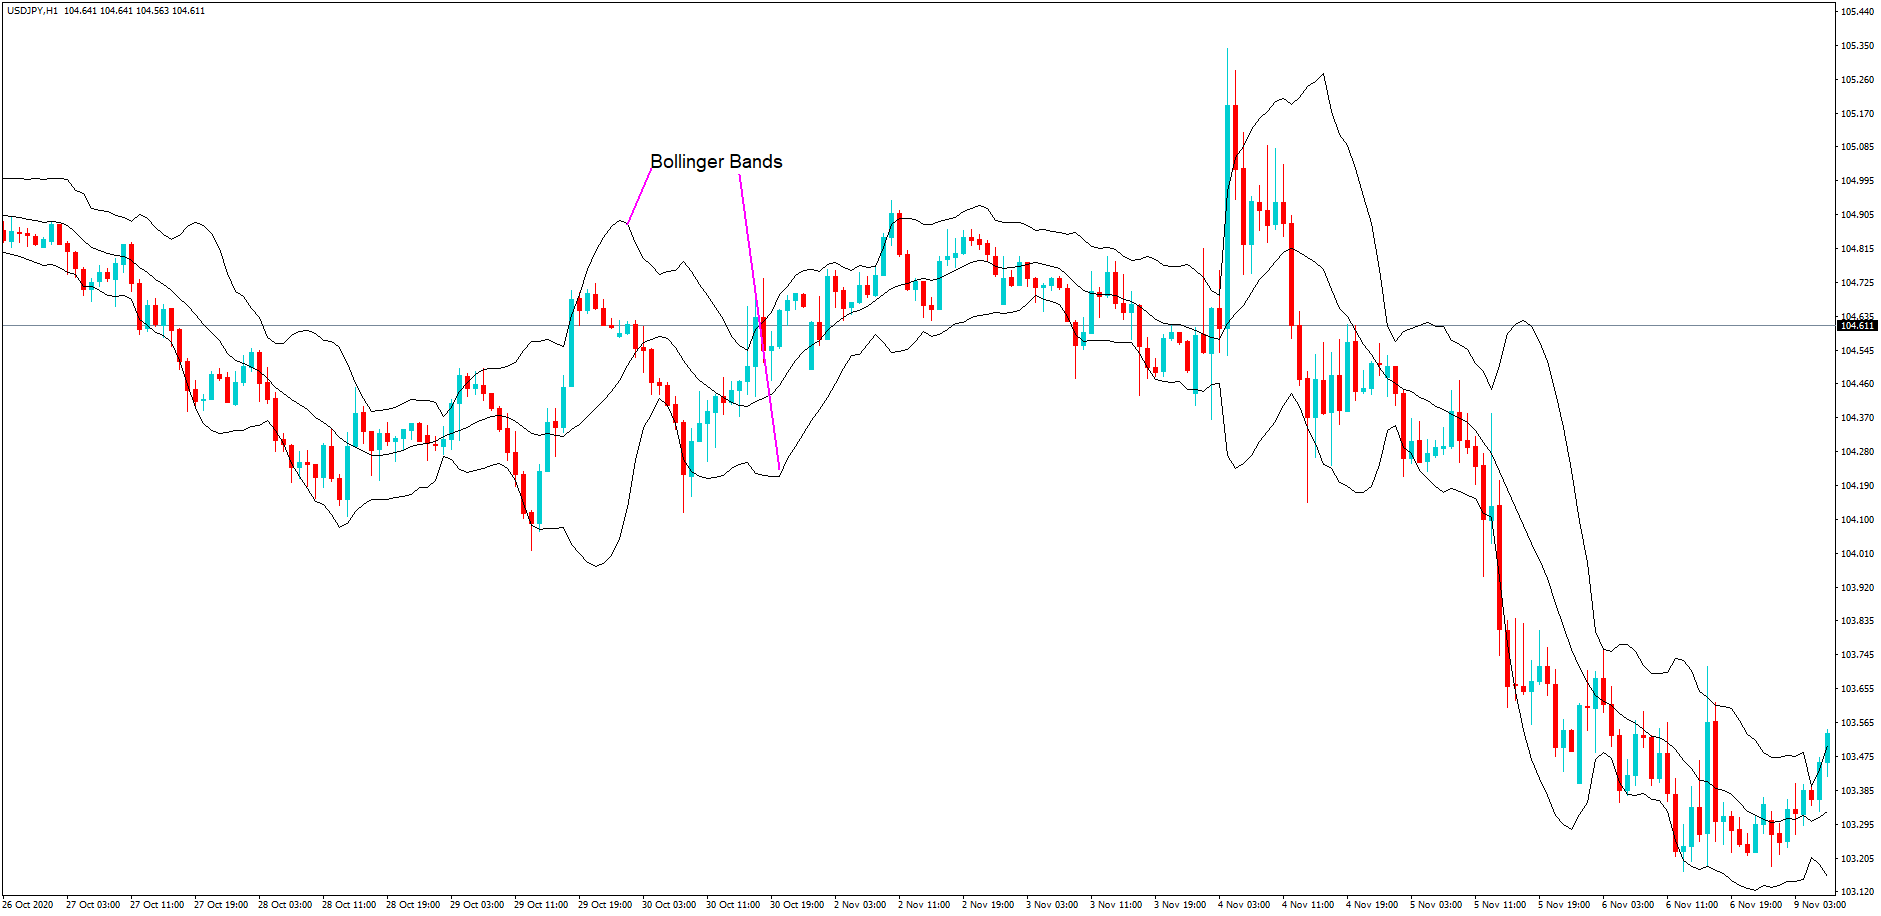
Become a master of Bollinger bands. This technical analysis tool was invented by John Bollinger in the 1980s.
It is a chart tool that calculates two standard deviations on either side of the exchange rate, but it’s used in many different asset classes such as stocks and shares because of its success and the fact that it is highly regarded by the trading community.
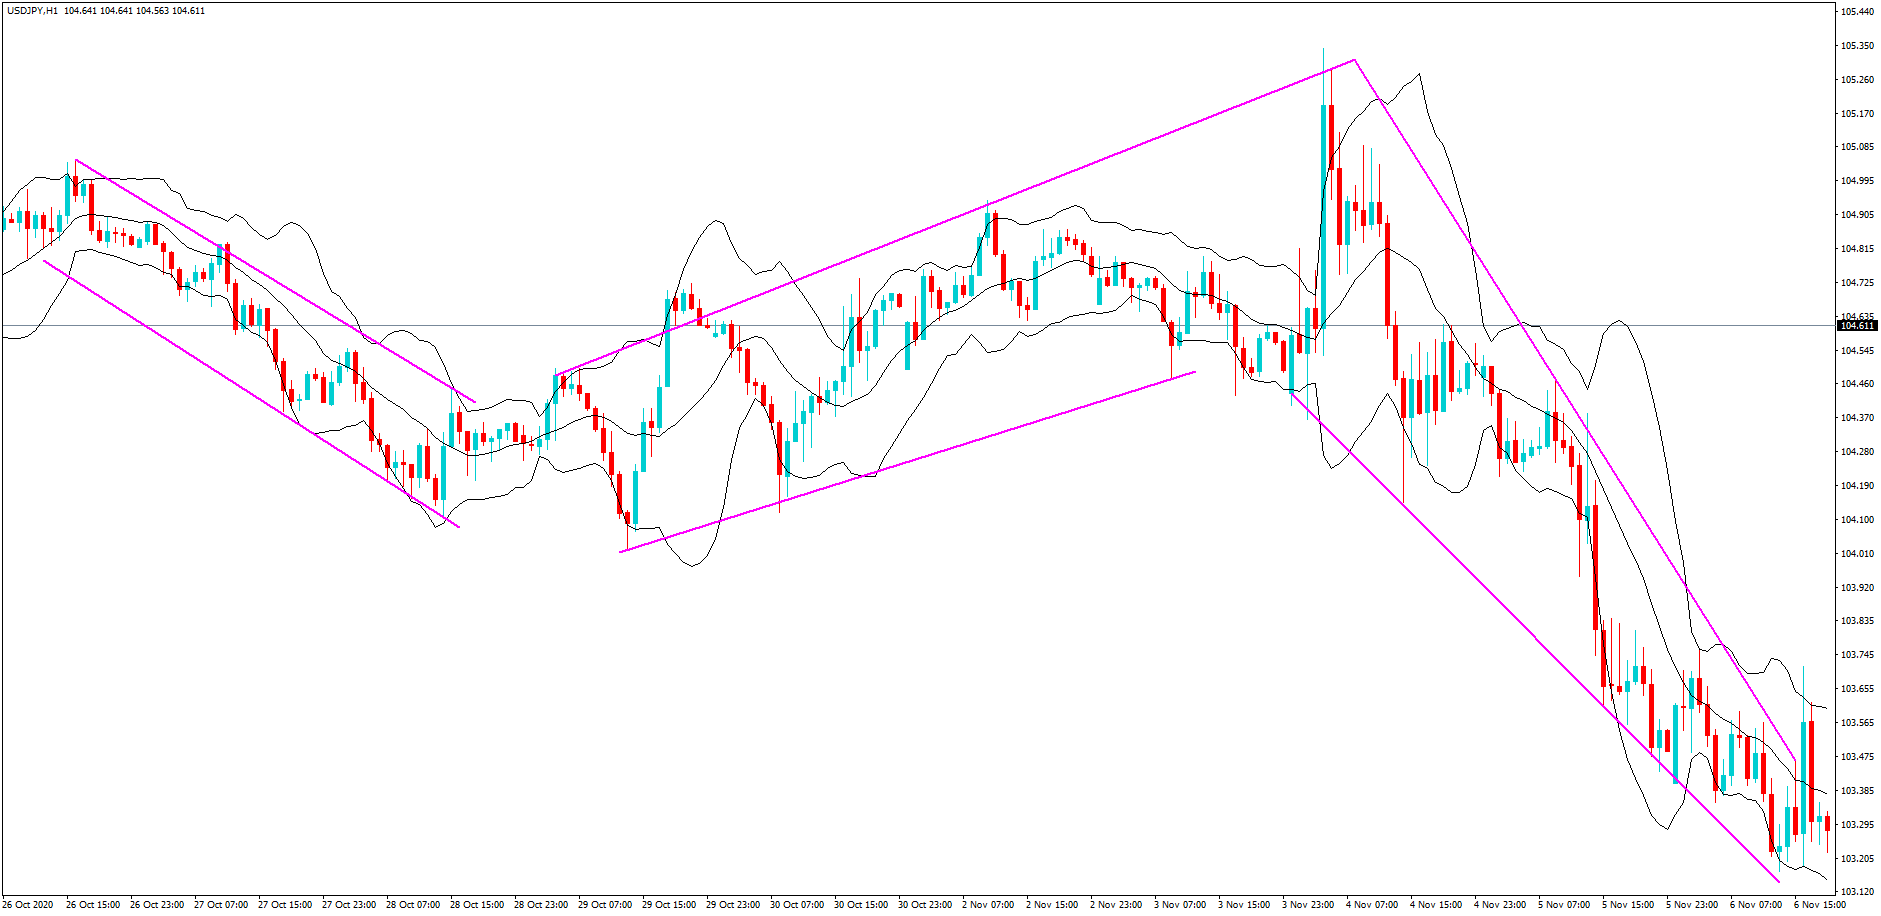
One of the key components that traders look for when trading Bollinger bands is that 95% of trading activity will remain within the bands. And shown here on this one hour chart of the USDJPY pair where we have highlighted a few examples of what has happened when the price has a move outside of the bands, traders push the pair back inside, and this often results in a price action reversal.
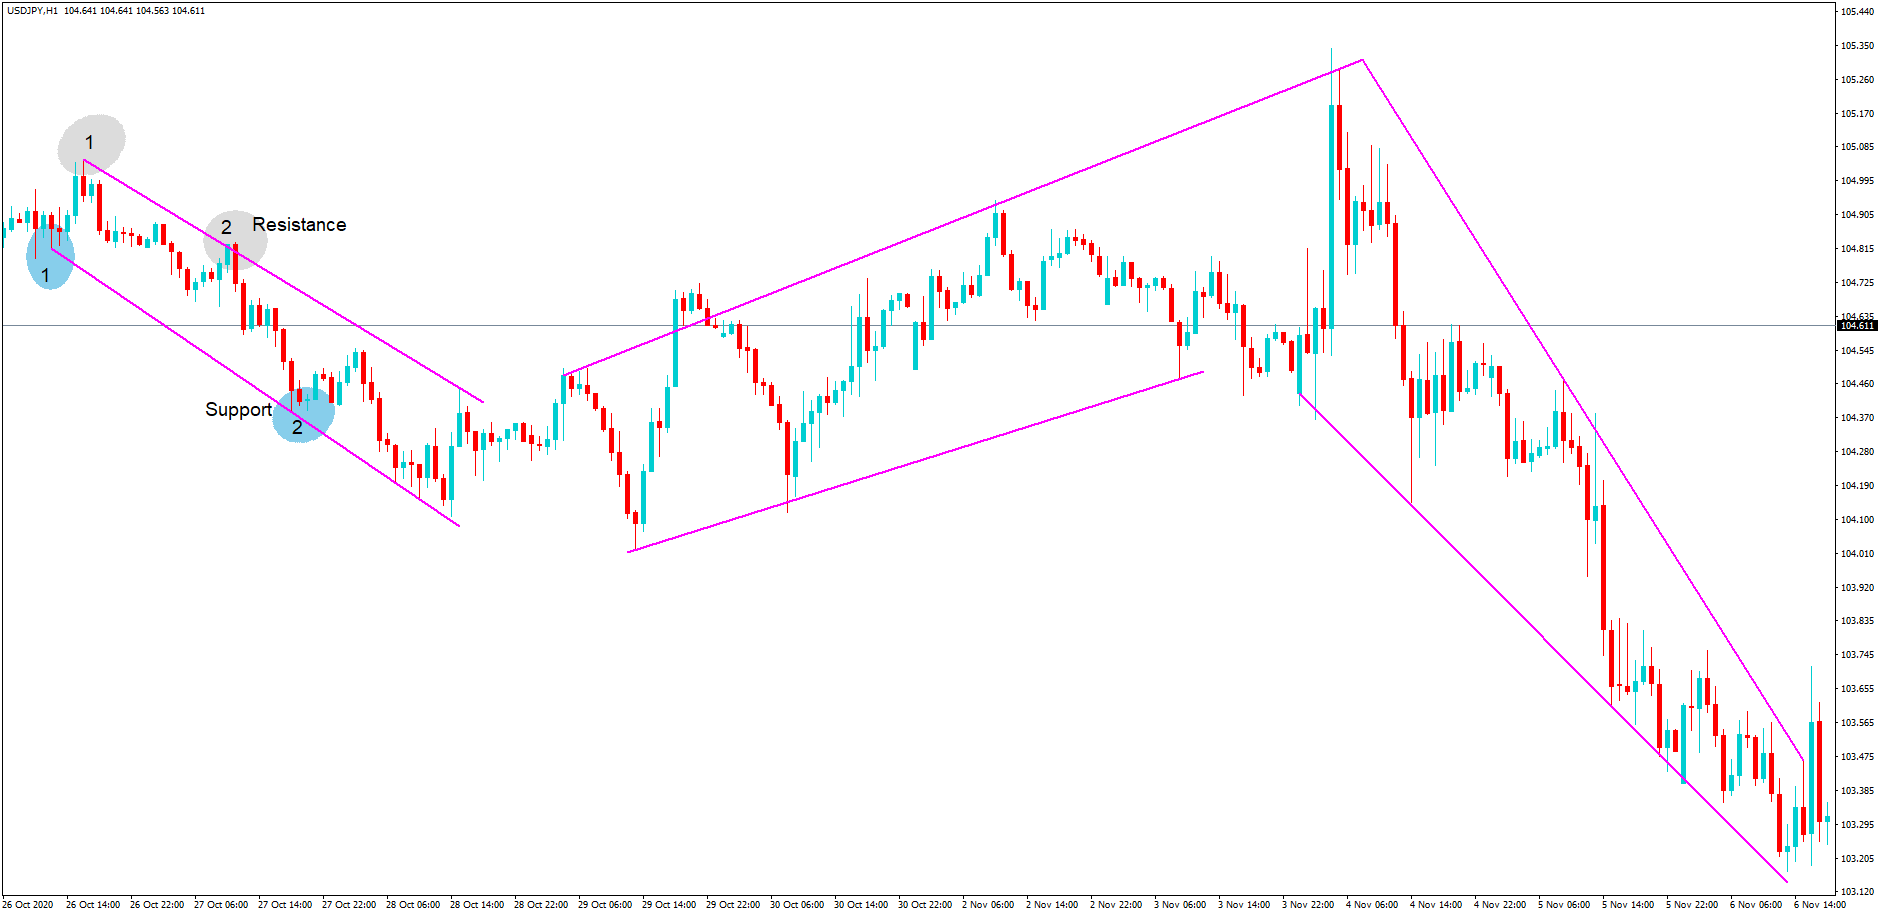
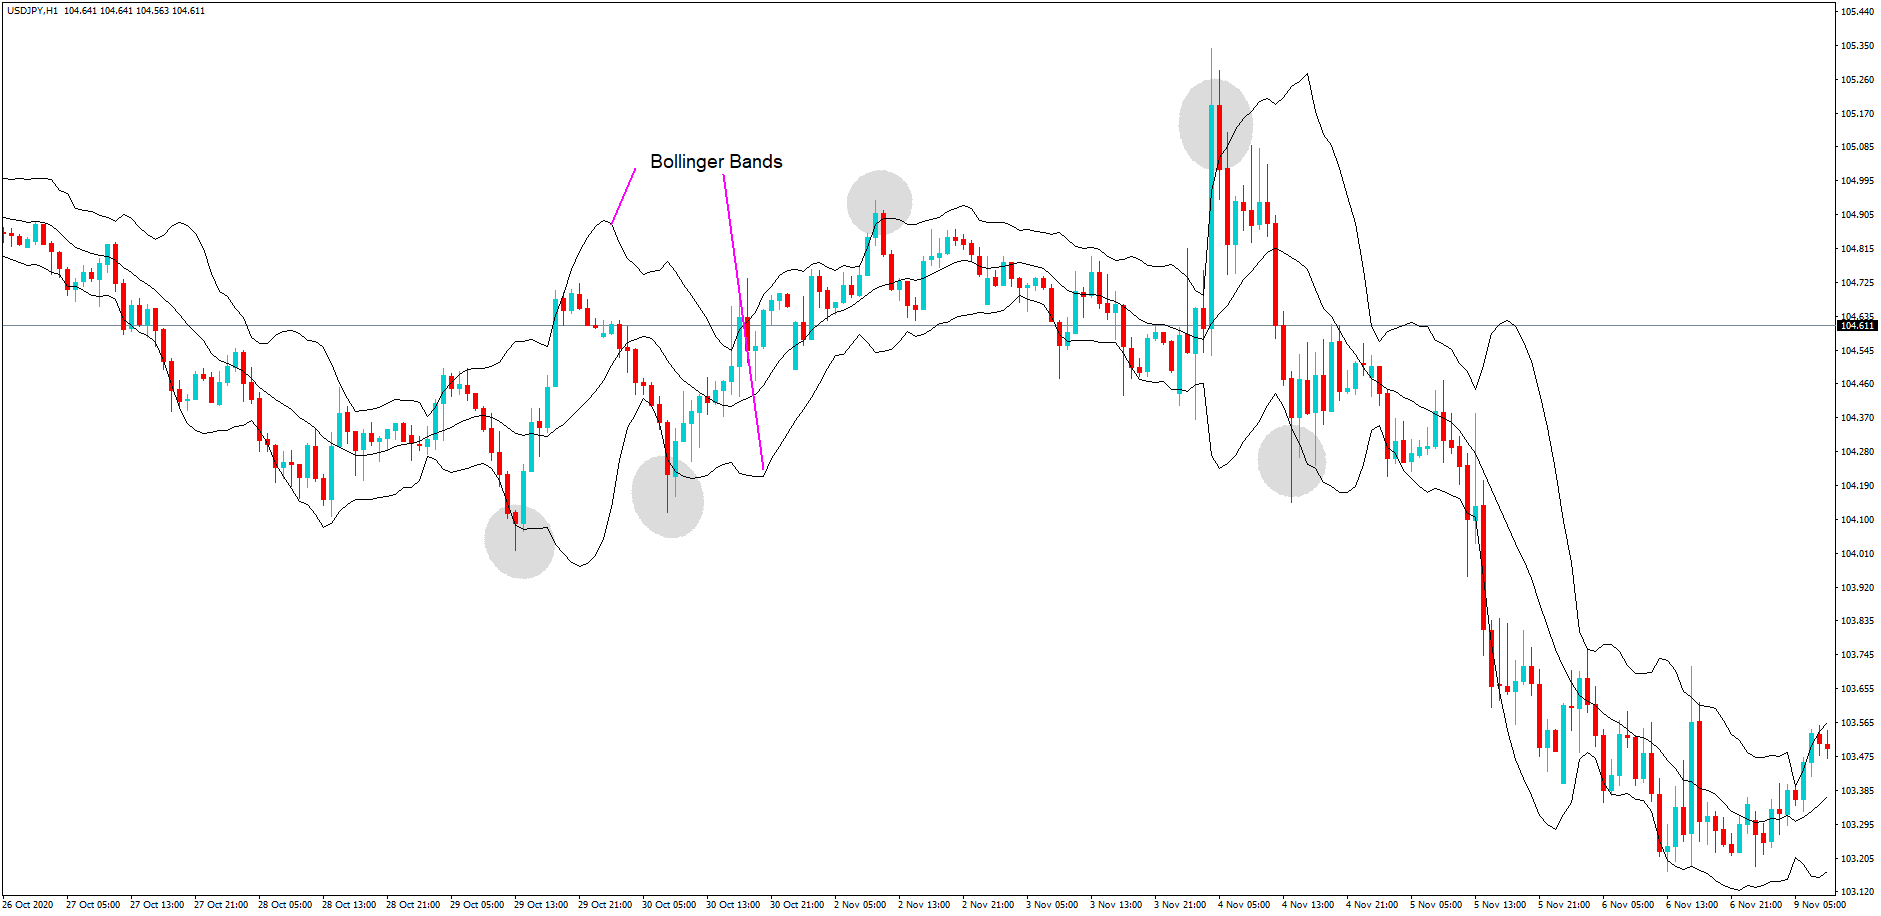
Another major tool traders use are trendlines. A trendline is typically manually drawn onto a chart to identify price action direction. Again, using the 1-hour chart of the USDJPY pair, we have drawn in some trendlines.
An area of support and resistance, which forms the basis of a trend, is officially recognised when price action has reverted to either the support or resistance trendline on a minimum of two occasions. Here on the left side of the chart, this is clearly the case.
Three distinct trends become apparent using this technical analysis feature.
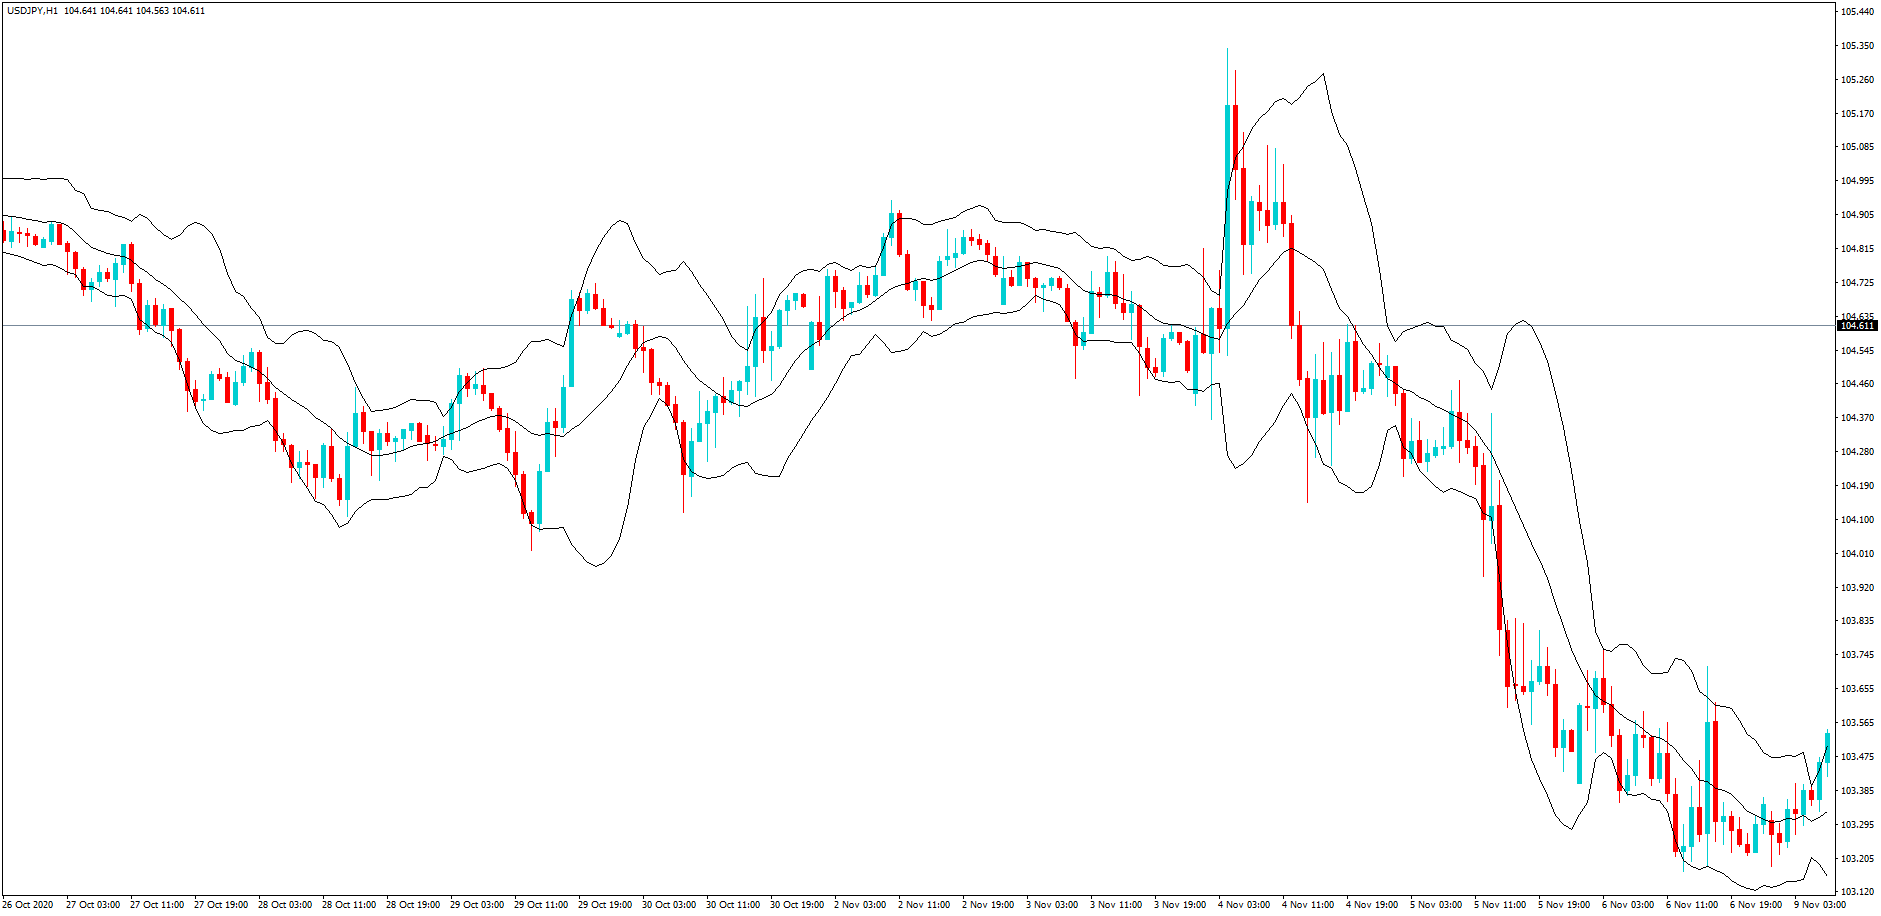
In this diagram, we have overlaid the Bollinger bands with our trendlines. Again, this is the same USDJPY pair and 1-hour time frame.
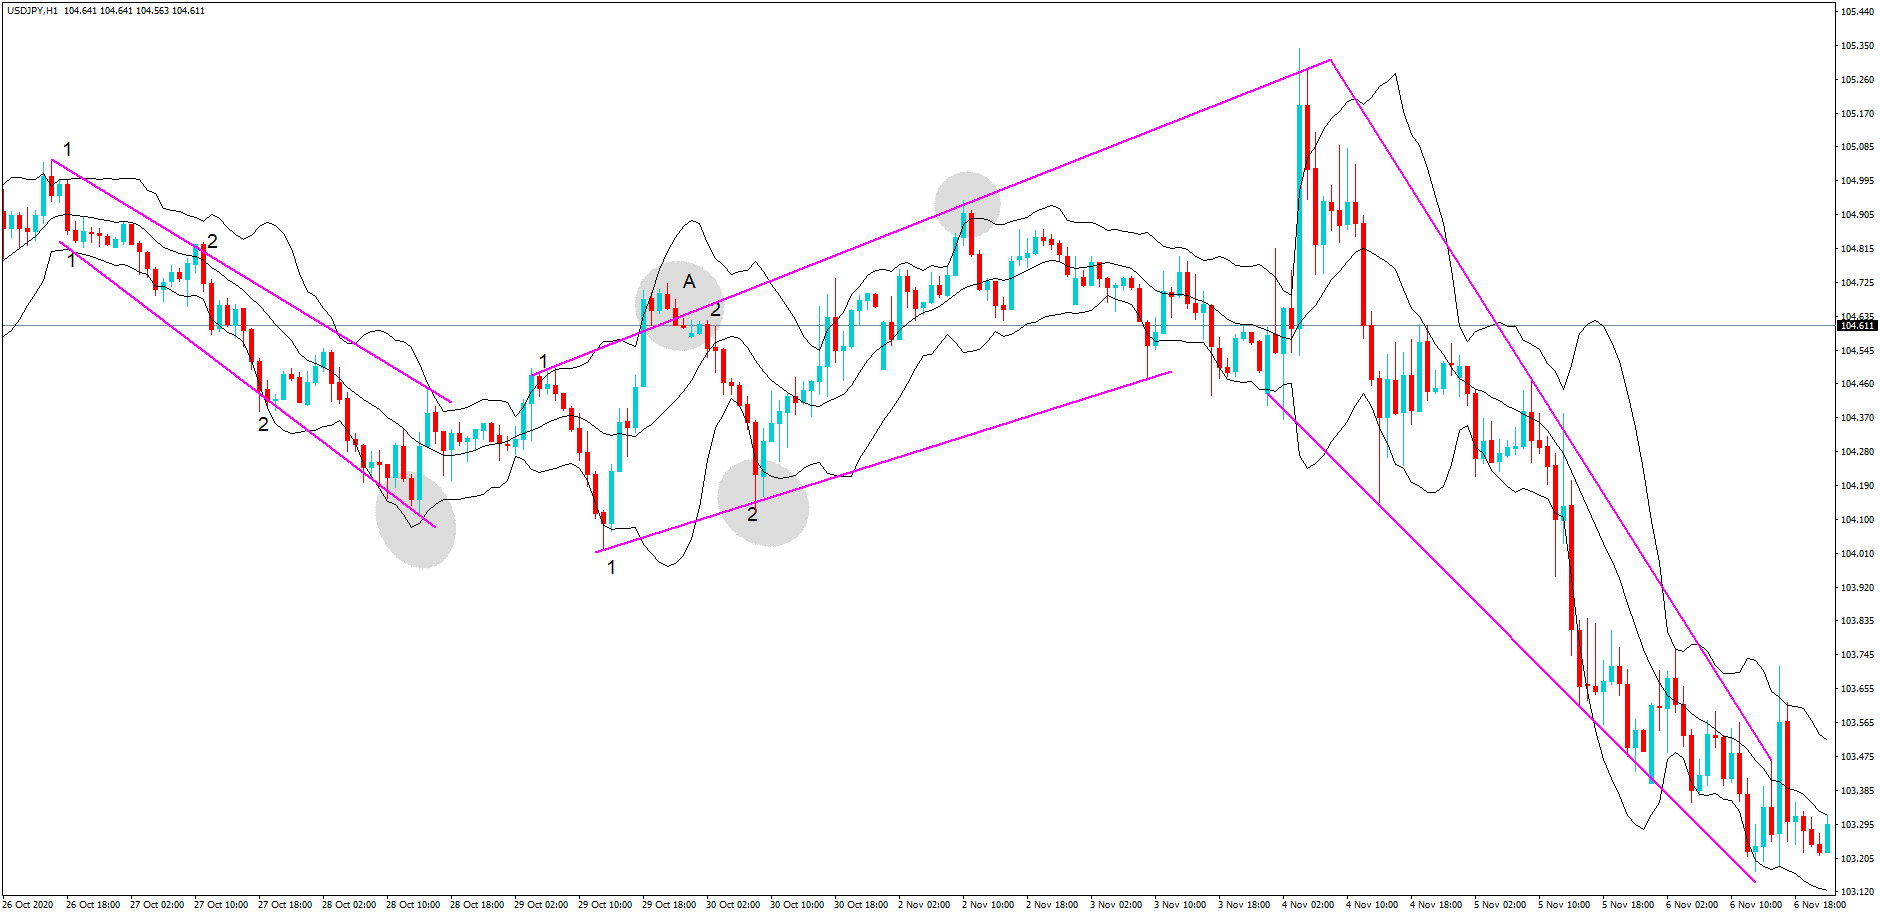
Now we can wait until a trend has been confirmed, where price action has hit either the support or resistance line on two occasions, and then we can also wait for the price action to breach the Bollinger band to increase our odds of the price action being driven back into the bands.
At position A, we have a confirmed downtrend, but where price action does not breach the Bollinger, yet it still moves higher.
At position B, we have a change in trend direction as confirmed here on the chart, but where the resistance line breach and also the breach of the Bollinger band cannot be considered as a confirmation of a reversal until such time as price action has fallen underneath the resistance line, which it clearly does. This is the time to short the pair. And, at the bottom of this move, we have a breach of the Bollinger band and where price action finds support before moving higher, which is the time to cut the short position and buy the pair.
In conclusion, use the trendlines and Bollinger bands together in this fashion to increase your odds of a successful winning trade.