Introduction
On financial markets, the price moves basically in three types of trends identified as bullish, bearish, and sideways. Both trend lines as channels allow the “trend following” investor to recognize if the market’s direction changed or if the price action accelerated.

In this educational article, we’ll review how trend lines and channels can help establish a trading strategy.
Trend Lines and Trend Channels
In a price chart, the trend can be described as a price variation across time in a specific and identifiable direction. A trend is said to be bullish when the price creates a succession of higher peaks and higher valleys. On the contrary, in a bear trend, the price action tends to create a sequence of lower peaks and lower valleys. If the market runs in a consolidation stage, developing an overlapped structure, the price moves in a sideways or lateral trend.
When the price action develops an uptrend, the chart analyst projects the trend line connecting the lower highs sequence. In a bearish trend, it is customary that the projection links the lower highs sequence. The following figure illustrates how to trace a trend line.
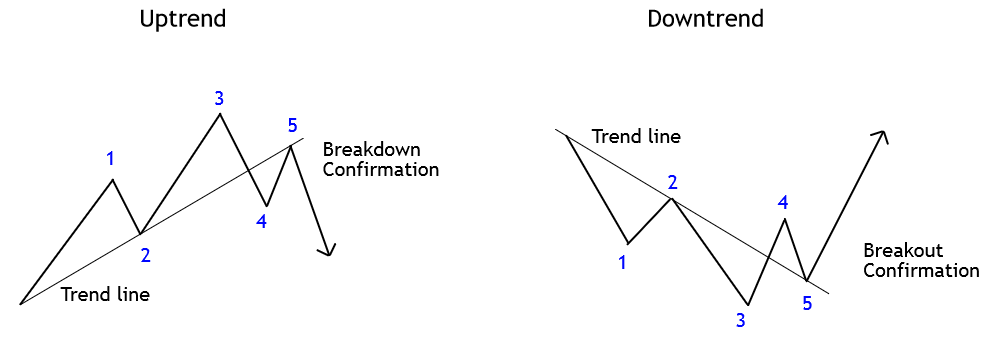
In the above figure, the 1-2-3 sequence represents the movement developed by the price action in an uptrend (left) and downtrend (right). When price breaks below (or above) of the trend line, as shown in (4), the price action reveals the potential change in the primary trend. The confirmation of this change comes determined by the retracement that experiences the price, which here tests the trend line and continues in the new trend’s direction, making a higher high.
Trend channels could be considered as a dynamic price range that follows the rhythm of a trend; this technical formation could be bullish or bearish. To draw a trend channel, it’s necessary three points, in an uptrend, two lows and one peak. The channel baseline is the trend line that connects the origin of the movement with the second low. The upper line will be the projection of the baseline traced from the peak between two lows as exposes the following figure.
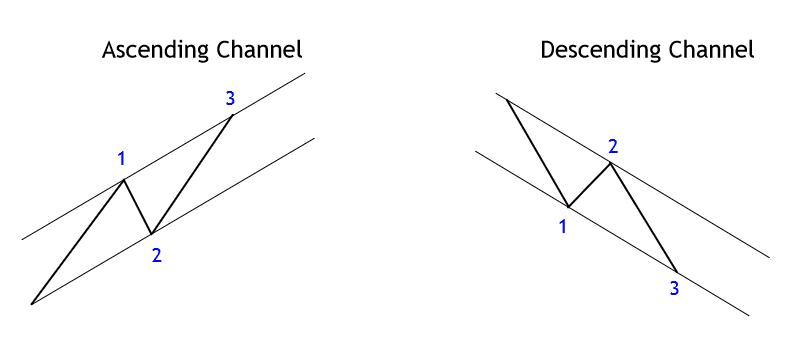
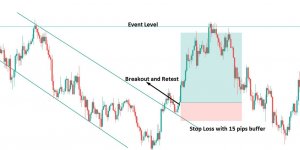
In an uptrend, the breakout after the second low completion (see figure 01) provides a confirmation signal of the bullish trend continuation. This entry setup for the third movement has its potential target located at the upper line of the channel, acting as a dynamic resistance.
Phi-Channels
Phi-channels is a different type of channel and varies from the trend channel. The main difference with trend channels is that on Phi-channels, the guideline connects the extremes from the origin of the movement with the top of the move identified as 3. Then, parallel lines are projected, creating the channel, using point 2 to trace the channel’s parallel line, as shown in the next figure.
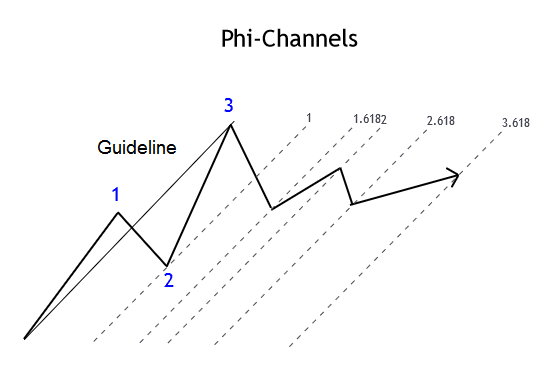
The resulting projection provides potential turning points, which could offer entry setups combined with other technical tools.
Conclusions
In this educational article, we have seen the use of trend lines and channels that can help establish a trading strategy based on tracking the trend.
In general, the use of trend lines and channels is aimed at seeking to take advantage of the continuity of the trend over the turn of the market’s direction. In this sense, it is convenient to recall the Dow Theory principle, which states that a trend will remain in effect until there is confirmation of its change.
In this context, the use of Phi-channels provides potential areas where the price could react to continue the course of the primary trend, although its use should be supported with other analysis tools.
In the next article, we will look at how to apply the analysis tools to create trading signals.
Suggested Readings
- Fischer, R., Fischer J.; Candlesticks, Fibonacci, and Chart Patterns Trading Tools; John Wiley & Sons; 1st Edition (2003).