Secret Techniques for Profitable Forex Trading I
Profitable Forex trading is an elusive goal for many traders. According to most statistics, over 75 percent of traders lose money. This comes for several reasons. There are well-known causes of this unfortunate outcome. Most traders get blown out because they bet too much and lose all when the market turns against them. Another source of failure is their psychological bias to let losses grow and cut their profits short. But today, we will focus on one key factor: How to assess entries and exits properly.
The States of a Market
Many people classify market action into over six states: Bul, Bear, Sideways with high or low volatility. Although this is usually correct, it does not offer enough simplicity to make decisions. The best way to look at market action is similar to what the Elliott Wave Theory states: Elliott stated that the market had impulsive phases and corrections of this primary impulse. We don’t need to be a genius to see that it is logical. Waves need to swing for it to form. But impulses and corrections have different properties. What works on one, it does not work on the other. Thus, the secret to master the trade is to
Assess which state the market is on
Apply the proper tools for entries and exits.
Impulse Properties
Impulses are characterized by directional movement. Bull or bear, we can see a steady price movement toward a new equilibrium, as impulses are created by an imbalance between supply and demand. The volatility on impulses is directional, and the tools to apply are moving averages and superior form of them such as instant trend, MAMA, MESA, and similars.
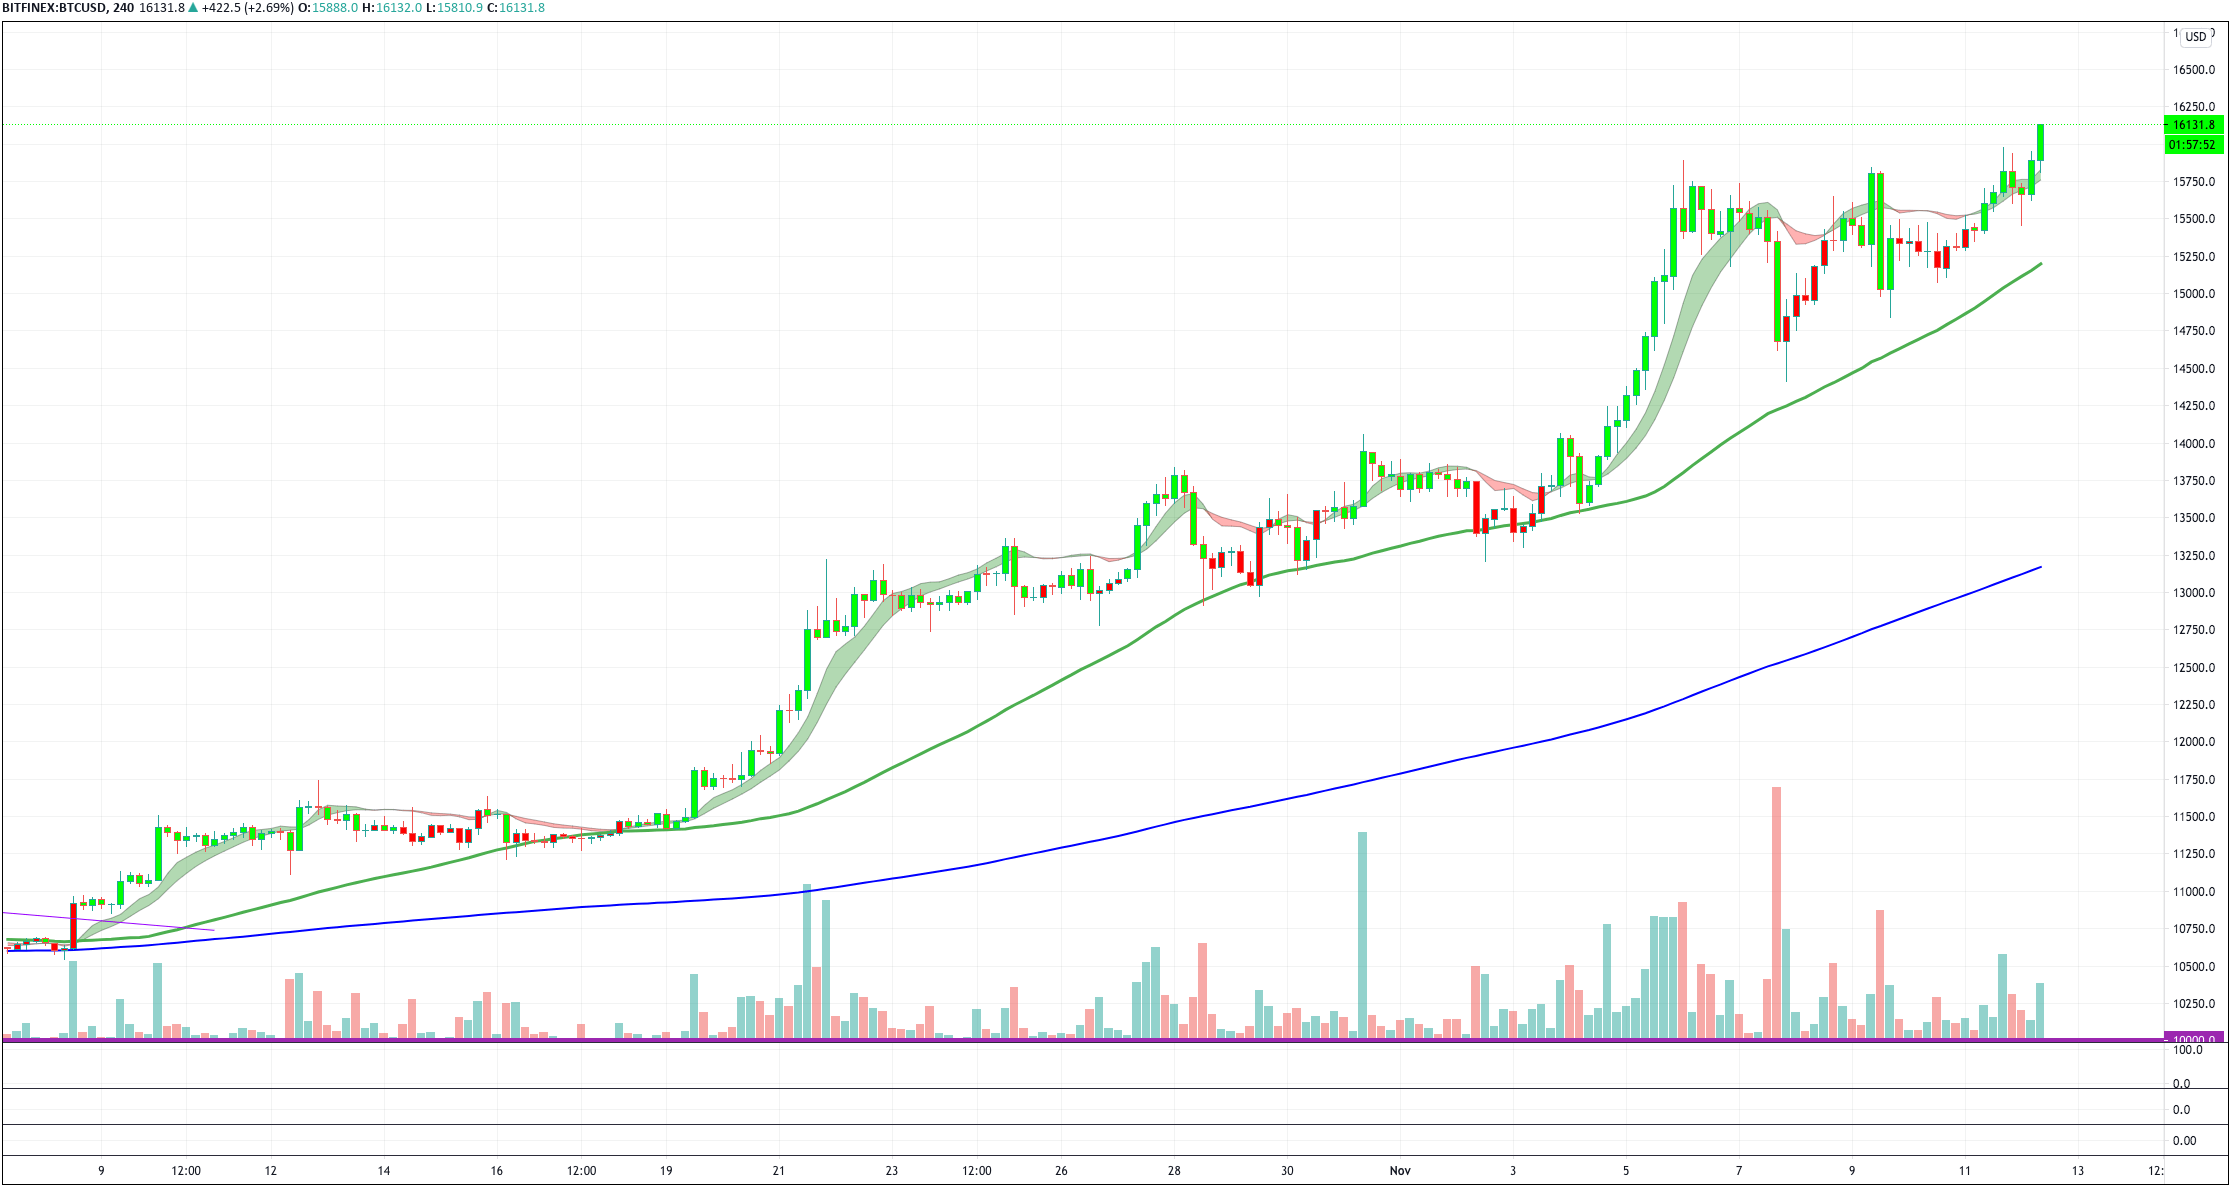
Chart 1 – Bitcoin 4H chart impulsive Phase
In chart 1, we show Bitcoin moving in its latest impulsive phase, although we can also see a glimpse of corrective structures. The main idea here is to follow the trend. The chart shows a ribbon formed by Ehlers Instant trend, an advanced indicator freely available on Tradingview but also MT4 and MT5 platforms.
We see that the indicator is right at delivering timely entries and exits. The chart also shows its 50 and 200 simple moving averages, heading up and supporting the trend. We can see that the touching of the 50-SMA line could be used as well to enter or add to the position, although the instant trendline seems to lead the 50-SMA. Tradingview’s Instant Trendline Indicator colorizes the candles’ body so the upward phases can be spotted with ease.
Corrective Properties
Corrective phases come at the end of an impulse. We have to realize that impulses come from a lack of equilibrium between buyers and sellers due to actions to find a new fair value. The fair price is unknown; thus, usually, the impulse creates overbought or oversold conditions. When some savvy traders spot this, they start to unload their positions in a profit-taking activity. That lowers the price to a level where it finds new buyers. The price moves up now, but the memory of traders who lost near the top makes more selling pressure ahead of this level, lowering the price and creating a cyclic path. Thus, the main characteristic of corrective phases is its cyclic characteristic, whereas the main feature of impulses is their lack or decline of cycles.
Since the cycle is the main component of corrections, The best way to time them is by using an oscillator, such as the Stochastic, RSI, or an advanced wave oscillator. If you’re price-action oriented, you may use support-resistance levels and breakouts to spot the right entries and exits.
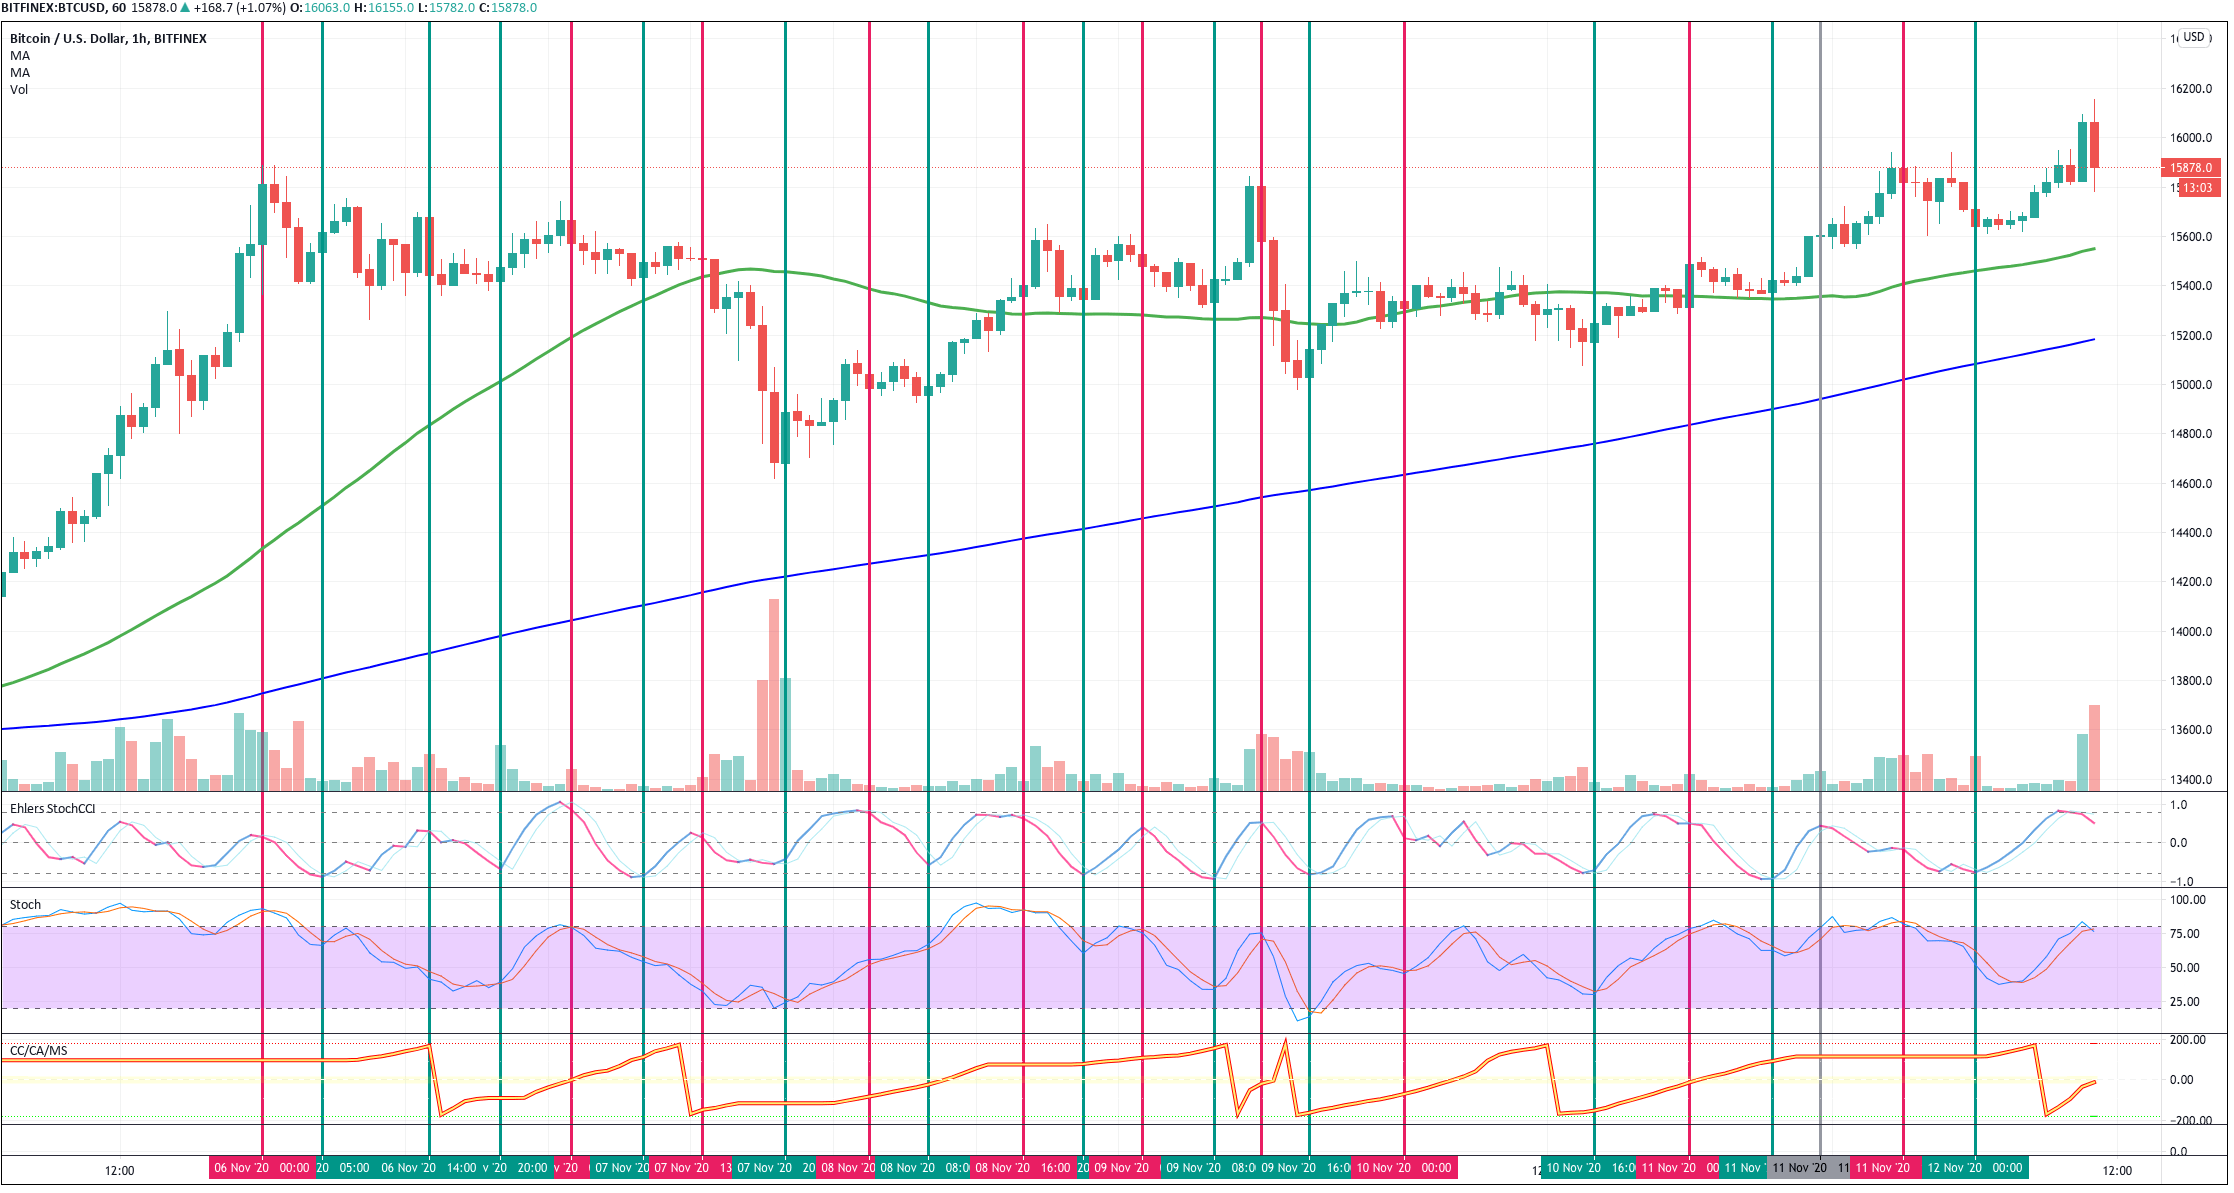
Chart 2 – Bitcoin 1H chart Corrective Phase with Ehlers Stochastic CCI, Stochastic, and AutoCorr Angles.
As an example, we show on chart 2 the corrective phase of Bitcoin that started after a move up to $15,000 from the last consolidation of $13,500.
The image shows the stochastic oscillator( third curve) and two advanced oscillators buy the innovator of this century, John Ehlers, The Stochastic CCI, and Autocorrelation Angle. These two can also be found on Tradingview.com and MT4 and MT5 platforms.
We see that the Ehler’s Stochastic CCI (second curve, following the price) can precisely time the cycles on the chart with razor-sharp precision. However, the Stochastic oscillator is not far behind and can be used to profit from these cycles or confirm a reversal candle.
The bottom image shows the Autocorrelation angles indicator.
Autocorrelation is an advanced way to spot the short-term memory of the markets. A sharp move on the angle will show a transition from bear to bullish and bullish to bearish phases. This indicator is harder to handle, though.
There are many others, such as the Even better Sinewave indicator, shown in the third chart. The Even Better Sinewave is designed to find the dominant cycle of the price action. Sometimes, the market loses its pace, as happens in the whipsaw (amber) shown. But most of the time, this advanced indicator can time the cycle changes accurately.
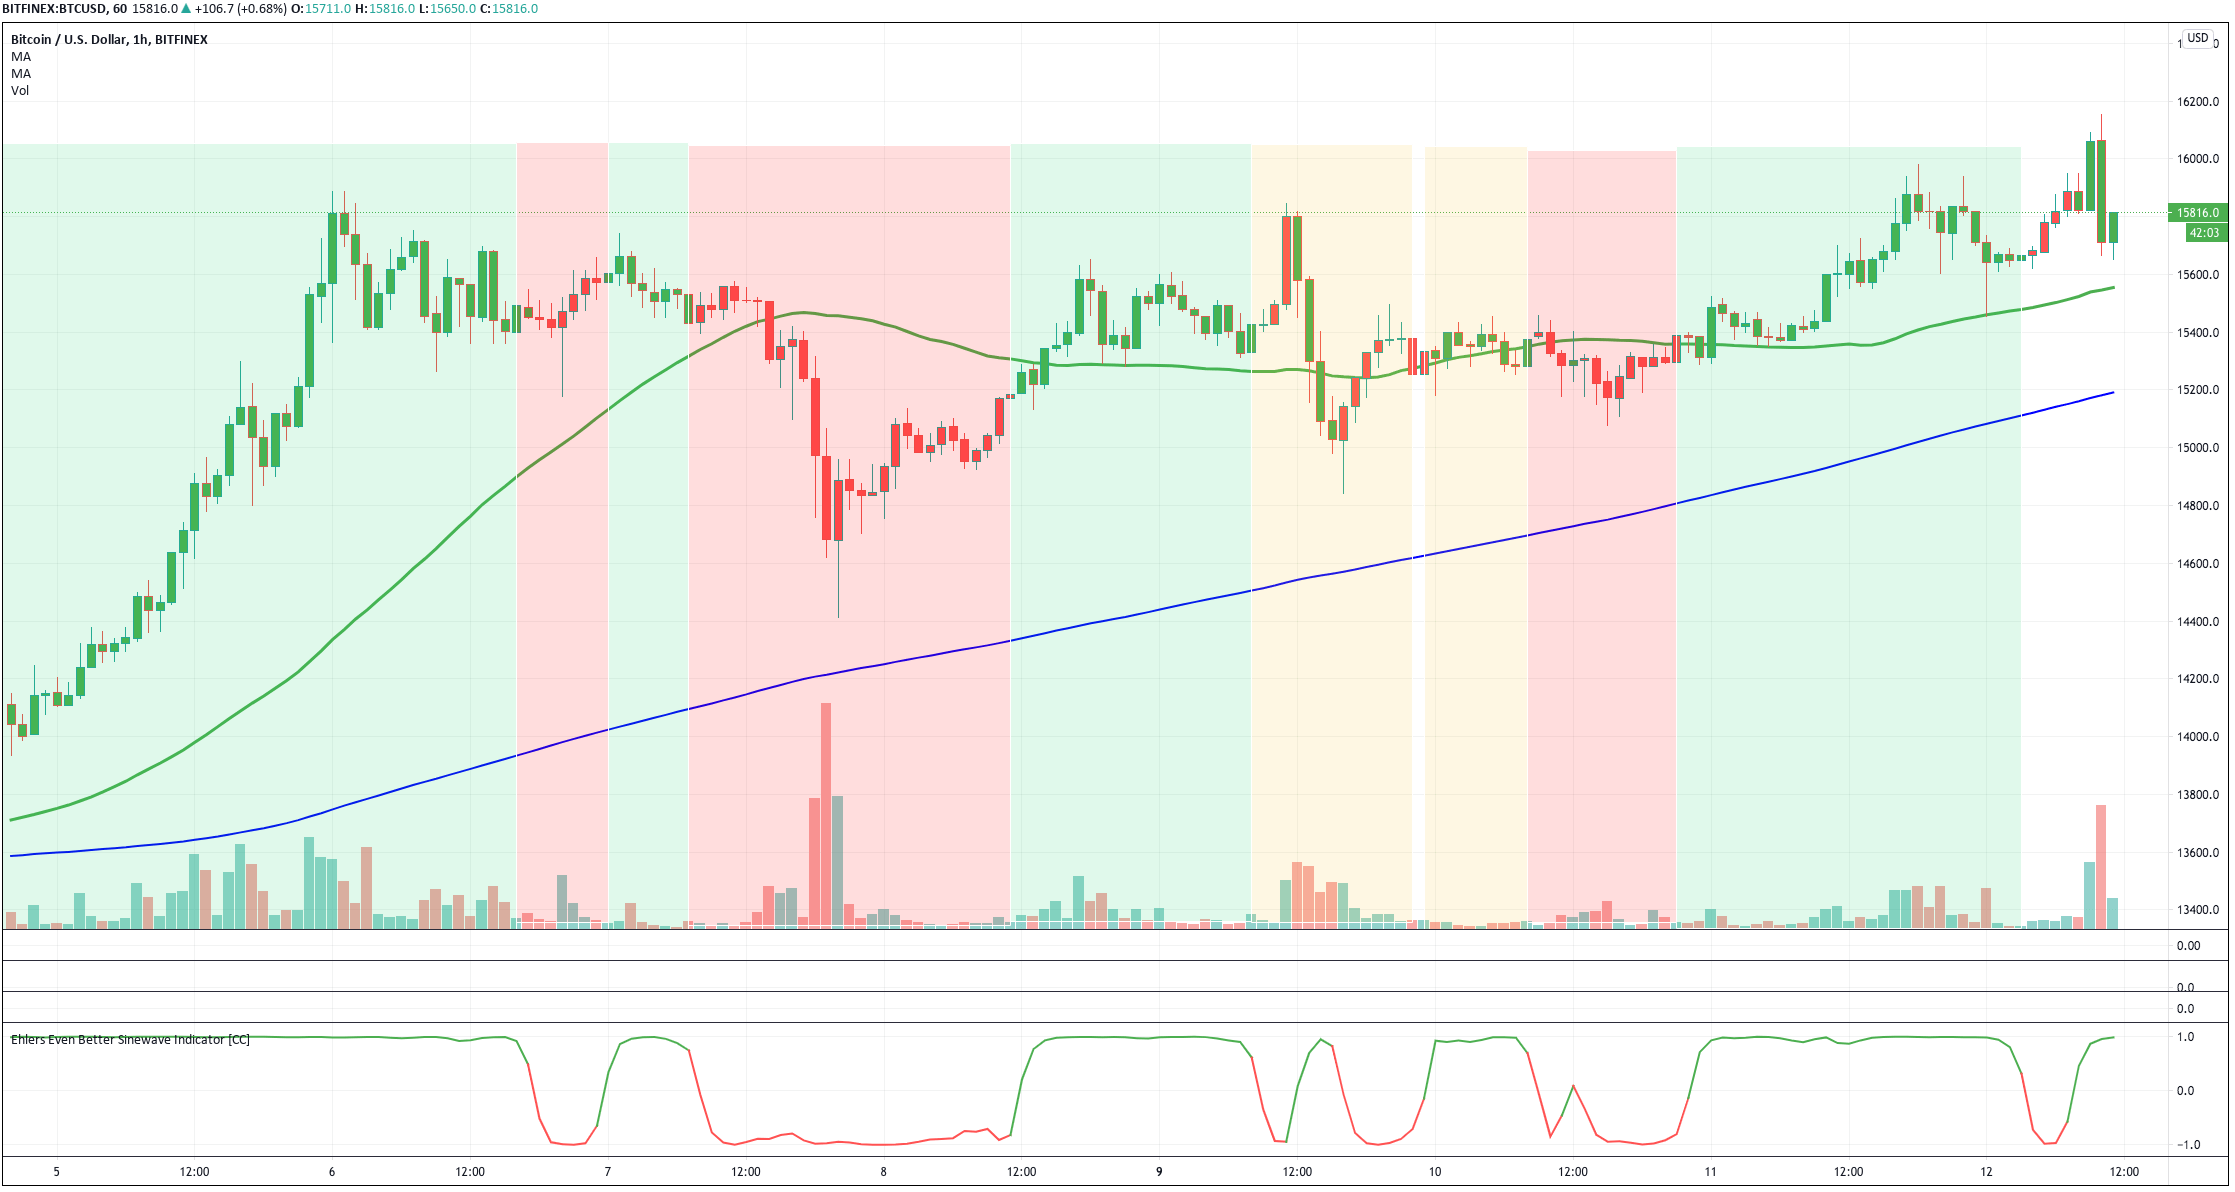
Chart 3 – Bitcoin 1H chart Corrective Phase with Even Better Sinewave Indicator
To conclude
Markets have two phases: Impulsive and corrective.
Each needs the right tools to find suitable entries and exits.
Traders need to spot first the state of the market.
If Impulsive, apply Averages or advanced versions of moving averages and follow the trend.
If corrective, use oscillators to spot turning points.
Don’t be conformist. Look for advanced tools and learn to use them. They will give you a better edge.