
Technical Overview
The EURGBP cross develops an incomplete Elliott wave correction of Minor degree labeled in green, which began on September 03rd when the price found fresh buyers at 0.88658 and rallied until 0.92916, in where the cross completed its wave A in green.
The following 4-hour chart illustrates wave B completion. We see that its internal structure looks like a double-three pattern. This second leg started on 0.92916 on September 11th and ended on November 11th when the price found fresh buyers that boosted the cross in a move that looks like an impulsive intraday rally.
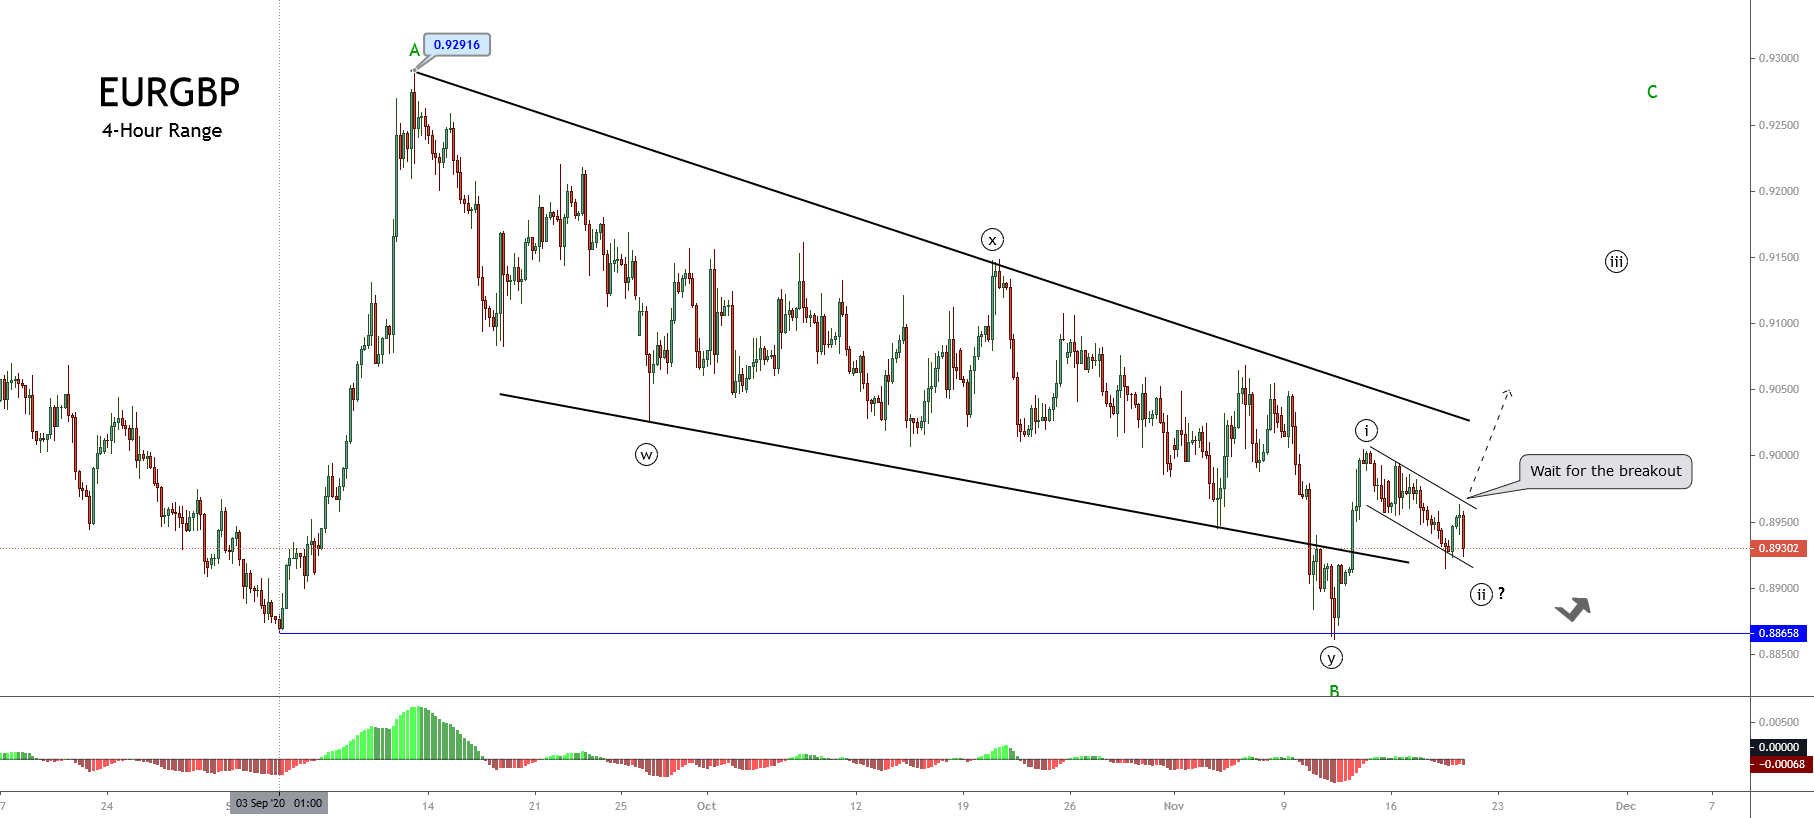
According to the Elliott Wave theory, the double-three pattern is a complex correction that follows an internal structure subdivided into 3-3-3. Likewise, in a corrective formation subdivided into three-wave movements, the segment corresponding to wave C should hold five segments inside it.
On the other hand, considering the Elliott wave theory’s alternation principle, the price likely could advance in an aggressive rally after an extended complex movement.
The cross is advancing in its wave ((ii)) of Minute degree labeled in black that belongs to wave C of Minor degree. In this context, the descending channel’s upper line’s breakout would confirm the potential bullish continuation of wave (iii).
Short-term Technical Outlook
The next 4-hour chart shows the second wave of Minute degree’s internal corrective structure, which could be advancing in its wave (c) of Minuette degree labeled in blue.
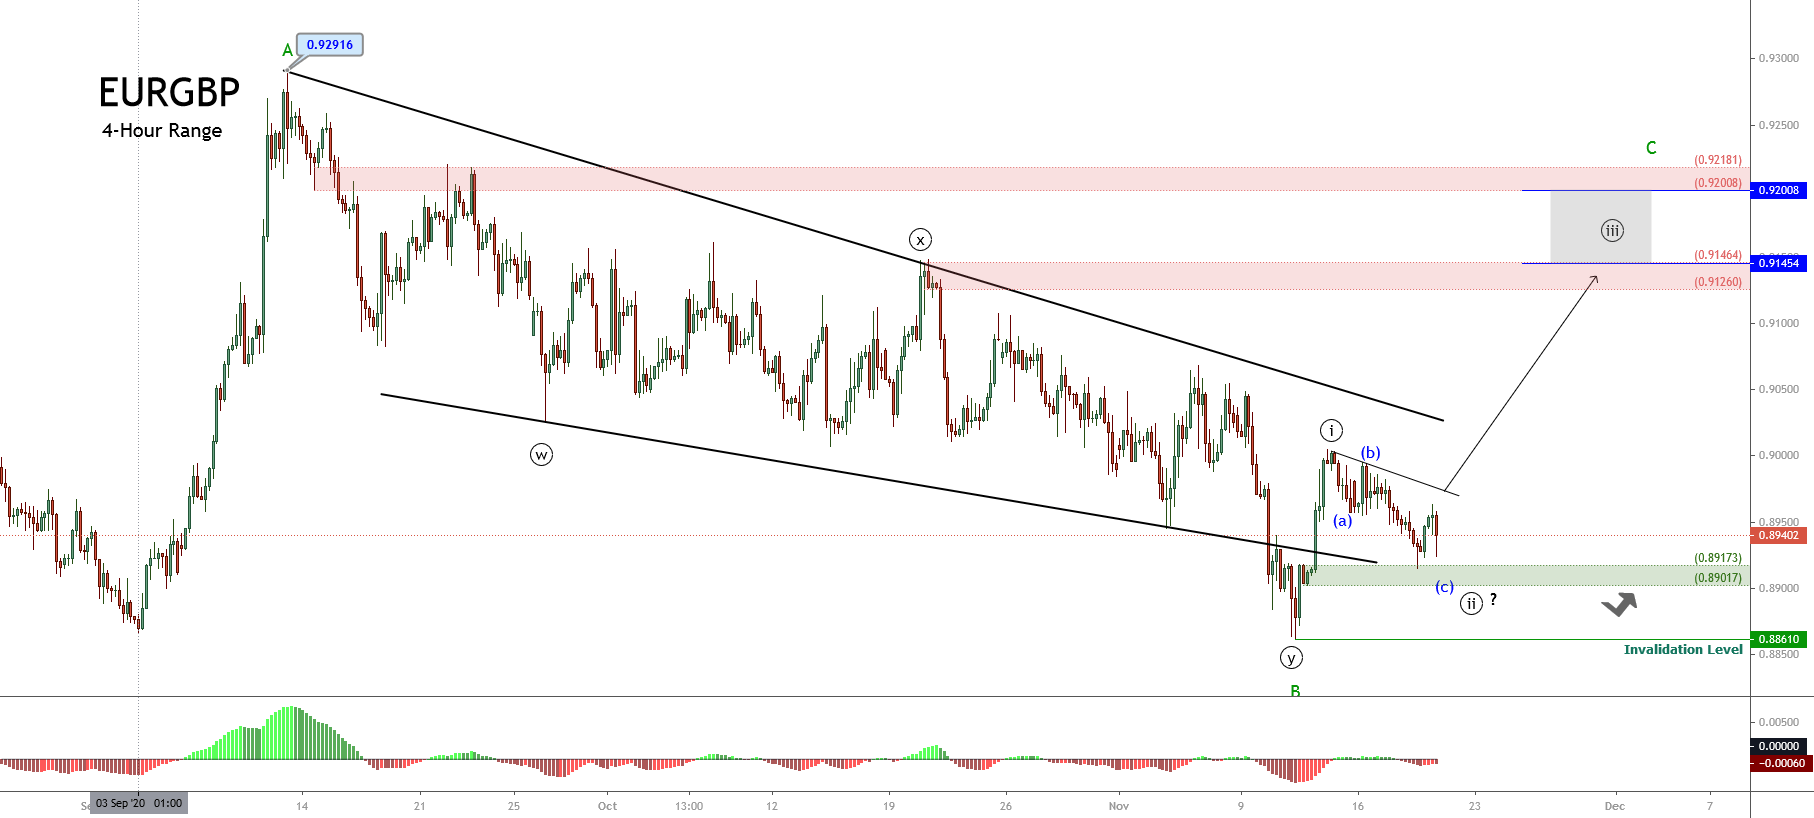
From the previous chart, if the cross finds support in the demand zone located between 0.8917 and 0.8901, opens the likelihood of a new rally corresponding to wave ((iii)), which could advance toward the first supply zone between 0.9126 and 0.91464. The next potential target zone resides between 0.9200 and 0.9218.
On the other hand, both the breakout of the intraday descending trendline that connects the end of waves ((i)) in black and (b) in blue and the surpassing of the end of wave ((i)) will confirm the advance in wave ((iii)) of Minute degree.
Finally, the bullish turning scenario’s invalidation level locates at 0.88610, which corresponds to the origin of wave ((i)).