Introduction
Platinum is one of the rarest precious metal found in the Earth’s crust. Only a few hundred tons are produced annually. The name Platinum is derived from a Spanish word platina (little silver).
Similar to how other precious metals like Gold and Silver are traded in the exchange market, Platinum is also actively traded in the market. Its ISO code is XPT and is highly traded against the US Dollar with the ticker XPT/USD.
Understanding XPT/USD
Platinum is a precious metal that is measured in troy ounces (Oz). The market price of XPT/USD represents the value of the US Dollar for one troy oz of Platinum. It is quoted as 1 XPT per X USD. For instance, if the current market price of XPT/USD is 814.50, then it means that each oz of Pl is worth 814.50 USD.
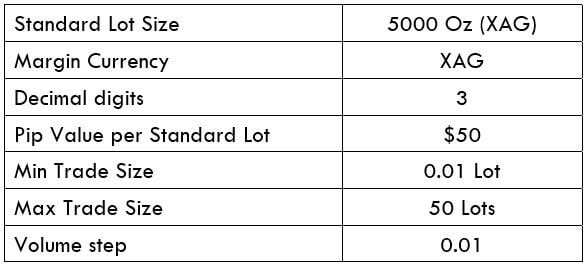
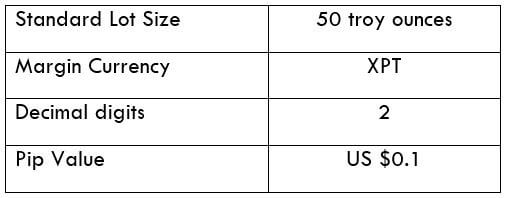
XPT/USD Specification
Spread
It is the difference between the bid and the ask prices. The typical spread in Platinum is usually around 700 pips.
Fee
Unlike currency pairs, Platinum is traded as a Contract for difference (CFD). There are three different types of the fee charged for such trades:
- Commission charge
- Overnight fee
Thus, the total fee will be,
Total fee = Spread + commission + overnight
For our example, we shall ignore the overnight fee as it completely depends on how long aa trader is willing to hold his positions. So, the revised fee will be,
Total fee = Spread + commission = 700 + 200 = 900 pips
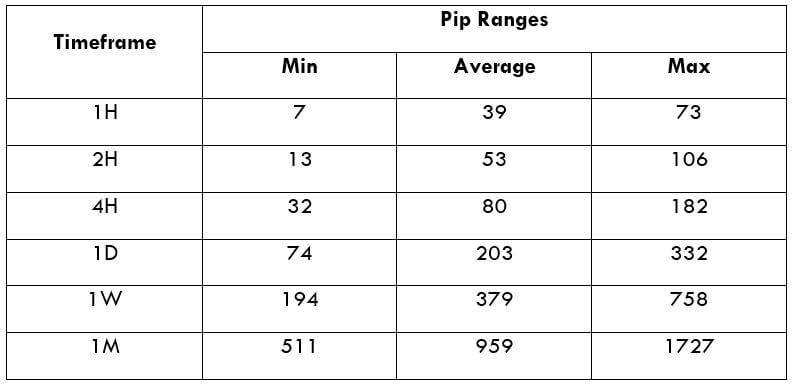
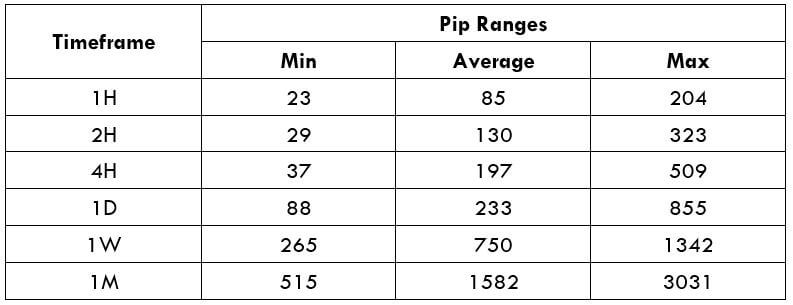
Trading Range in XPT/USD
The trading range is a representation of volatility in the pair for different time frames in a tabular format. It gives the minimum, average, and maximum volatility in the pair for various time frames.
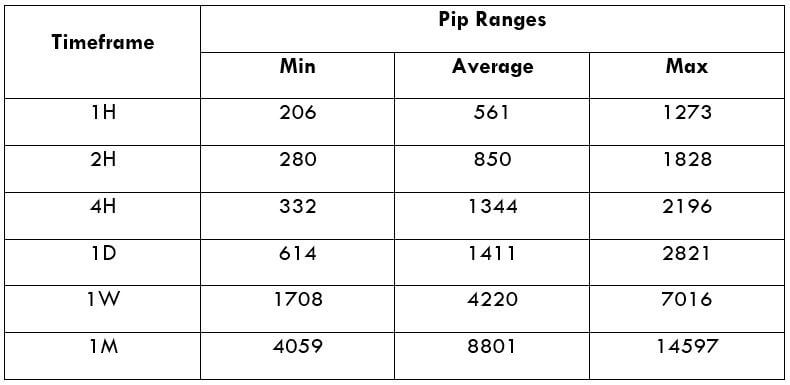
Procedure to assess Pip Ranges
- Add the ATR indicator to your chart
- Set the period to 1
- Add a 200-period SMA to this indicator
- Shrink the chart so you can assess a large time period
- Select your desired timeframe
- Measure the floor level and set this value as the min
- Measure the level of the 200-period SMA and set this as the average
- Measure the peak levels and set this as Max.
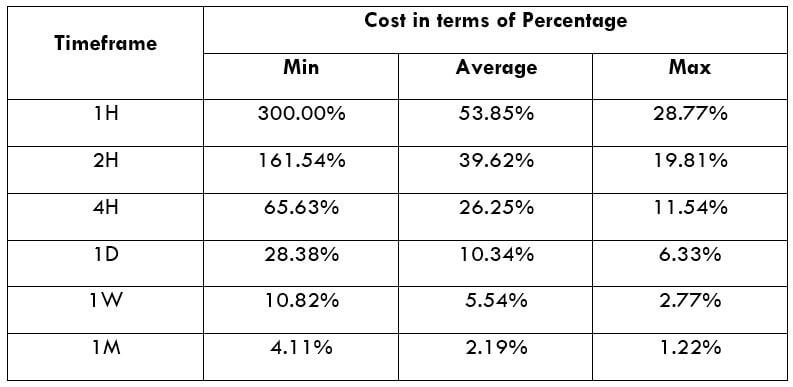
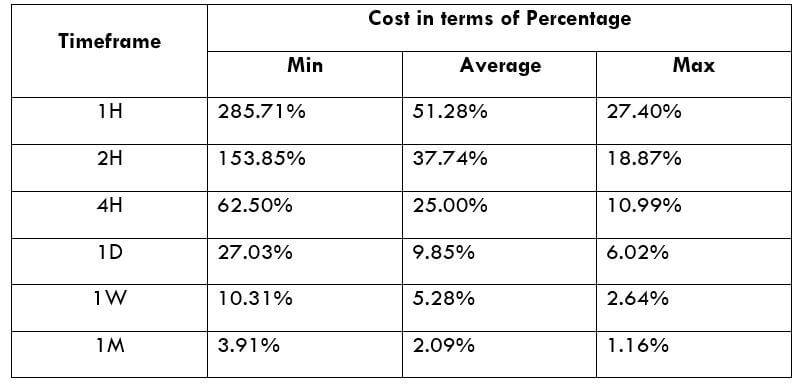
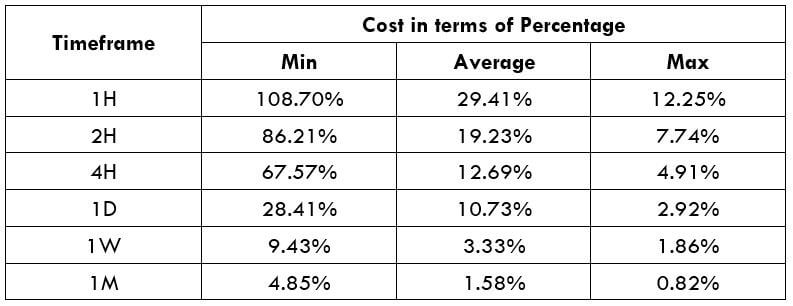
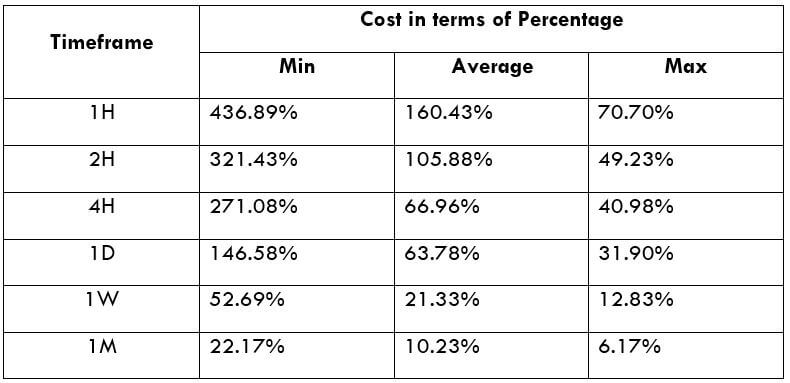
XPT/USD Cost as a Percent of the Trading Range
Cost as a % of the trading range illustrates the variation in the cost of trade by considering the time frame and volatility of the instrument. Mathematically, it is the ratio of the volatility value and the total cost represented in terms of a percentage.
Total fee = Spread + commission = 700 + 200 = 900 pips
Trading the XPT/USD
Platinum is one of the highly traded commodities in the exchange market. But its trading volume is lesser than Gold Spot and Silver Spot. Nonetheless, it has enough volatility and liquidity for retail traders to participate in the market.
Platinum is primarily driven by supply and demand that comes from fundamental factors. These factors are different from that of Gold and Silver, yet some do apply on Pl. When it comes to technical analysis, all the techniques apply that is used in other markets.
As mentioned, Platinum is traded as CFD, and each trade has a commission, overnight, and spread involved in it. This fee is fixed irrespective of the volatility of the market and the time frame traded. But there is a catch here. Even though the fee is fixed, the fee varies relatively. Meaning, a trader aiming high profit must pay the same fee as a trader aiming for small profits. The former is typically a large time frame trader, while the latter is a trader trading relatively smaller time frame.
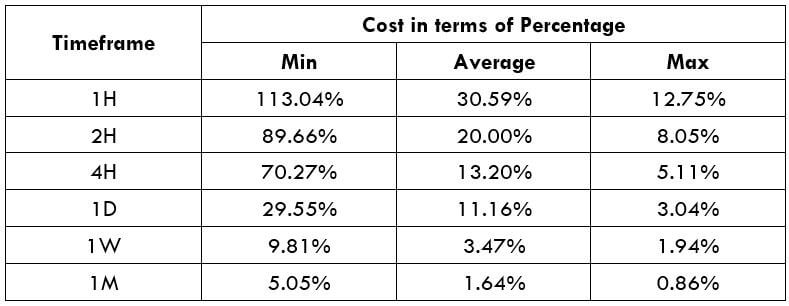
Since the timeframe is something that cannot be fixed, one can relatively reduce costs by considering the volatility of the market. As the above table evidently depicts, as the volatility increases, the relative fee on the trade decreases. Thus, one must consider trading when the volatility of the pair is at or above the average volatility.