
Introduction
Oil is one of the largest commodities in the world that is traded heavily. The reason for high liquidity is that it is a basic necessity. It is needed to run factories, machinery, ships, and cars. Canada is one of the largest exporters of Oil, and it forms a major part of the total volume of commodities exported. Due to these reasons, Canada is positioned in the world’s top ten oil-producing nations, and as a consequence, it’s economy is severely impacted when oil prices decline. Many traders today predict the movement of the Canadian dollar using the price of Oil.
When oil prices rise, the Canadian dollar tends to strengthen. Similarly, when oil prices are low, the Canadian dollar tends to weaken. Japan, in contrast, is considered as the net importer of Oil. So, when oil prices rise, Japanese yen weakens, and when oil prices drop, Japanese yen strengthens. Many traders are not very comfortable trading Oil due to the volatility it possesses.
An alternate and improvised way trading oil directly would be to utilize knowledge of oil prices to trade the CAD/JPY currency pair. As Canada is the net exporter and Japan is the net importer of oil, oil price becomes a major indicator for the movement of the CAD/JPY currency pair. That is why we have named this strategy a ‘Commodity Correlation Strategy.’ Let us dive into the strategy and explore the steps involved.
Time Frame
The commodity correlation strategy works well with the daily (D) and weekly (W) time frame charts. Swing trading is the most suitable trading style for this strategy as it has a long-term approach to the price. Therefore, the strategy cannot be used for day trading or on 4-hours’ time frame chart.
Indicators
We use just one technical indicator in this strategy, and that is the Average True Range (ATR) to set the stop loss for the trade. We don’t use any other indicator during the application of the strategy. If one is not familiar with the ATR indicator, it is recommended to refer our article on ATR before understanding the strategy.
Currency Pairs
This strategy can be used with CAD/JPY currency pair only, with the movement of oil prices as our leading indicator.
Strategy Concept
The price movement of crude Oil is used as a reference to catch a ‘trade’ in CAD/JPY currency pair. Key levels of support and resistance on the crude oil chart are used to spot long and short opportunities in CAD/JPY pair. If price closes above resistance on the oil chart, a long trade is activated on the CAD/JPY the following day. Similarly, if the price closes below support on the oil chart, a short trade is triggered on the CAD/JPY the following day. The risk to reward of trade taken based on this strategy is a minimum of 1:2, which is above normal. A bigger target can be achieved by allowing the trade to run.
Trade Setup
In order to explain the strategy, we focus on the price chart of crude Oil and CAD/JPY currency pair. We are not concerned with any other forex pair. The strategy can be easily understood by those who have basic knowledge of support and resistance.
Step 1
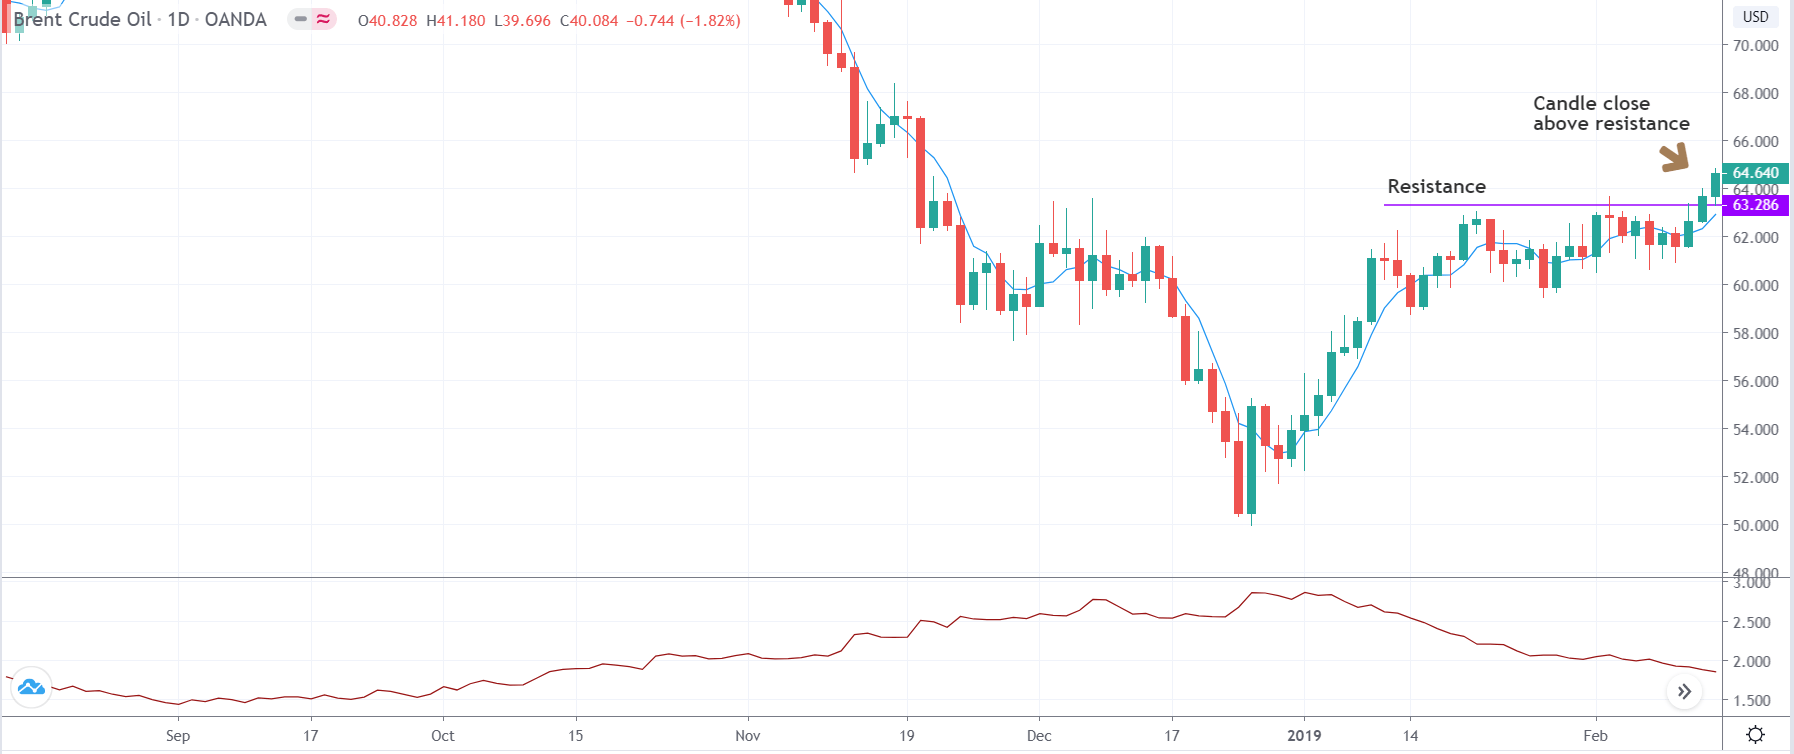
Firstly, we need to open the chart of crude Oil and then find key levels of support and resistance. After marking support and resistance levels, we wait for a breakout or breakdown of the range. After the breakout happens, make sure that the breakout is real and a faker. A close candle well above the resistance area gives us a confirmation of the breakout, and thus we can expect a continuation of the price in the direction of the breakout.
The below image shows how the breakout should be along with the confirmation candle.
Step 2
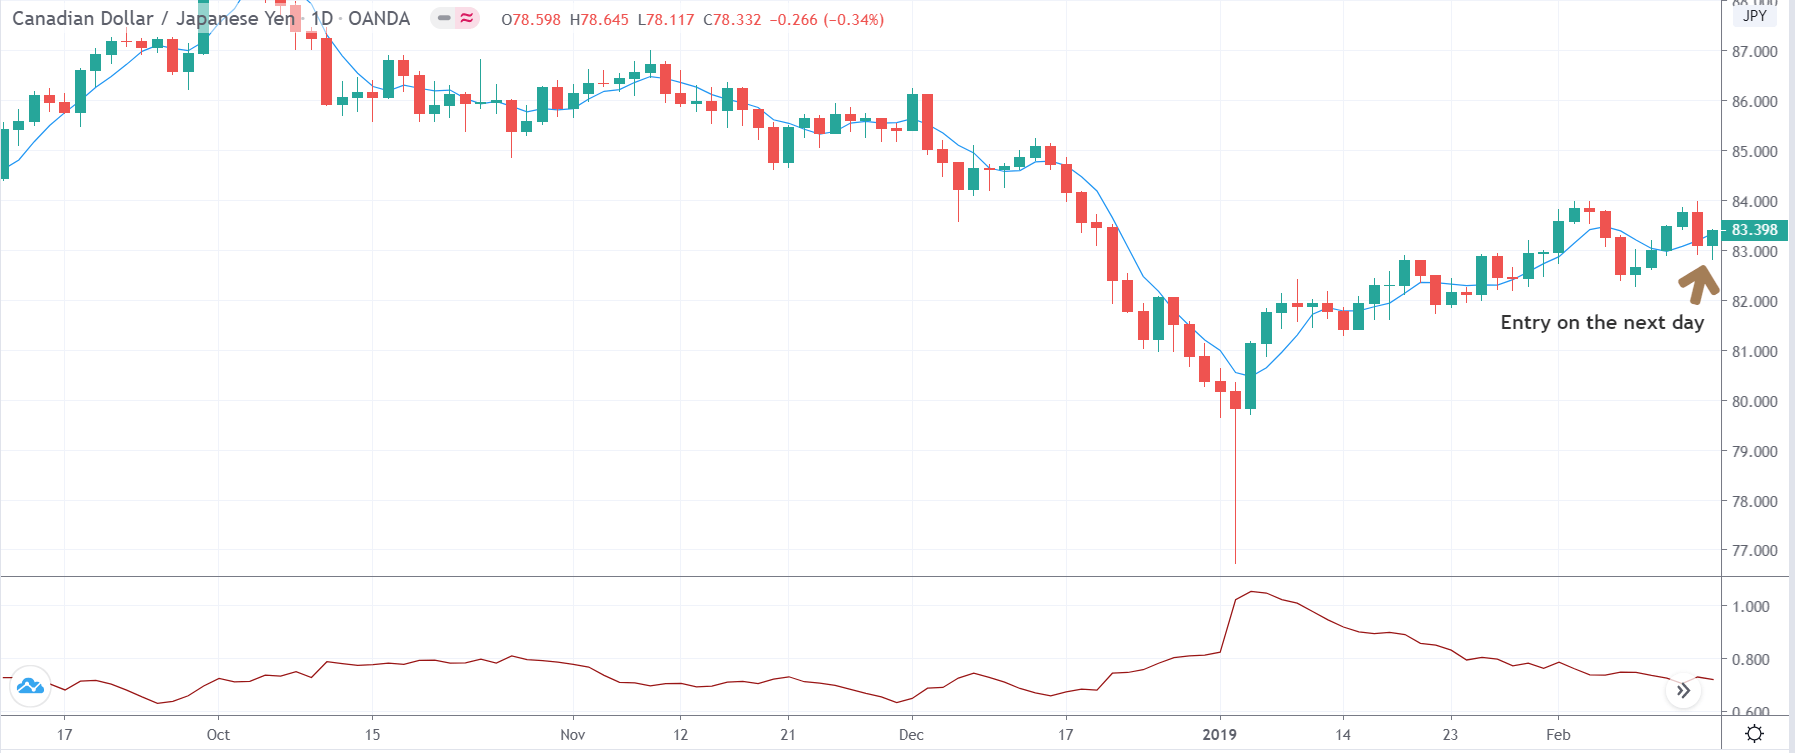
Now, we need to open the chart of CAD/JPY currency pair and locate the price on the day when the breakout took place on the oil chart. Since the breakout on the oil chart is above the resistance, we will ‘long’ in CAD/JPY currency pair after a suitable confirmation sign from the market. A bullish candle on the next day is the confirmation signal for going ‘long.’ In a case of a breakdown below the support, a bearish candle in the CAD/JPY pair on the next day of the breakdown is suitable for going ‘short’ in the pair.
In the above example, we see the formation of a bullish candle on the following day, which triggers a ‘buy’ trade. Let us see what happens further.
Step 3
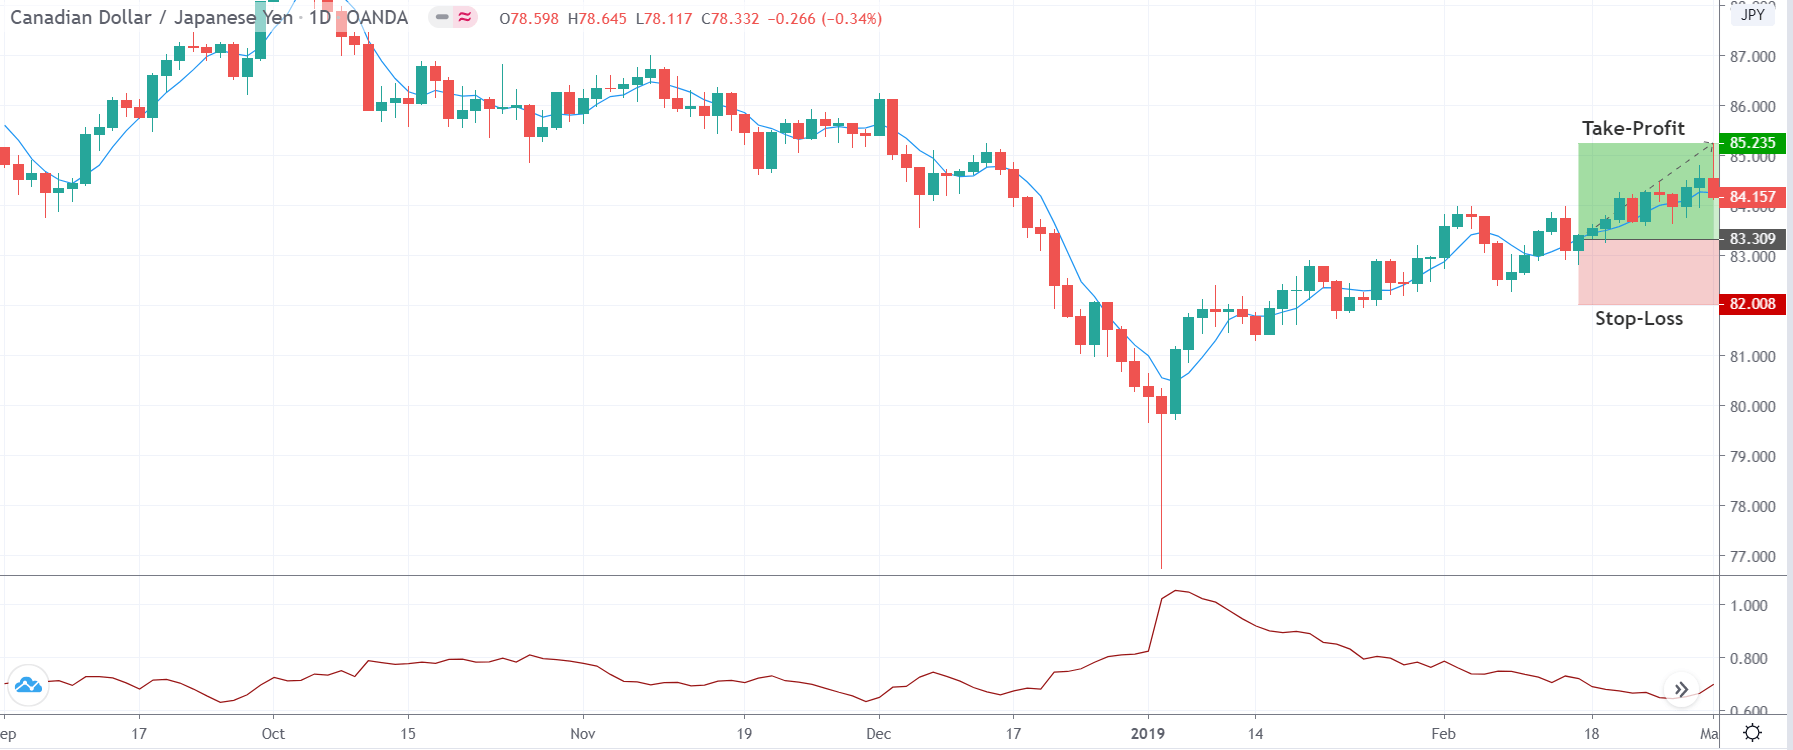
In this step, we determine take-profit and stop-loss levels for our strategy. The stop loss for this strategy is calculated by multiplying the value of ATR by 2. The stop loss is placed by the number of pips obtained after performing the calculation. The take-profit is placed at the price where the risk to reward of the trade will be at least 1:2. However, in most cases, the trade has the potential to provide move higher.
In this example, the risk to reward of the trade was 1.5 as the major trend was down.
Strategy Roundup
Using the Commodity Correlation Strategy, traders can take advantage of the positive correlation between Crude oil prices and the CAD/JPY currency pair. This strategy is especially suitable for traders who want to trade in Oil but do not enjoy the volatility associated with it. This strategy is also suitable for traders who do not have the time to day trade and prefer long-term positions in the pair.
Crude Oil has the highest correlation with CAD and JPY Forex pairs. Hence we have considered these asset classes. You can use this strategy for different Forex pairs depending on which commodities they are correlated with. We hope you found this strategy informative. All the best.