Global Indices
In the last week, we have seen some bullish momentum come into the US Equity indices. We have experienced a bullish week and for now, this appears likely to extend into next week. What is interesting to note from a technical perspective is that we have now seen over the last week is a major structural break to the upside, albeit at different times with the Nasdaq leading the way, followed by the SP500 and then the DJ30. Despite all of the concerns about the global equity space, we are very close to all-time highs once more, these are definitely markets to watch over the coming weeks. Elsewhere in the global equity space, the FTSE has been the star performer and is currently trading very close to its all-time high around the 7790 level as we observe a fairly straight linear move to the upside from the 6852 lows back in March.

EURUSD
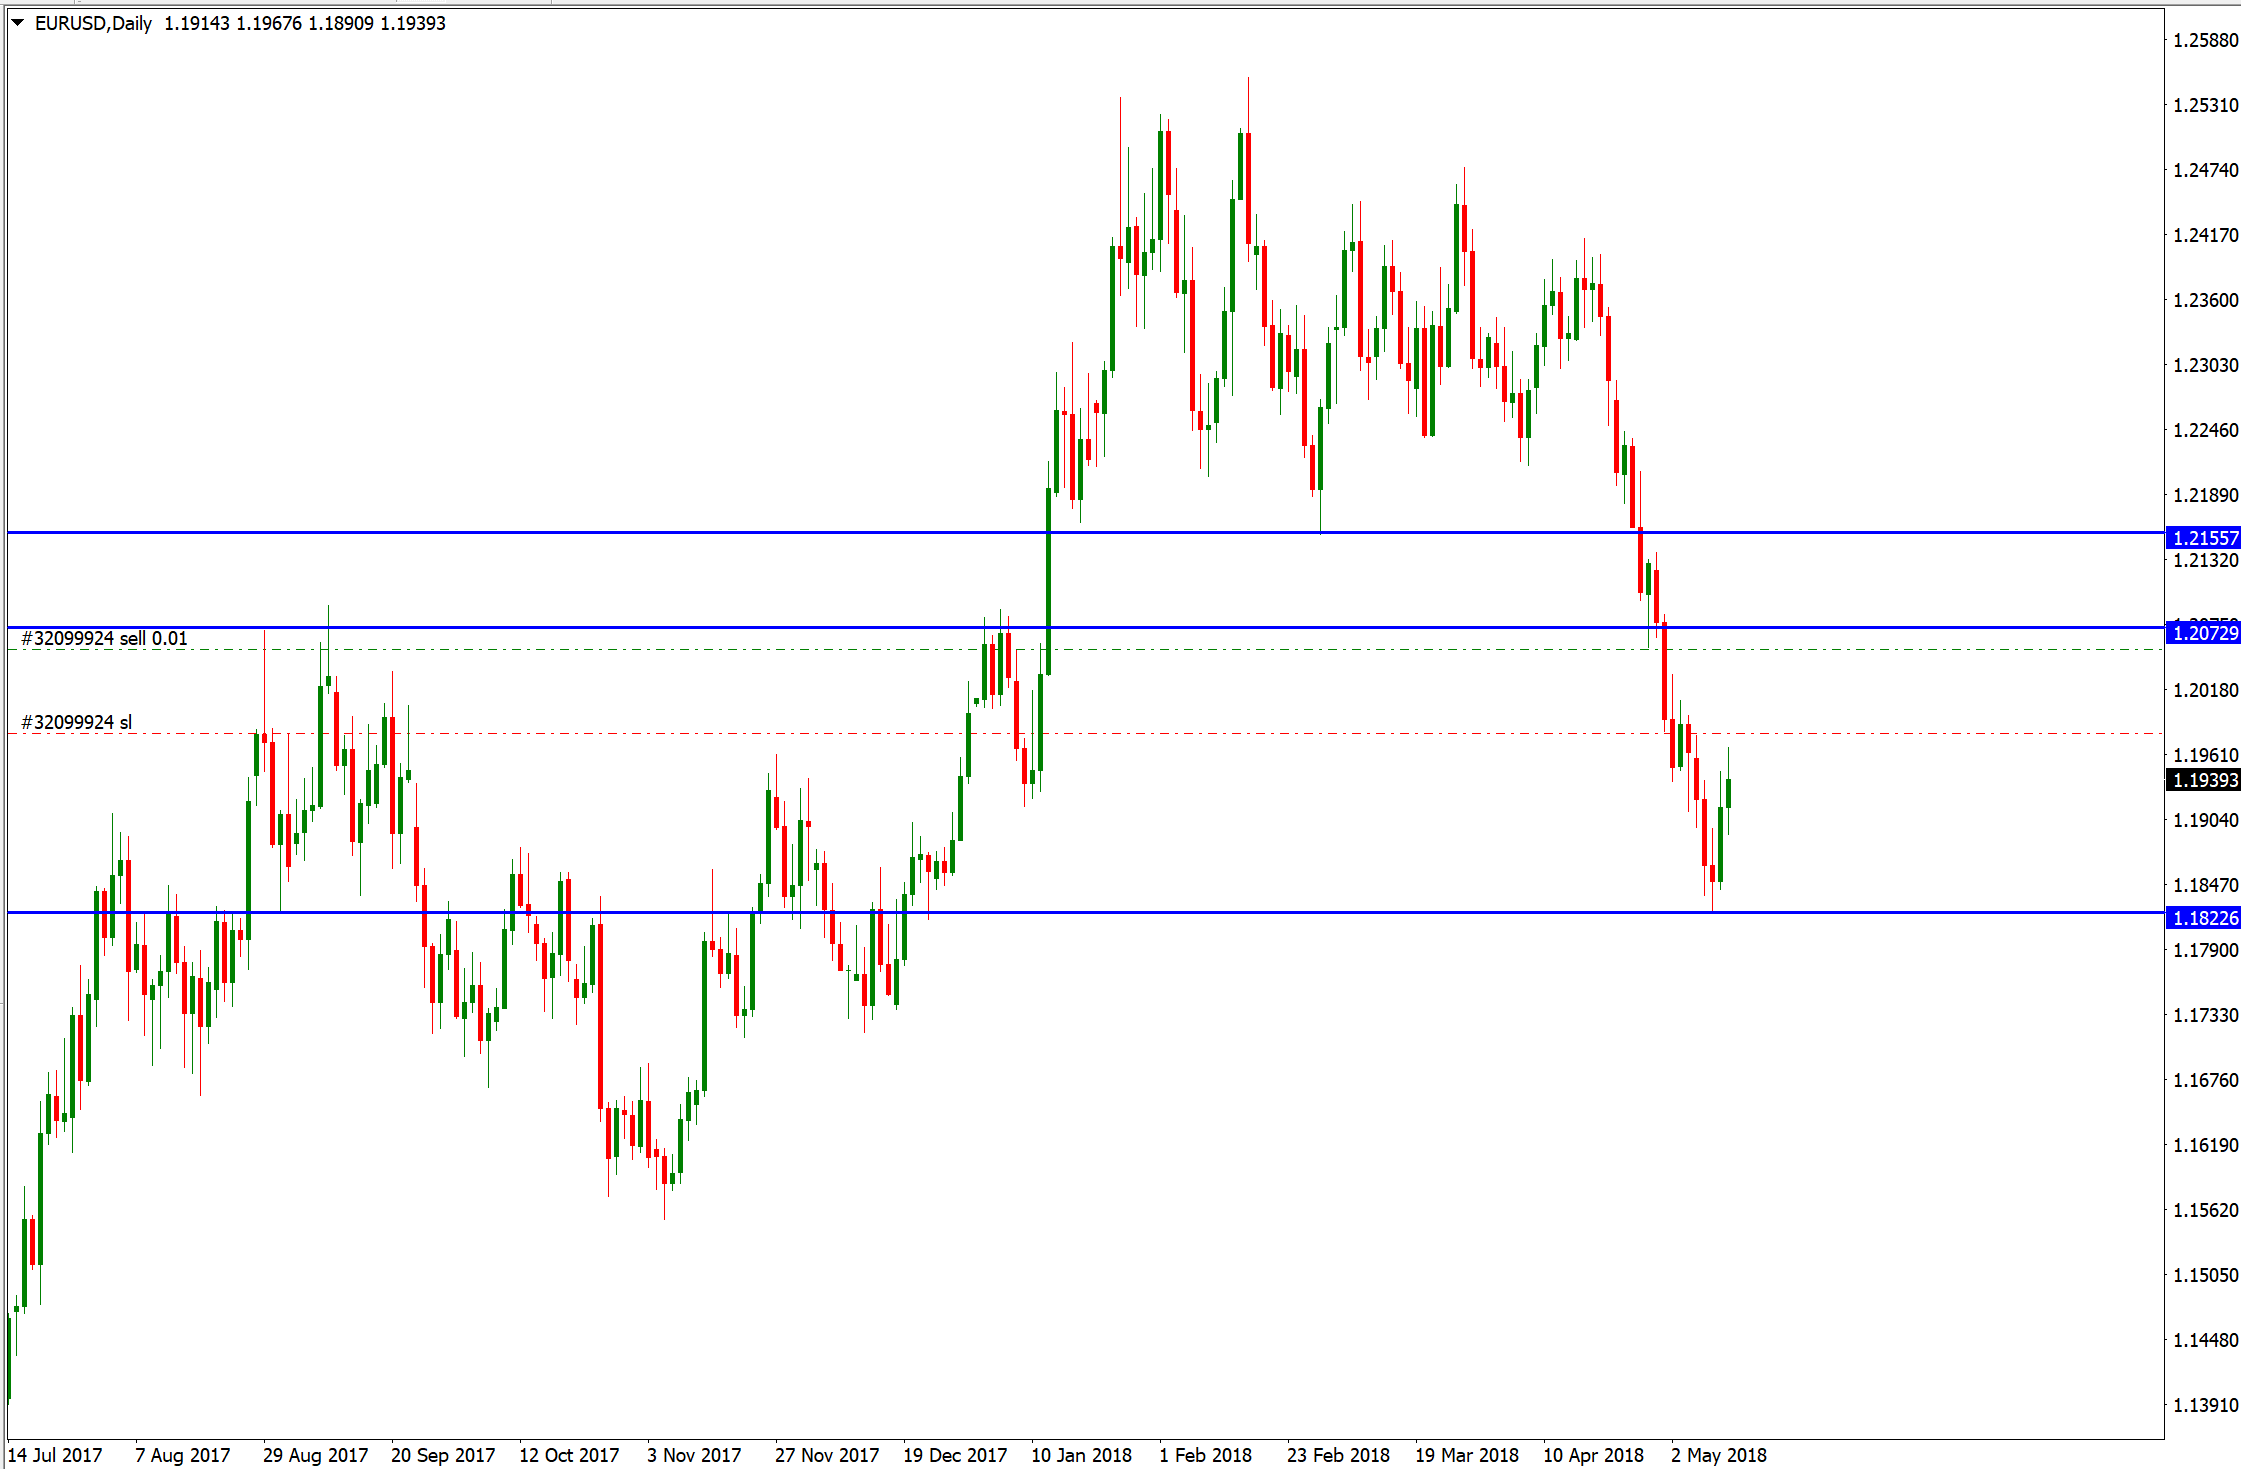
This week has seen USD bulls give back some of the territory they conquered over the past few weeks. At this stage, it looks like the move lower in the USD is a correction and will likely provide better levels to consider longs from in the near term. When observing this pullback, we can identify two significant levels of key resistance in EURUSD, firstly, around the 1.2072 and then the more important level of 1.2155, if the price gets that far. It is also worth noting that the 1.2155 level marked the significant breakout point of consolidation a few weeks back.
USDJPY
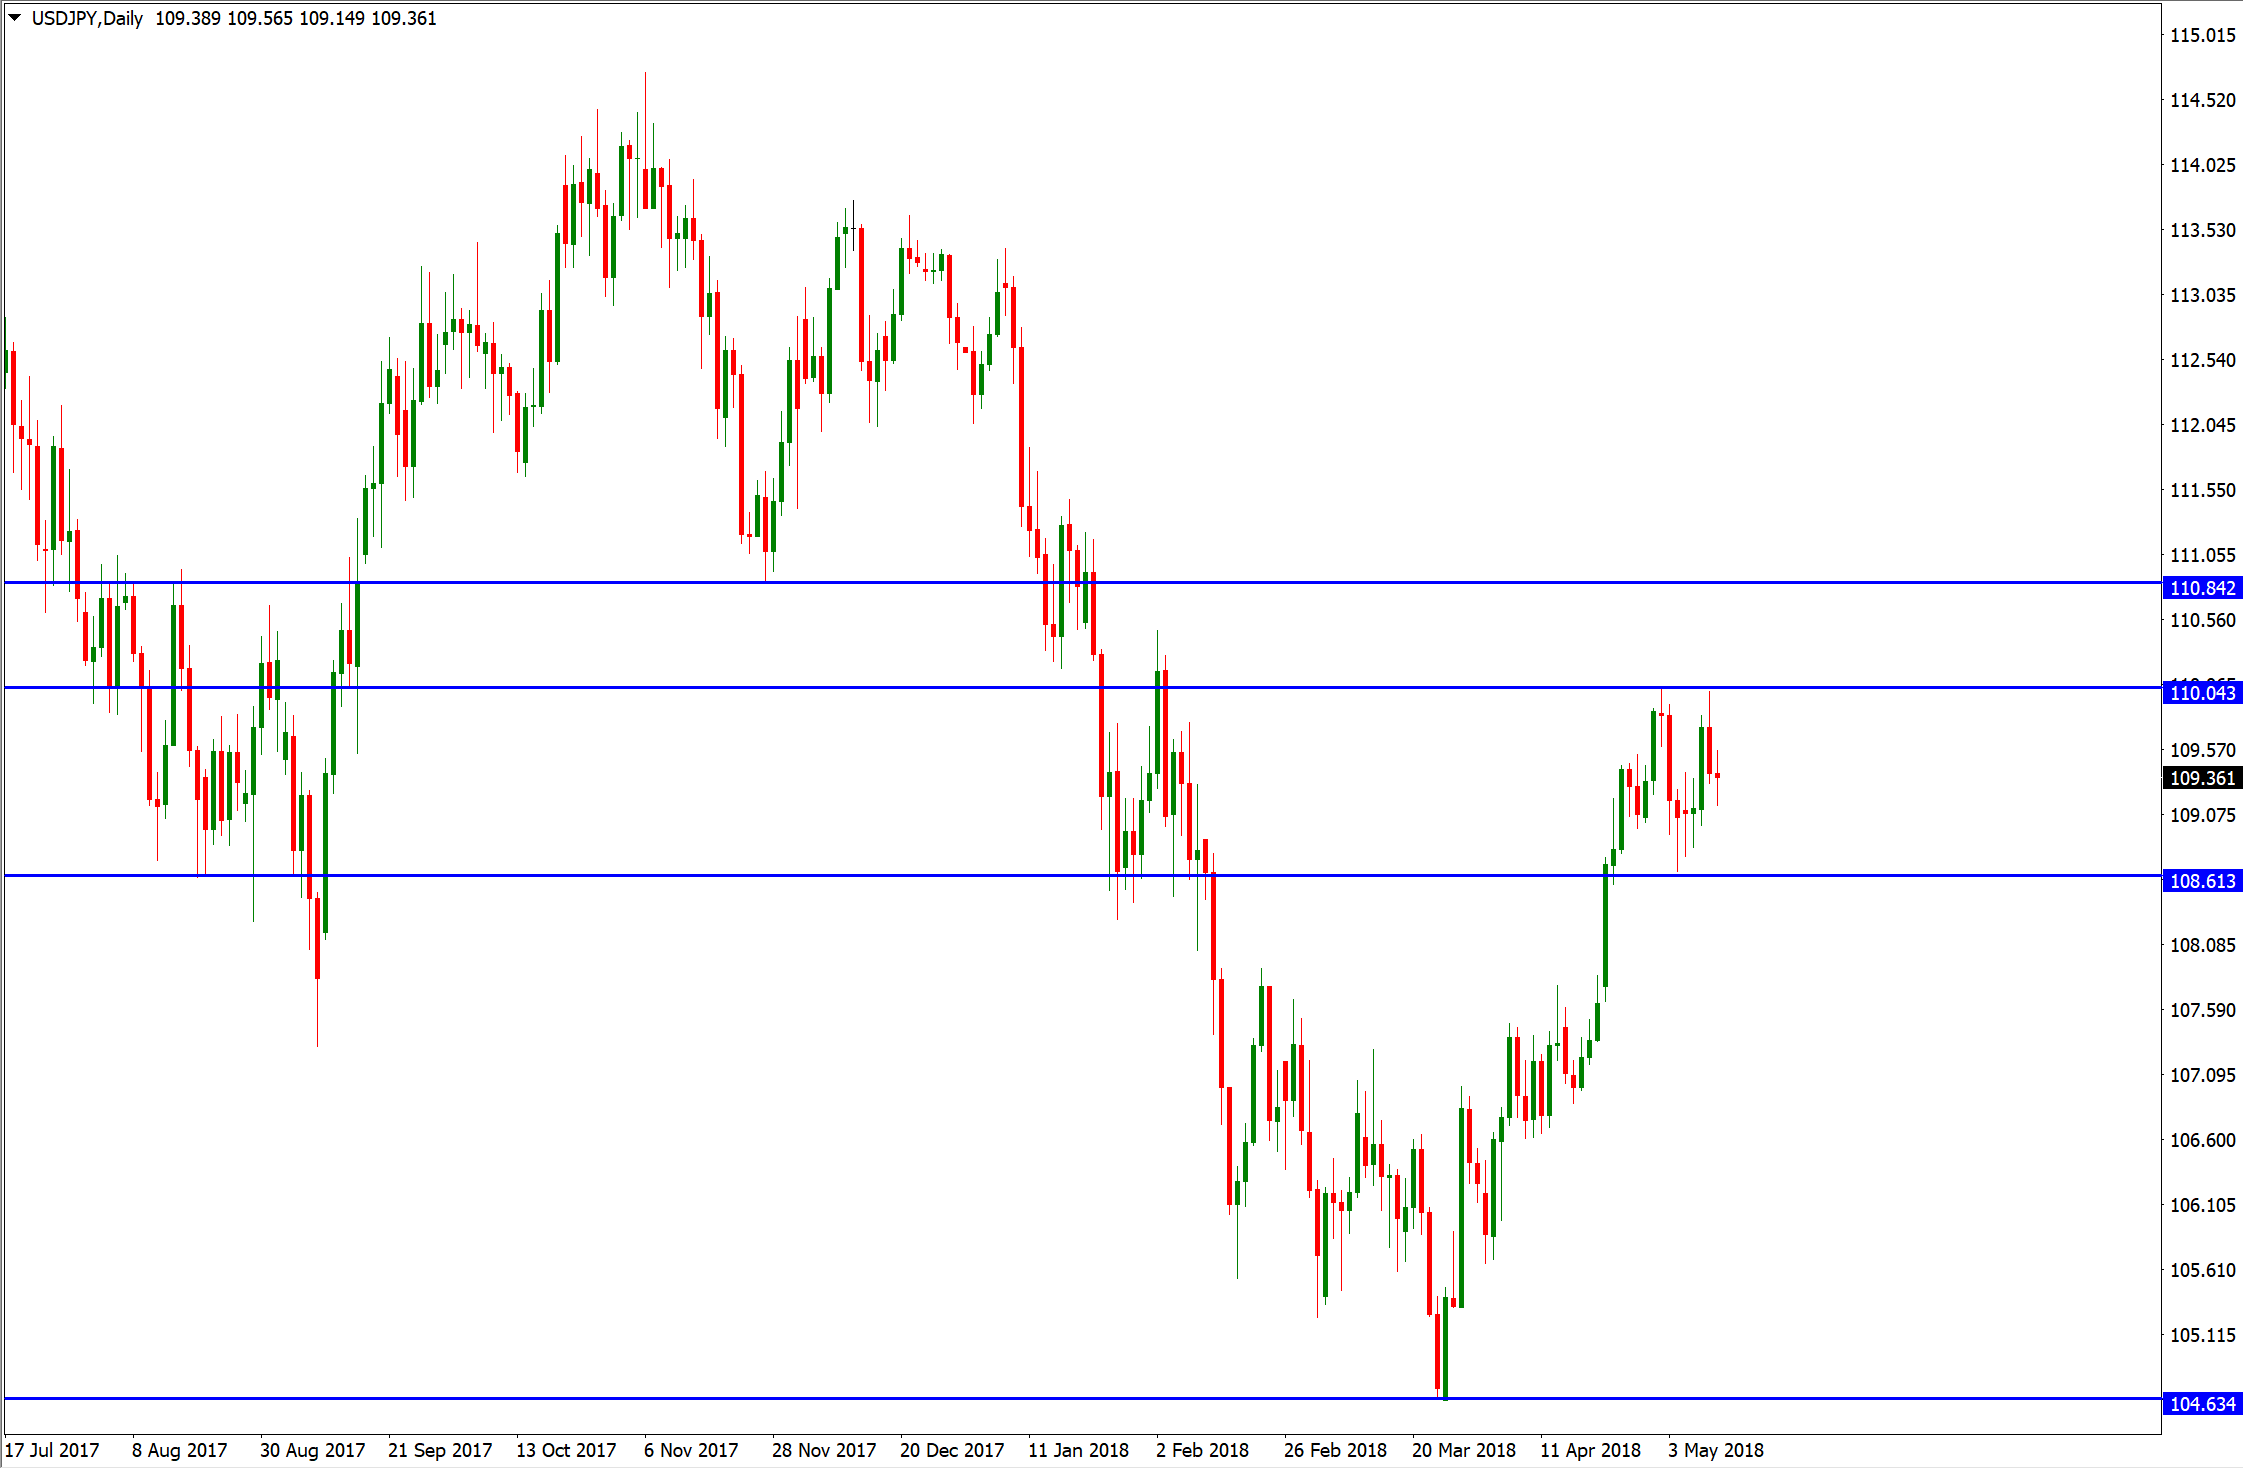
In contrast, the USDJPY has not really behaved like many other of the major dollar pairs, meaning both the dollar and the yen are both weak. Looking at the chart below, we can see the consolidation between 108.61 and 110.04. So, the next step for this market is to be patient and wait for the breakout of either the upside level of 110.04, which is the higher probability trade or a structural failure back below the 108.61, either way, it could prove a decent trading opportunity. However, it would take a move above 110.04 to confirm a resumption of the uptrend in this market.
GBPUSD
Cable is also looking vulnerable and the recent consolidation has taken on the appearance of a bear flag which, if correct, signals an extension lower. Sterling is also likely to remain vulnerable near-term following the BOE decision last week not to hike rates. Furthermore, the recent double top confirmation further highlights the potential for a continuation of the bearish technical outlook.

USDCHF
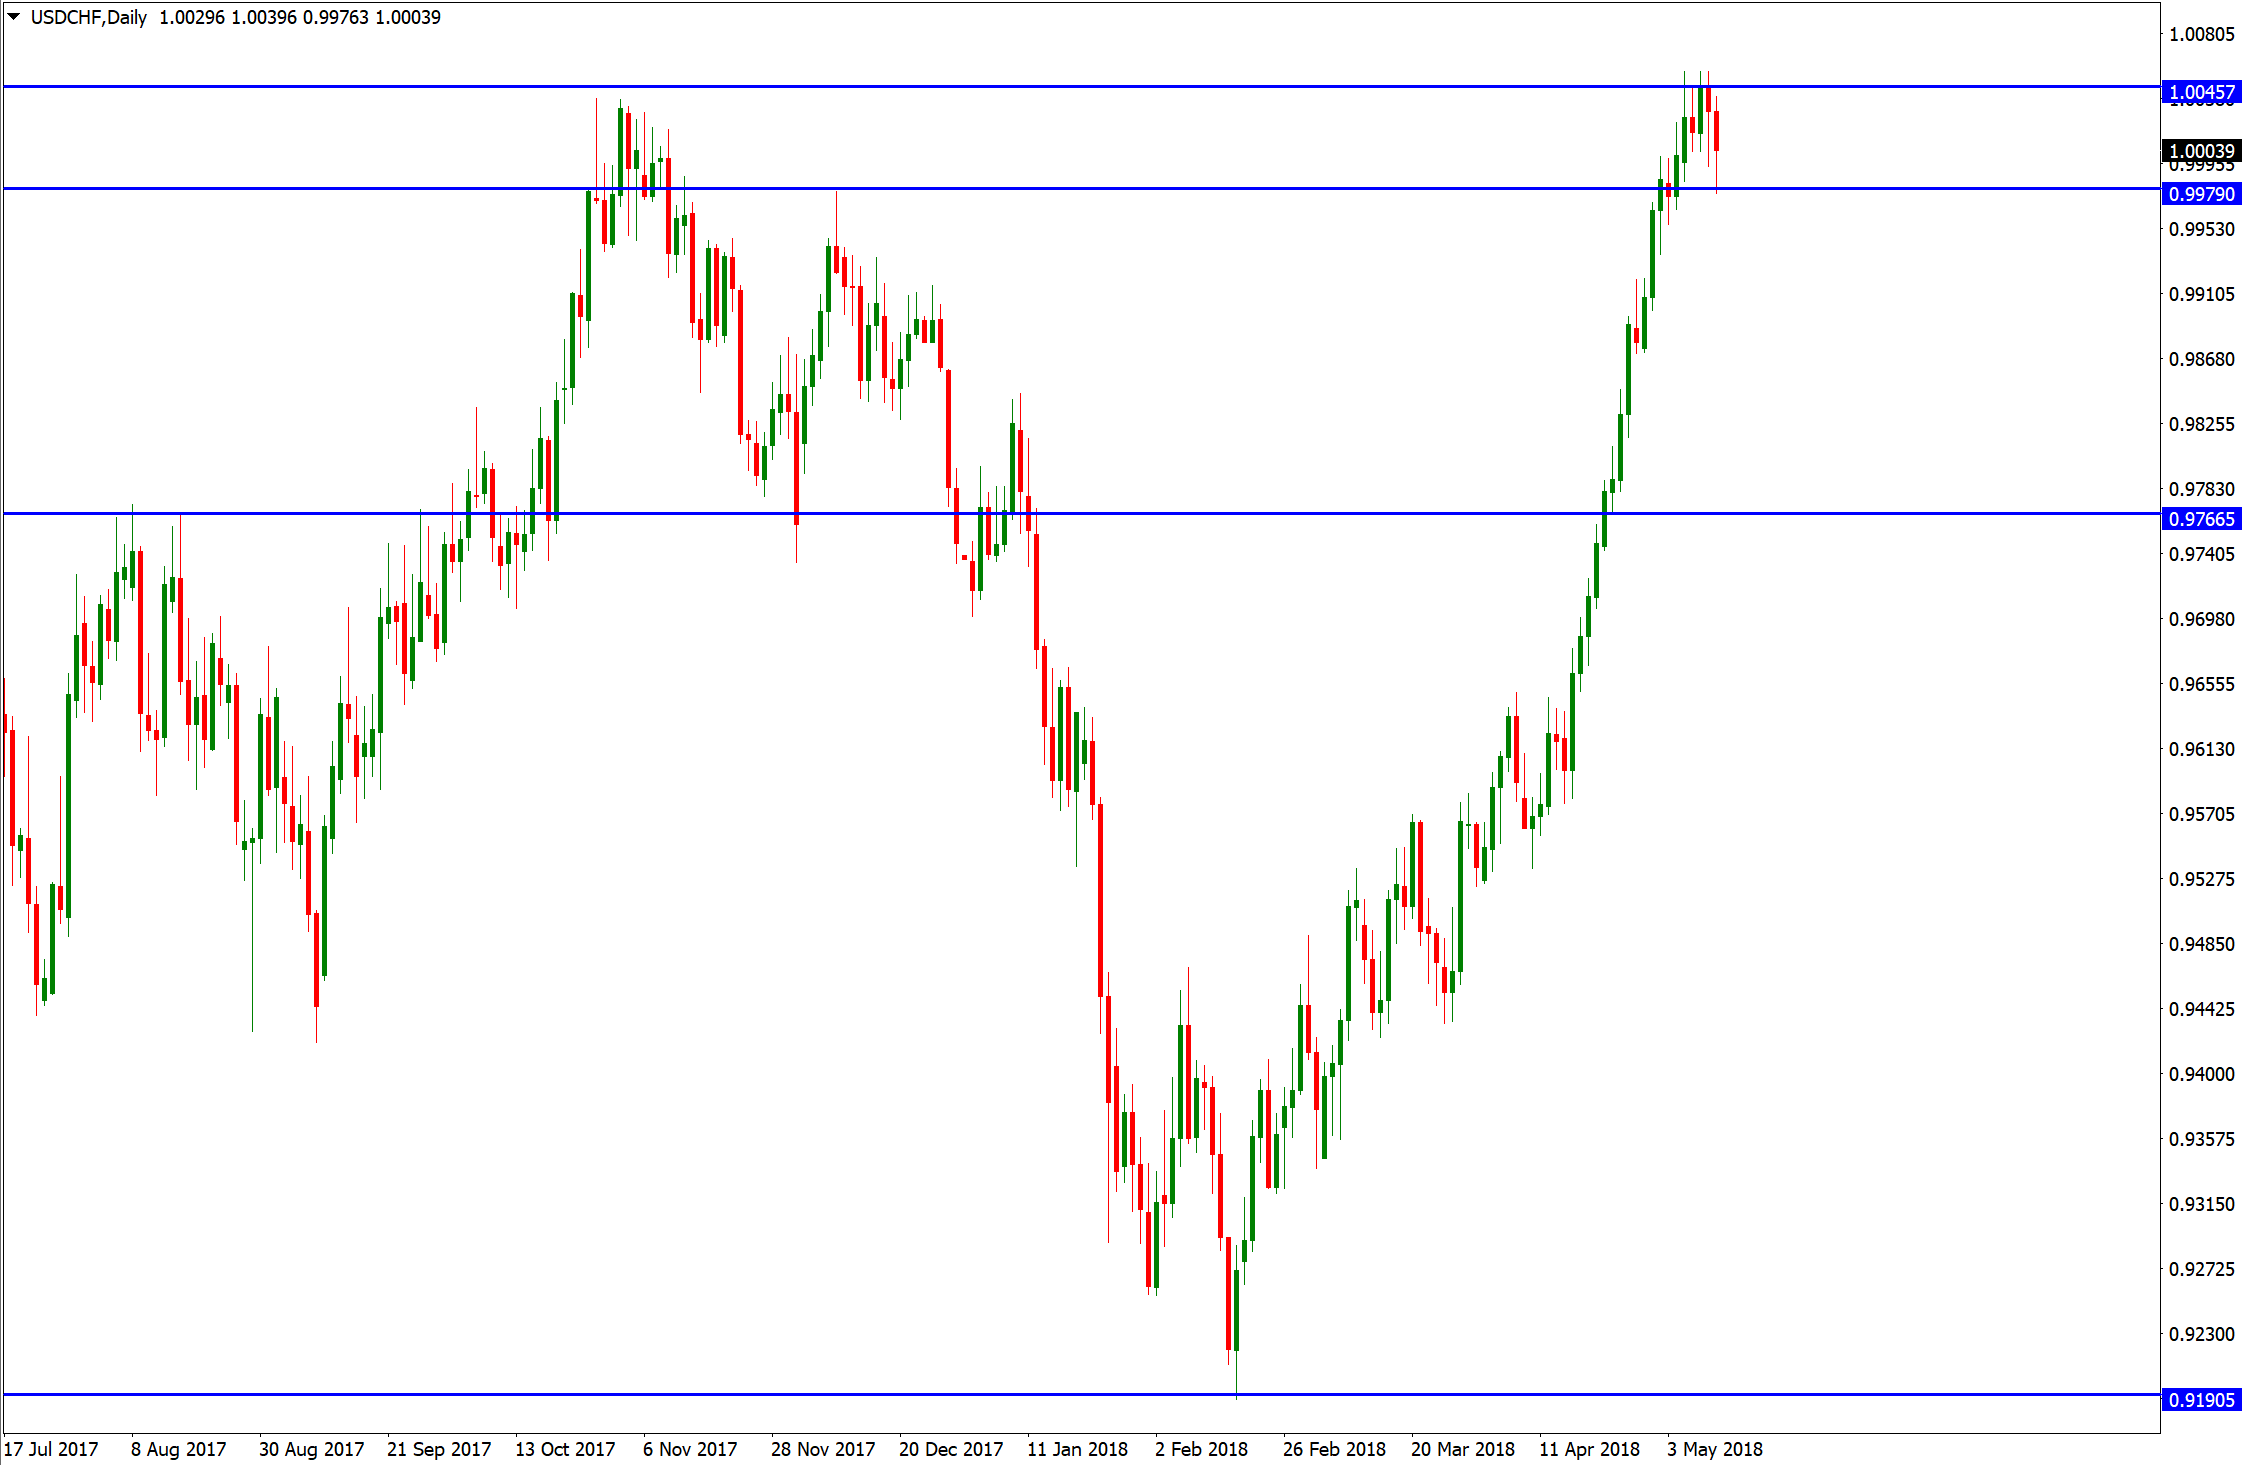
It might also be worth keeping an eye on the USDCHF market as well, which has this week traded back above parity at the 1.0000 level. It is also interesting to note that the EURCHF continues to hover below 1.2000, a level which the Swiss National Bank defended resolutely for so long until they removed the 1.2000 peg at 9am on the 15th Jan 2015. A break of this level to the upside any time soon would be significant and further highlight the bearish CHF outlook across the board.
GOLD
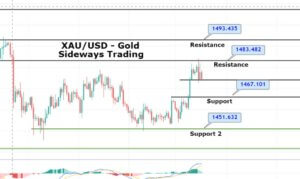
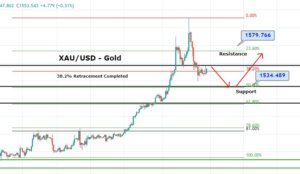
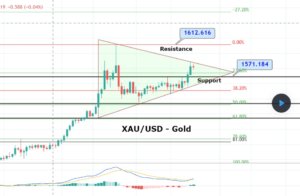
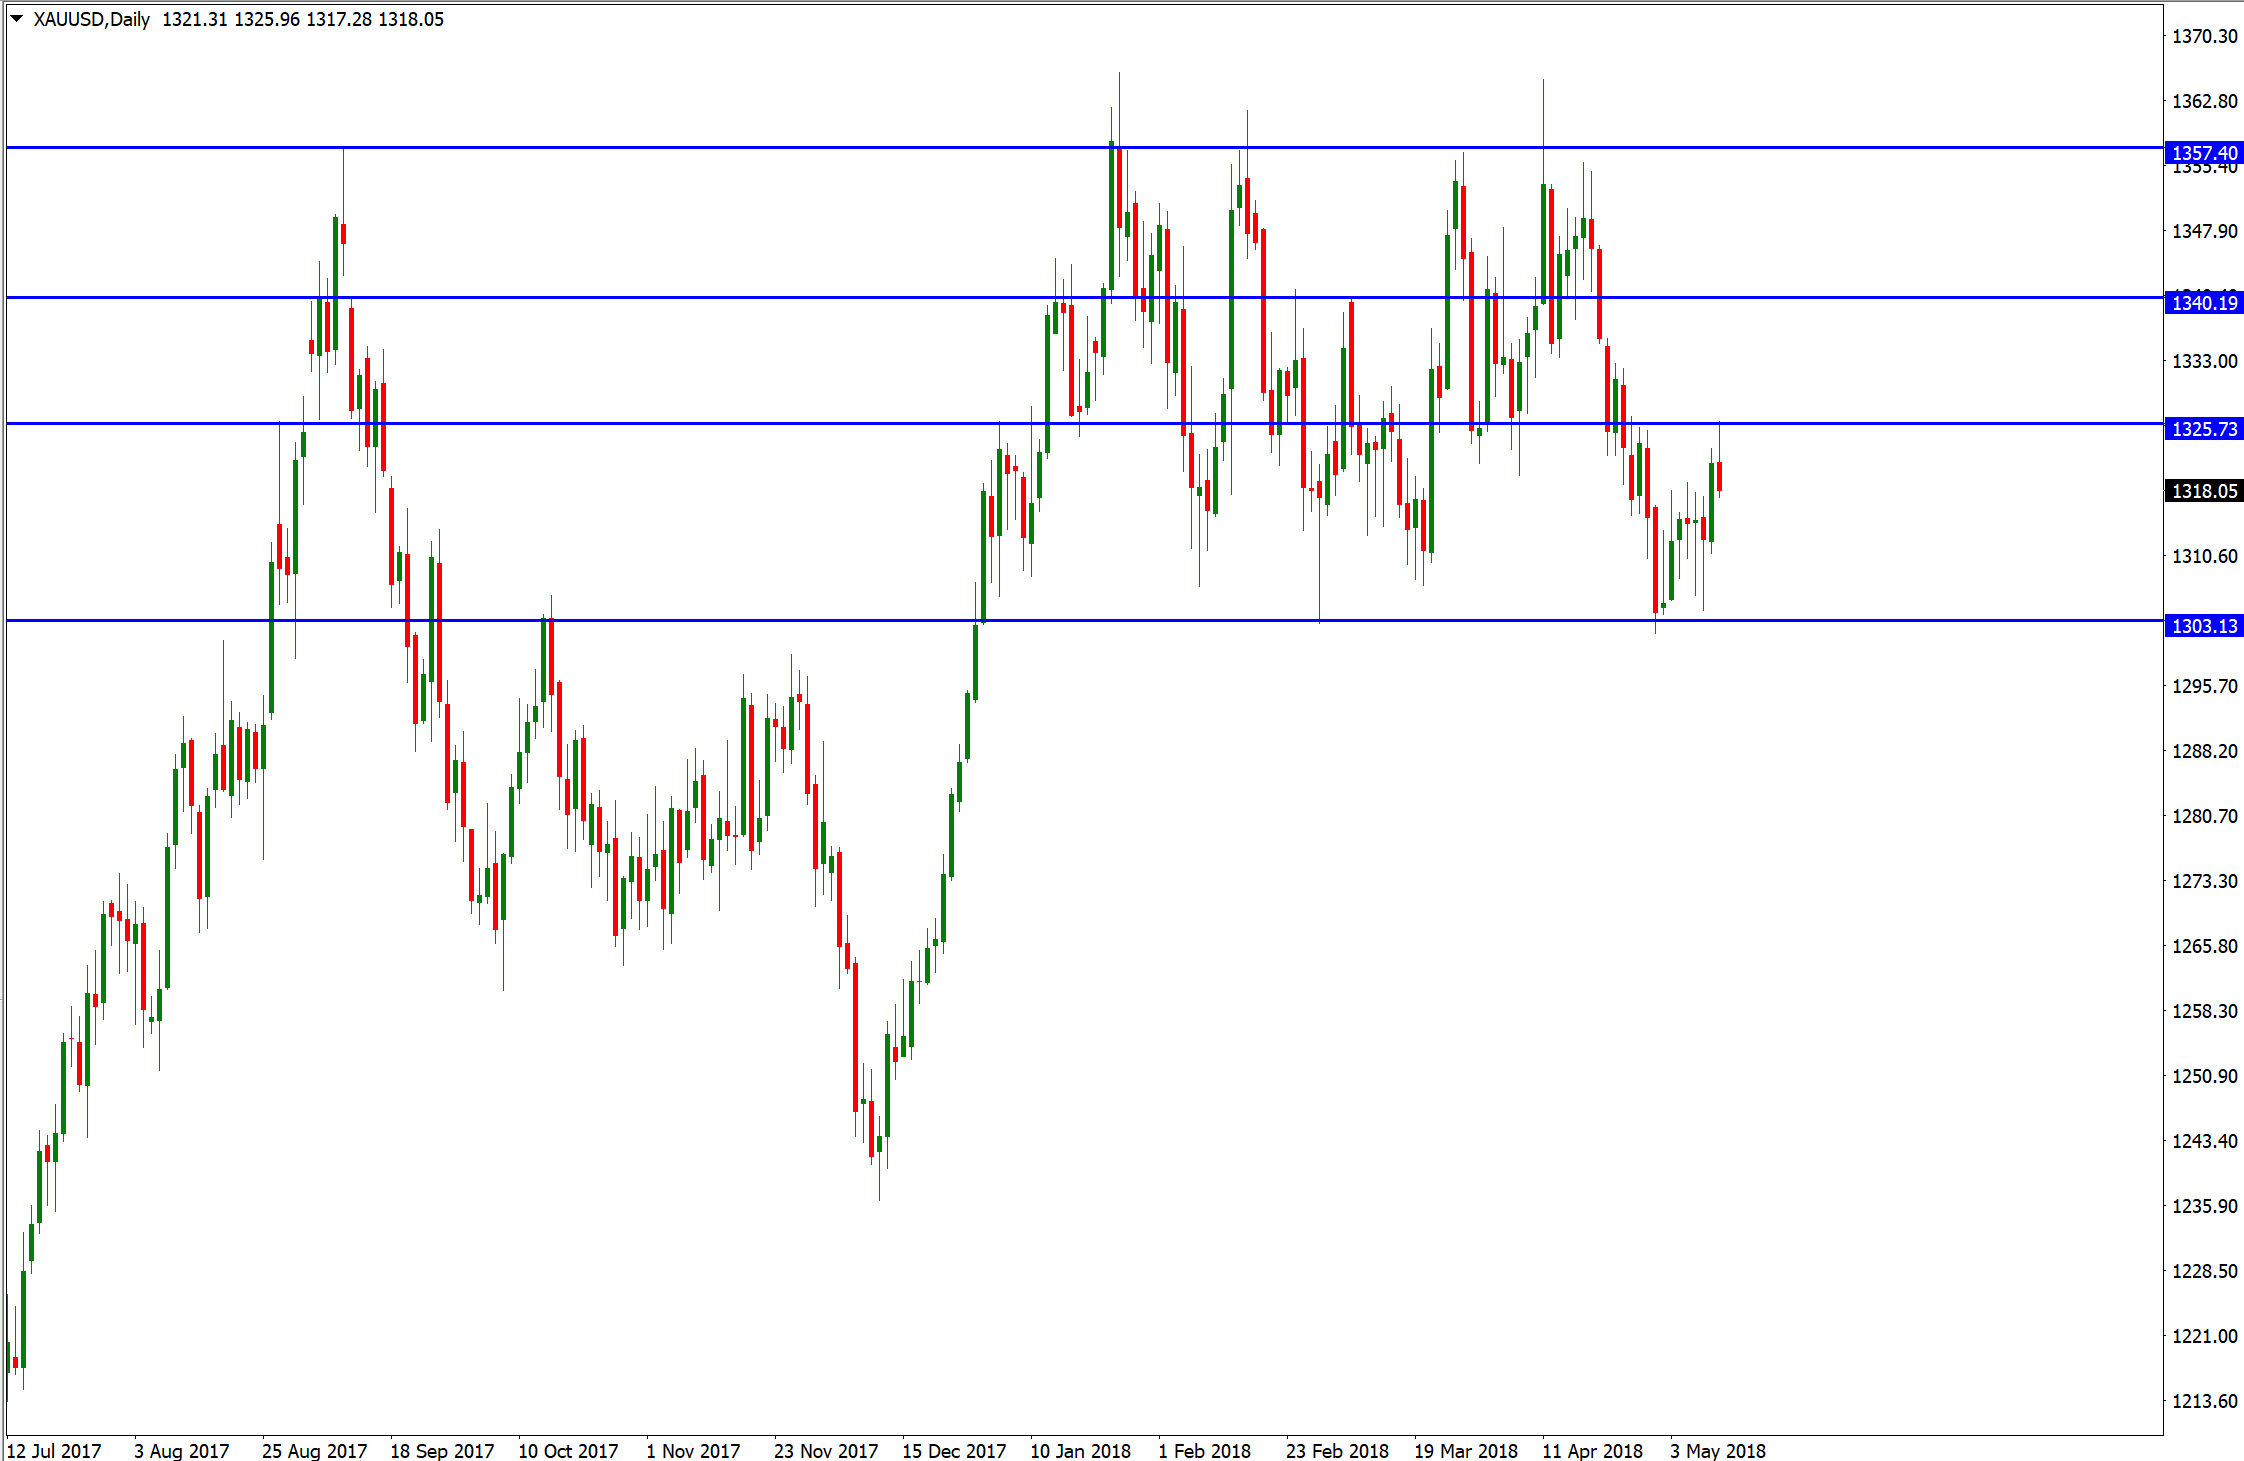
Gold has pulled away from its range base around $1303 as USD bullish pressure eases. Price actions suggest that the range based on $1303 is somewhat exposed, meaning a confirmed break below $1303 would represent a significant technical break for the yellow metal. If alternatively, gold continues to push higher next week, then we would need to consider the possibility of a move towards the top of the range around the $1357 level instead, however, a bit of patience right now is probably the wisest option.
Crude Oil
Crude oil has extended trend gains this week aided by Donald Trump’s decision to pull the US out of the Iran nuclear deal. For now, the ability for this market to hold prices above the $70 level provides an overall bullish technical signal. We all know the current OPEC and Non-OPEC agreement till December 2018, is designed to restrict the supply of oil on a global basis in order to push the price of oil higher. The Saudis, we believe are looking for prices to push to the $80-$85 level so don’t be surprised if we see these prices before the end of the year.

US 10 Year Note
To conclude, this weekly round-up, we should look at what is happening with the US 10-Y note, which has largely consolidated over the last couple of weeks. With yields in the US breaking above the 3% level, we are likely to see the price of the 10-year note push lower at least in the short term. The key bear trigger again is a move below the April low of 118.95, this is a market to watch over the coming weeks.