Categories
Crypto Guides

Cryptocurrency Inheritance – What Happens To Your Cryptos When You Die?

Introduction

Ever imagined what would happen to your cryptocurrency when you die? In the case of land or property, it typically goes to the person’s children or to the ones mentioned by them. And all this happens legally with proper documentation. But it does not work the same way with a person’s cryptocurrency.

In cryptocurrencies, inheritance does exist but is pretty different from the regulated ones. Now, let’s understand the inheritance in cryptos keeping in the sense of the decentralization and anonymous nature of cryptocurrencies.

Though cryptocurrencies are not regulated officially, it does not mean you can let go off the unused coins. They do have value in themselves, and also if converted to fiat currencies. According to estimates, Bitcoins worth $20 billion is already lost and not in use. This could be due to negligence or the death of the owner without anyone’s knowledge that the person had coins in their portfolio.

Furthermore, a Reddit user created a spreadsheet accounting the wallet addresses, which were inactive since the time each Bitcoin was worth below $10. And in 2015, there were more than 3 million Bitcoins that were left untouched.

Ways to Not Let Cryptocurrency Unused

Dead Man’s Switch

In the case of cryptos, there exists a computer program that emails you at specific intervals and waits for your reply. If the program does not receive any reply from the sent email, it then automatically checks for death certificates of the account holder. If it finds such a record and does not receive any email, the program will transfer the coins in the wallet to the specified wallet mentioned by the account holder during the time of set up.

However, there is a downside to it. Even though it is helpful in cryptocurrency inheritance, there can be a scenario when an alive user does not reply to an email, and the computer protocol transfers away from the cryptocurrency to the specified address.

Doing the Traditional Way

This is a technique that does not require any kind of computer technology. This is the simplest inheritance issue where the user writes down all the wallet credentials and hands it over to their beneficiary. The credentials may contain the private key, exchange login detail, and the fiat currency accounts associated with it.

However, storing all the information in one place may not be the ideal option. It could turn out to be a very high price paid just for the convenience. Finally, it all drops down to trust. There must be trust between the account holder and the beneficiary. This is because the beneficiary could tamper with the credentials even before the death of the user. Hence, users must be choosy before handing over the details.

Conclusion

There are several ways to ensure that your coins are not buried with you and are handed over to your loved ones. But, with all of them, there exists a downside to it, which makes you think again on handing away the coins to someone. This has made cryptocurrency inheritance still tricky to deal with.

Categories
Forex Assets

Knowing The Fundamentals Of NZD/USD Currency Pair

Introduction

New Zealand dollar versus the US dollar, in short, is referred to as NZD/USD or NZDUSD. This currency pair is classified as a major currency pair. In NZDUSD, NZD is the base currency, and USD is the quote currency. Trading the NZDUSD is as good as saying, trading the New Zealand dollar, as NZD is the base currency.

Understanding NZD/USD

The value (currency market price) of NZDUSD represents units of USD equivalent to 1 NZD. In layman terms, it is the number of US dollars required to purchase one New Zealand dollar. For example, if the value of NZDUSD is 0.6867, then 0.6867 USD is required to buy one NZD.

NZD/USD Specification

Spread 

The algebraic difference between the bid price and the ask price is called the spread. It depends on the type of execution model provided by the broker.

Spread on ECN: 1

Spread on STP: 1.9

Fees

Similar to spreads, fees also depend on the type of execution model. Usually, there is no fee on the STP model, but there is a small fee on the ECN model. In our analysis, we shall fix the fee to 1 pip.

Slippage

Slippage is the difference between the price asked by the trader for execution and the actual price the trader was executed. Slippage occurs on market orders. It is dependent on the volatility of the market as well as the broker’s execution speed. Slippage has a decent weight on the cost of each trade. More about it shall be discussed in the coming sections.

Trading Range in NZD/USD

The volatility of a currency pair plays a vital role in trading. It is a variable that differs from timeframe to timeframe. Understanding the range (min, avg, max) is essential for a trader, as it is helpful for reducing the cost of each trade.

The volatility gives the measure of how many pips the pair has moved on a particular timeframe. This, in turn, gives the approximate profit or loss on each timeframe. For example, if the volatility of NZDUSD on the 1H timeframe is 10 pips, then one can expect to gain or lose $100 (10 pips x $10 [pip value]) within an hour or two.

Below is a table that depicts the minimum, average, and maximum volatility (pip movement) on different timeframes.

AUD/USD PIP RANGES 

Procedure to assess Pip Ranges

  1. Add the ATR indicator to your chart
  2. Set the period to 1
  3. Add a 200-period SMA to this indicator
  4. Shrink the chart so you can assess a large time period
  5. Select your desired timeframe
  6. Measure the floor level and set this value as the min
  7. Measure the level of the 200-period SMA and set this as the average
  8. Measure the peak levels and set this as Max.

NZD/USD Cost as a Percent of the Trading Range

With the volatility values obtained in the above table, the total cost of each trade is calculated on each timeframe. These values are represented in terms of a percentage. And these percentages will determine during what values of volatility it is ideal to trade with low costs.

The total cost is calculated by adding up the spread, slippage, and trading fee. As a default, we shall keep the slippage at 2 and the trading fee for the ECN model at 1.

ECN Model Account

Spread = 1 | Slippage = 2 | Trading fee = 1

Total cost = Slippage + Spread + Trading Fee = 2 + 1 + 1 = 4

STP Model Account

Spread = 1.9 | Slippage = 2 | Trading fee = 0

Total cost = Slippage + Spread + Trading Fee = 2 + 1.9 + 0 = 3.9

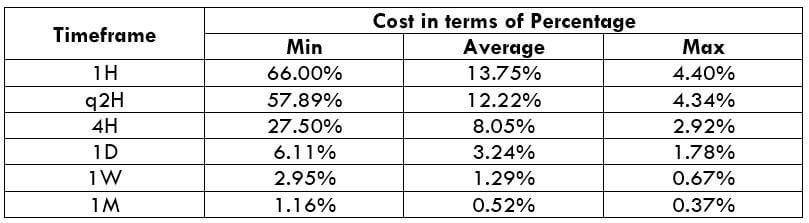
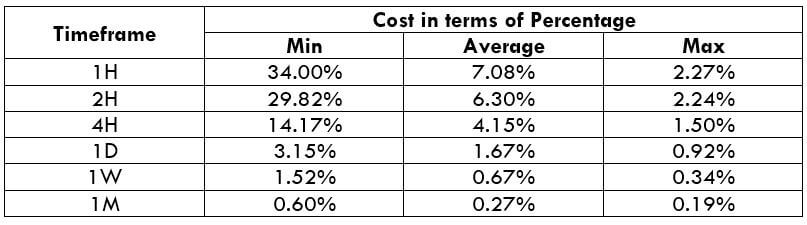
The Ideal Timeframe to Trade NZD/USD

The very first observation that can be made from the above two tables is that the total costs in both the model types are more or less the same. So trading on any one of the two accounts is a fine choice.

From the minimum, average, and maximum column, it can be ascertained that percentages (costs) are the highest on the minimum column of all the timeframes. In simpler terms, when the volatility of the currency pair is very low, the costs are usually on the higher side. Conversely, when the volatility is high, the costs are pretty low. Hence, it is ideal to trade during those times of the day when the volatility of the pair is at or above average. For example, a day trader can trade the 1H timeframe when the volatility of the currency pair is above 8.8 pips. This will hence assure that the costs are pretty low.

Another way to reduce the costs is by nullifying the slippage. This can be done by placing a limit order instead of executing them by a market order. This shall reduce the total costs by a significant percentage. An example of the same is given below.

Total cost = Slippage + Spread + Trading fee = 0 + 1 + 1 = 2

From the above table with nil slippage, it is evident that the costs have reduced by about 50%. Hence, to sum it up, to optimize the cost, it is ideal to trade when the volatility is above average and also enter & exit trades using limit orders rather than market orders.

Categories
Crypto Guides

Beginners Guide to Cryptocurrency Mining

Introduction

There is a significant difference in how cryptocurrencies and fiat currencies are generated and issued to the ecosystem. Fiat currencies are created and printed by the government bodies in response to orders by the state authority. At the same time, cryptocurrencies are issued to the public by going through the blockchain network according to a preset algorithm. There are different schemes assigned for mining, such as the Proof of Work, Proof of Stake, Proof of Authority, etc. These are referred to as consensus algorithms. The in-depth working of these processes is complicated. So, we shall stick on the basic working of it.

Definition

Cryptocurrency mining is the procedure to bring up new coins into the current flowing supply, by verifying the coins through a system. The ones that mine these coins are called miners.

Procedure to Mine Cryptocurrency

  • When a transaction is performed over the blockchain network, i.e., when a user sends coins to another address, the transaction information is recorded and put onto a block.
  • This block must be encrypted and made secure. This is where the miners come in.
  • To encrypt a blockchain, miners solve a complicated cryptographic puzzle to find the appropriate cryptographic hash for the code. For this, miners typically make use of large rigs of application-specific hardware to increase their chances of being the first one to verify and secure the block.
  • Once the block is successfully secured, it is then added to the blockchain, where other nodes on the blockchain network verify it. This verification process is known as consensus.
  • When the block successfully clears through the nodes in the network, the block is officially said to be verified and secured. And for securing a block, the miner is rewarded new-created coins. Hence, the complete above procedure of work is called Proof of Work.

Reward system in Cryptocurrency mining

Mining is a complicated process. Each day, miners commit a thousand watts of electricity towards mining cryptocurrencies. People mine coins though it is an expensive process because they receive a good number of Bitcoins for it, which has value in various markets.

As mentioned above, the reward is released to the miners when they successfully solve a block in the blockchain. The compensation received is pretty decent; in fact, it compensates a thousand watts of electricity. Having that said, the reward cannot be very high, as it could cause an oversupply in the market and depreciate the value of the currency.

Supply and Demand of a Cryptocurrency

Buying and selling cryptocurrencies is different from buying and selling of stocks, bonds, etc. Also, unlike investing in traditional currencies, cryptocurrencies are not issued by the central banks. Therefore, the monetary policy, inflation rates, and other economic factors do not apply to the cryptocurrencies. They are influenced majorly by factors such as the supply of the coins and the demand for it, the number of competing coins, and also the exchanges it trades on.

The supply of cryptocurrencies is impacted by the cryptocurrency protocol, which permits the creation of a new coin (same type) at a fixed rate. A number of coins are introduced into the market when miners verify the blocks of transactions. And the rate at which these new coins are introduced is designed such that it slows down over time. This is done to create a scenario in which the demand for coins increases faster than the supply, which hence causes the prices to shoot up.

Hence we can say that mining & miners have a crucial role in maintaining the supply & demand of any cryptocurrency!

Categories
Forex Assets

Everything You Should Know To Trade The GBP/USD Forex Pair

Introduction

Currency pairs are classified as major, minor, exotic, etc. Major currencies pairs are those pairs that involve the US dollar as one of the currencies. These currencies typically have high liquidity and volatility. GBPUSD is one such example. It is the currency pair where Great Britain Pound is traded against the US dollar.

In this article, we shall be covering all the basic fundamentals which are essential to know before trading this pair. And before getting into the specifications of this pair, let us first understand what actually the price of GBPUSD signifies.

In GBPUSD, GBP is the base currency, and USD is the quote currency. The value (price) of the pair determines the units of USD required to purchase one unit of GBP. For example, if the current value of GBPUSD is 1.3100, then the trader must possess the US $1.3100 to buy 1 Pound.

GBP/USD Specification

Spread

Spread is simply the difference between the bid price and the ask price. The spread depends on the type of account.

Spread on ECN: 0.7

Spread on STP: 1.3

Fees

Again, the fee depends on the type of account. Typically, there is no fee charged by STP accounts. There is a trading fee on ECN account, which depends from broker to broker.

Slippage

Forex is very liquid and volatile. Hence, this causes slippage. Slippage is the difference between the price requested by the trader and the actual price the trader received. And this depends on the broker’s execution speed and volatility of the market. The slippage in major currency pairs is usually within 0.5 and 5 pips.

Trading Range in GBPUSD

As a trader, it is vital to know the number of pips a currency pair moves in a period of time. This is basically the volatility in the currency pair. And volatility is one of the factors which are helpful in risk management.

The volatility is measured in terms of percentage or pips. For example, if the volatility on the 1H timeframe of GBPUSD is 15 pips, then one can expect to gain or lose $150 (15 pip x $10 per pip) within a time period of few fours.

Below is a table that depicts the minimum, average, and maximum volatility (pip movement) on different timeframes.

EUR/USD PIP RANGES

Procedure to assess Pip Ranges

  1. Add the ATR indicator to your chart
  2. Set the period to 1
  3. Add a 200-period SMA to this indicator
  4. Shrink the chart so you can assess a large time period
  5. Select your desired timeframe
  6. Measure the floor level and set this value as the min
  7. Measure the level of the 200-period SMA and set this as the average
  8. Measure the peak levels and set this as Max.

(originally posted in our article here)

GBPUSD Cost as a Percent of the Trading Range

A Forex broker usually levies three type of charges for each trade. They are:

  • Slippage
  • Spread
  • Trading Fee

The sum of all the three costs will generate the total trading cost for one trade.

Total cost = Slippage + Spread + Trading Fee

Note: All costs are in terms of pips.

To bring up an application to the above volatility table, we bind these values with the total cost and find the cost variations (in terms of percentages) on different timeframes. And these percentages prove to be helpful in choosing the right timeframe with minimal costs.

ECN Model Account

Spread = 0.7 | Slippage = 2 | Trading fee = 1

Total cost = Slippage + Spread + Trading Fee = 2 + 0.7 + 1

Total cost = 3.7

STP Model Account

Spread = 1.3 | Slippage = 2 | Trading fee = 0

Total cost = Slippage + Spread + Trading Fee = 2 + 1.3 + 0

Total cost = 3.3

The Ideal Timeframe to Trade GBPUSD

Above are tables that illustrate the cost ranges in terms of percentage. Let us now comprehend the tables and figure out the ideal timeframe to trade this currency pair. From the above table, it is evident that the cost is highest (74% and 66%) in the 1H timeframe when the volatility is low. Hence, it is not ideal to pick the 1H timeframe when the volatility is around 5 pips (minimum).

On the flip side of things, the cost percentages are minimal on the 1M timeframe. Traders with a long term perspective on the market can invest with minimum costs.

Intraday traders, on the other hand, can pick the 1H, 2H, 4H, or the 1D timeframe when the volatility of the market is above average.

Another point to consider is that slippage eats up the costs significantly. So, it is recommended to plan strategies that involve placing of limit orders and not market orders.

As proof, below is a table that clearly shows the reduction in the cost percentages when the slippage is made NIL.

Total cost = Slippage + Spread + Trading fee = 0 + 0.7 + 1

Total cost = 1.7

Comparing these values to the table with slippage=2, it can be ascertained that the cost percentage has reduced by a considerable amount. Hence, all in all, it is ideal to trade by placing limit orders rather than executing at the market price.

Categories
Forex Market

Finding The Optimal Risk % In Forex Trading

Introduction

Calculating risk is one of the most important parts of Money Mangement. Many novice traders or traders with limited experience won’t be aware of the amount of risk they can tolerate. In this article, we shall focus on determining the appropriate risk % that fits your trading style. The goal of risk management is to gain control over three things:

  • Emotions
  • Leverage
  • Sustenance

Furthermore, by limiting the loss per trade, a trader can ensure that his/her trading capital is not wiped out in one single trade. Having this discipline systematically reduces the loss per trade and provides an opportunity for the trader to re-look at the situation.

Calculating the risk

One can determine the risk based on the following factors:

Win rate

Win rate refers to how often a trader takes profitable trades relative to the trades that result in a loss. Win rate is determined by using the risk-to-reward ratio (RRR) and is calculated by the following formula.

Win rate = 1/(1+RRR)

The above-given formula is also referred to as the Minimum win rate. If any trader is trading with an RRR of 1, then his/her minimum win rate will be 50%. So out of 100 trades, we require a minimum of 50 trades to end as winners to compensate for the losing trades.

This will help a trader in deciding their maximum risk based on the win rate. This formula can also determine if a trade can be taken or not. For example, if someone has a win rate of 25%, he/she will not be able to take trades that have a risk-to-reward ratio of less than 3.

Nature of the market

Depending on the market situation, the risk can vary substantially. In a trending market, like the one in the below chart, risk should be reduced as much as possible by using a stop-loss order. We are recommending this idea as you would most probably be trend trading, and there is no point in risking more than the usual (can be lesser).

Trending Market

In a market that is trapped in a range (below image), the risk is always higher. This means anyone who trades the consolidation market is essentially increasing their risk. This would mean increasing the stop-loss, thereby reducing the risk-to-reward ratio (RRR) of the trade.

Ranging Market

Maintaining a risk of 1% constantly, regardless of the market conditions, will help the traders to sustain the loses and stay in the game even after a series of losing trades. This is a conservative method that reaps fewer rewards, but the risk is certain.

Conclusion

The aim is to achieve some level of consistency in trading by allowing yourself and your trading strategy to fight the evil forces of the market. We would say in all circumstances, a max risk of 1% appears to be the winner if you are a conservative trader. When the risk increases, it is said to impact not only the capital of the trading account but also the psychology of a trader. Hence it is better to keep risk at a bare minimum in times of uncertainty.

Categories
Crypto Guides

Understanding The Basics Of ‘Ethereum’ – A Revolutionary Cryptocurrency

Introduction

The most talked-about cryptocurrency after Bitcoin is Ether. Ether is second in market capitalization after Bitcoin. While the Bitcoin network is only about minting Bitcoins using the POW consensus algorithm, the Ethereum platform is much more than just the cryptocurrency that the network helps in minting. Vitalik Buterin developed the Ethereum platform by taking inspiration from Bitcoin whitepaper. He wants Ethereum to be something called ‘World Computer.’

Objective

The worldwide web(www), which came into existence with the advent of the internet, transformed our lives completely. To login to different websites, we store our email id’s and passwords in various machines, though the devices may be personal. Still, the credential information is stored in the servers of different websites around the world. Hackers make these servers as targets and steal our information, which results in a breathtaking loss. Hence Ethereum’s goal is to protect user’s data. Ethereum wants to disrupt the client-server model by using thousands of nodes across the globe run by individual volunteers.

Ether

So, where does Ether come into picture amidst all this? It is the cryptocurrency of the Ethereum platform. Ether is generated when each block of transactions gets added to the existing blocks in the Ethereum network. The number of coins made every year is a fixed amount as per the determination of the network. By now, we understand that the Ethereum platform offers decentralized internet or DApps – decentralized apps. As the services cannot be taken free of cost, Ether also helps in fueling the performance of these apps. To perform any transactions in the decentralized apps functioning on the Ethereum platform, one must pay in Ether. The transaction fees are also called as gas as it is the fuel to perform transactions.

Market Capitalization 

Ether is traded under the name of ETH in cryptocurrency exchanges. Each Ether costs about $172.49, while the market cap of Ethereum is around 18 billion dollars. The 24-hour trading volume is approximately 7 billion dollars.

Consensus Used

Consensus algorithms are the backbone of any blockchain network. Bitcoin and Ethereum both use Proof of Work (POW) as a consensus algorithm today. But Ethereum aims to move to Proof of Stake (POS) as POW is very costly concerning the power consumption and computational resources consumption as well. Ethereum hard fork is impending where the significant change is going to be the switch from POW to POS.

Price History

Ether started with zero price on July 30, 2015. 2016 was a slow-growth year for ETH, while 2017 saw tremendous gains beginning from the start of the year itself. By December 2017, the price was around $800. By January 2018, it achieved its highest rate ever with 1,261.03 dollars. A severe downfall has been seen in the same year; by June, it halved the value to $531.15 by December; it even reduced to $141.33. 2019 has been somewhat stable year compared to the previous years. In July 2019, the price was around $300, and at present, the price is at $172.49.

Conclusion

While Bitcoin has given birth to the concept of cryptocurrency, Ethereum went a bit ahead and explored the true potential of blockchain technology with decentralized apps. After Bitcoin, Ethereum is the next go-to cryptocurrency concerning any measure one can check. Ether price has been kind of stable this year, and investors can hold on to it for the long term as the hard fork of the Ethereum is only going to make the coin even better. Stay tuned for more informative content on individual cryptos.

Categories
Forex Market

Trading Energy Commodities – Crude Oil, Coal & Natural Gas

Introduction

Energy belongs to that category of commodities, which has the most significant impact on our daily lives. Energy prices affect the cost of almost everything that we consume on a daily basis, including the clothes we wear, the fuel we put in our cars, and the electronic gadgets. They, in turn, determine the increase or decrease in the prices of homes, hospitals, schools, etc. We cannot imagine ourselves in a world without energy.

The unit that is used to define the quantities of energy is the British thermal unit (Btu), which measures the heat content of fuels. According to the Energy Information Agency (EIA), every year, worldwide energy consumption exceeds 575 quadrillions Btu and is expected to reach 736 quadrillions by 2040.

Major energy commodities

Highly traded energy commodities are from non-renewable energy sources, except for ethanol and electricity generation. These commodities are very liquid when it comes to trading. Traders can also invest in these commodities through ETFs and CFDs.

Crude oil

Crude oil is one of the most actively traded commodities in the world. The price of crude oil affects many other commodities, including natural gas and gasoline. Crude oil comes in different grades. Light Crude oil is traded on the New York Mercantile Exchange (NYMEX). This type of crude oil is popular because it is the easiest to distill into other products. The next grade of oil is Brent Crude oil, which is primarily traded in London and is seeing the increasing interest. The last grade of oil is the West Texas Intermediate (WTI) oil from U.S. wells. The product is light and sweet and is ideal for making gasoline. The reports for crude oil are found in the U.S. Energy Information Administration (EIA) reports. This report is released every Wednesday around 10:30 PM ET. Traders take investment decisions based on the data of this report.

Coal

Coal is a fossil fuel that is formed from dead plant matter trapped between rock deposits. Coal is used as an energy source for hundreds of years. This mineral generates 41% of the global supply of electricity and plays a crucial role in other industries. The top 5 coal-producing countries are China, the USA, India, Australia, and New Zealand.

Natural gas

Natural gas is formed either by methane-releasing microorganisms in swamps or by pressurizing organic material deep underground. Three major reserves for natural gas are Canada, USA, and Russia. This commodity has many applications, from electricity generation to fertilizers. Natural gas futures and ETFs are available for traders and investors. The price of natural gas depends on the demand and supply of the commodity itself.

Energy commodities can also be traded through Forex Brokers these days. Many of the credible and regulated and unregulated Foreign exchange brokers allow their customers to trade all the major energy commodities like Crude Oil, Coal, and Natural Gas.

Factors affecting the prices of energy commodities

  • Market growth
  • Energy efficiency
  • Population growth
  • Electricity penetration
  • Industrialization in developing economies

Conclusion

Investors who want to invest in the energy sector should track the indices of that sector. These indices measure the production and sale of energy. One can also monitor the performance of energy company shares prices. Energy company’s revenue depends on the price of the commodity they are selling. Other factors include production costs, competition, and interest rates. That’s about Energy commodity. Cheers!

Categories
Forex Market

What Should You Know About Trading Metals?

Introduction

We have discussed metal commodities briefly in the previous article. In this article, let’s understand trading metals in detail. Trading precious metals were only possible by wealthy investors in earlier days. But now, every retail forex trader gets to trade these metals with the advent of CFD trading. Hence, a lot of investors hold metals in their portfolios by investing a significant chunk of their money in metals. Metals create a balanced portfolio as they are considered a hedge against inflation. Metals such as gold and silver can be treated as safe-haven bets since their scarcity provides support to their value.

Gold – The highly traded metal

Among all the metals, Gold is the most actively traded metal. This metal possesses intrinsic properties such as durability, malleability, and conductivity. These properties offered by gold account for its superiority. They also find their primary use in jewelry making. As with other commodities, forces of demand and supply determine prices of gold. The gold market is also influenced by risk parameters, market sentiment, and inflation trends. Investors turn to gold and invest heavily when there are signs of a global economic slowdown. The slowdown could be due to reasons like recession, political crisis, or government debt.

Because of these reasons, Gold is mostly traded by long term investors. They only look for signs of gold entering a bull or bear market. The trend can be determined with the help of equity indices. A strengthening economy means weaker demand for gold.

Silver

Silver is seen as the best metal trading option right after gold. It has its own merits. This metal is used in various industries, making it more sensitive to business conditions and trading activities. Hence, the prices of silver are more volatile than that of gold. So we can say that silver is ideal for short term traders.

Platinum

Platinum is also seen to gain value during times of economic and financial crisis. However, because of scarcity in the availability of platinum, the price is much higher compared to gold. Therefore it is less frequently traded. It still is a robust and safe-haven alternative, especially when the Gold is overbought in the market. The industrial use of Platinum is kind of similar to that of silver, making it price-sensitive to business conditions. In recent times, the demand for platinum in industrial usage is reduced by the increased use of catalytic converters.

You can trade metals with Forex brokers too

One of the important advantages of trading metals is that they give protection against inflation, which is not offered by any other financial instrument. Taking this into consideration, a lot of Forex brokers offer above mentioned precious metal trading against major currencies such as the US dollar, Japanese yen, Euro, Australian dollar, Canadian dollar, and British pound. You will also find metals such as Copper and Palladium on their platform. Some of the metal currency pairs include XAU/USD (Gold), XAG/USD (Silver) and XPT/USD (Platinum).

Conclusion

Even if it obvious, we must tell you that buying and selling precious metals do not mean the actual delivery of these commodities. We trade these metals over the counter (OTC). In this type of trading, there is high risk involved. So make sure you have a risk management plan in place, else there is a possibility of you losing all the money you have in your trading account. Some vital risk management tools include stop-loss and order cancellation. They will always protect the balance of your account.

Categories
Forex Market

Contract For Difference (CFDs) Explained!

What is CFD?

A contract for difference (CFD) is a form of derivative trading. CFD allows a trader to speculate on prices of global financial markets such as shares, indices, commodities, and of course, currencies. While trading CFDs, a trader gets to bet on both upside and downside movements of the market. The profit and loss for CFD are calculated by taking the difference between the entry and exit prices and multiplying it by the number of units. CFDs always comes with an expiration date, before which you need to close your position. Trading these CFDs may appear sophisticated and complex in the beginning, but once you start trading them, it becomes easy to handle.

Leverage trading CFDs

CFDs are a leveraged product, which means a trader needs to maintain an optimum level of capital in their trading account to execute a trade. As it is leverage/margin trading, this capital can only be a small percentage of the full position’s value. While margin trading allows a trader to magnify their returns, losses will also be more as a trader will lose leverage times the capital he is betting on. Hence it is always recommended to go for less leverage. If you are a novice trader, we suggest you not to go beyond 2X leverage. And obviously, the gains and losses will be based on the value of a CFD contract.

Costs involved while trading CFDs

There are three types of costs a trader may incur while trading CFDs. Each of them is explained below.

Holding cost – At the end of each trading day (mostly at 5 PM New York time), if the positions are open in your account, it will be subject to a charge called ‘holding cost.’ Holding costs will depend on the CFD, direction of the position, and the holding rate.

Spread – CFDs always come with a spread, which is the difference between the buy and sell price. This price is decided by the broker, and it varies from broker to broker. A trader will have to enter a buy trade at the buy price quoted by the broker, and exit using the broker quoted sell price. The narrower the spread, the less the price needs to move in trader’s favor for their profits to start. These spreads are extremely competitive across all the brokers.

Market data charges – For getting live market feed and accurate prices, a trader must pay the relevant market data subscription fees. However, this fee is mostly applicable to stock CDFs and varies from broker to broker.

Things to remember

Like any other market, there are high risks involved in trading CFDs as well. CFDs are complex in nature (at least for novice traders), they carry a high risk, so it is important to do your research before you start trading. Also, since CFDs are leveraged products, losses can easily exceed your total investment. In volatile markets, your account balance can drop down to zero or even to a negative balance in no time. Following best trading practices like proper applying risk management to your trades will increase the chances of profiting.

We hope you find this article informative. Let us know if you have any questions in the comments below. Cheers!

Categories
Crypto Guides

The Evolution & Properties Of Cryptocurrency!

Introduction

We could say that the type of currencies we use today is employed as a medium of exchange for goods and services. In the olden days, transactions used to happen in the barter system. Barter system implies that goods are exchanged for goods. With this system, it took time to trade products and services as it is challenging to find people to accept their goods for the goods they want. Hence came the era of coins in gold or some other metal with a denomination printed on it. As some standard is associated with it, the trading of goods and services has become easy. Then came the paper notes making it easy to carry large amounts of cash, which was not possible with coins. We are this point where these paper notes are known as currencies. Each country has its respective currency (The US Dollar, Japanese Yen, Indian Rupee, etc.)

Evolution Of Cryptocurrency

Even though the purpose of the money didn’t change much, the way we use it kept changing throughout history. Banks came into existence to ease out the financial transactions. They played a significant role in global trade in terms of transferring money across different countries, thus improving the economy of each country. Physically minted cash would be less than 10% of the entire currency in the world. Remaining exists in the form of virtual currency as electronic money in online accounts. Central banks in each country control these accounts. Since power is vested within these financial institutions, the entire banking process is centralized. Hence the necessity of an alternative currency has emerged. These are termed as cryptocurrencies, and the primary purpose of their invention is to create a decentralized currency system where the entire network is not controlled by anyone at all.

What Are Cryptocurrencies?

Cryptocurrencies are digital or virtual currencies where cryptographic techniques are used to generate the units of currency and monitor the transfer of funds without a central bank. Thus, making it a decentralized way of producing and using money.

Cryptocurrencies are generated by using a blockchain platform that uses distributed ledger technology. The first-ever cryptocurrency that has come into existence is The Bitcoin in 2009, though the white paper related to this concept was released in October of 2008. Thus, 2009 signals the beginning of the era of cryptocurrency. There has been no looking back since then.

Properties Of Cryptocurrency

The three fundamental features of cryptocurrencies are Trustlessness, Immutability, and Decentralization. Let us understand these properties using the example of Bitcoin.

Trustless

Though the word trustless creates confusion to the readers, it merely means there is no need not trust anyone or anything to send or accept a cryptocurrency. If we say an environment is trustless, that means there is no need for you to trust anyone in the network. The Bitcoin network is a trustless environment. There was no currency before Bitcoin that was not monitored by a central bank. Every node in the blockchain network has a copy of the ledger; thus, there is no need to trust any authority.

Immutability

Immutability means that it cannot be undone. It is highly improbable to rewrite the history of the transactions in Bitcoin blockchain. Since all the transactions are recorded in the blockchain, the cryptographic techniques make it highly impossible to change any transactions. If any fraudulent transactions happen in the case of our bank accounts, the banks have the authority to change the transaction. But in the case of cryptocurrency, it is not possible. Thus, removing the concept of centralization and trust from these digital currencies.

Decentralization

It is the keyword when it comes to cryptocurrencies. Decentralization offers different types of tolerances. Tolerance concerning the infrastructure, component failures, hacking, and collusions. In the Bitcoin network, the ledger where the transactions are recorded is distributed among every node in the network. Any component failures don’t cause any problem to the functioning of the network. Hacking the blockchain is extremely difficult and a costly process. When it comes to traditional banking, individual entities can collide with each other to make profits at the expense of loss to others. This plot is not possible in the case of a cryptocurrency network, thus offering tolerance to collusion. Apart from all of these, there are many more advantages of a decentralized system over a centralized banking network.

Bottom Line

Therefore, Cryptocurrencies offer plenty of opportunities in today’s digital world, which traditional currency couldn’t provide. We will be further discussing the purpose of cryptocurrency and more properties of cryptocurrency in our upcoming articles. Stay Tuned. Cheers!