Categories
Forex Basic Strategies

Forex Momentum Trading Using The ‘Momo Strategy’

Introduction

Some traders are extremely patient and wait for the perfect setup while others are extremely impatient and need to see a move in the next few minutes or hours or else, they are quick to hit the button for a ‘sell’ or a ‘buy.’ Most of the time, these impatient traders are chasing the market and necessarily take action when the market has already moved in one direction.

In other words, if they see that momentum builds in one direction, they piggyback on the momentum in hopes for an extension move as momentum continues to build. Once the ‘move’ starts showing signs of losing strength, these impatient momentum traders will also be the first to jump the ship.

So, if our strategy is based on momentum, we need to have solid rules for ‘entry’ and ‘exit’ to protect profits. At the same time, we should be able to do trade management to ride as much of the extension move as possible.

In this regard, we have developed a great momentum strategy that we call the ‘Momo’ trading strategy because we look for momentum or momo burst on very short term price charts.

Time Frame

The ‘momo’ trading strategy works well on the 5-minute time frame. This means each candle represents 5 minutes of price movement.

Indicators

We lay two indicators on the chart, the first one of which is 20-period EMA. The second indicator that we use is the MACD histogram. The settings for the MACD histogram is the default, where the first EMA = 12, second EMA = 26, and signal EMA = 9. All of these are based on the closing price of the candle.

Currency Pairs

This strategy applies only to the major currency pairs. Some of these include EUR/USD, USD/JPY, GBP/USD, GBP/JPY, USD/CAD, etc.

Strategy Concept

We use the Exponential Moving Average (EMA) to help us determine the trend of the market. Once the trend has been established, we use the second indicator to gauge the momentum of the move. We essentially wait for a reversal in the market, and then we try to take position only if the momentum supports the reversal move enough to create a large extension burst.

The position is exited in two segments, and the first half helps us lock some gains and ensures that a winner does not turn into a loser. The second ‘take-profit‘ attempts to catch what could become very large with less risk since we have already booked some profits earlier.

Trade Setup

In order to illustrate the strategy, we have considered the chart of EUR/USD, where we shall be applying the strategy to initiate a trade. All the steps will be performed on the 5-minutes time frame.

Step 1

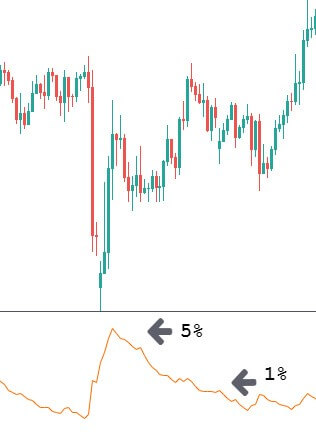
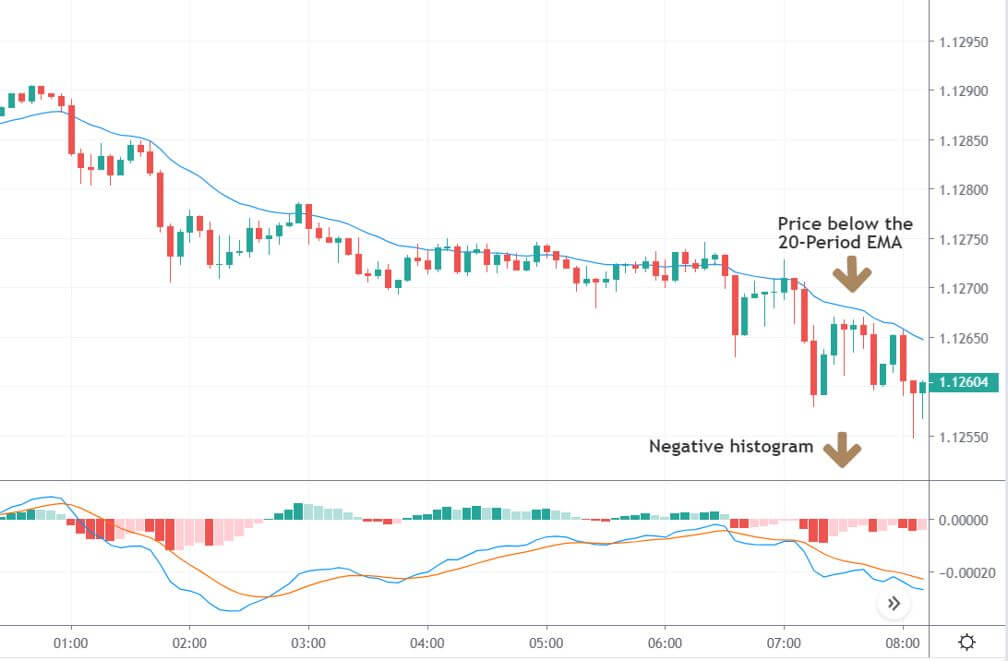
Open a 5-minutes time frame chart of the desired currency pair and plot the 20-period EMA on the chart. Along with this also plot the MACD indicator on the chart. After plotting both the indicators, look for the currency pair to be trading below the 20-period EMA. The MACD histogram should be negative during this time period.

In the below image, we can see that the market is in a strong downtrend, and currently, the price may be overextended to the downside as indicated by the two indicators.

Step 2

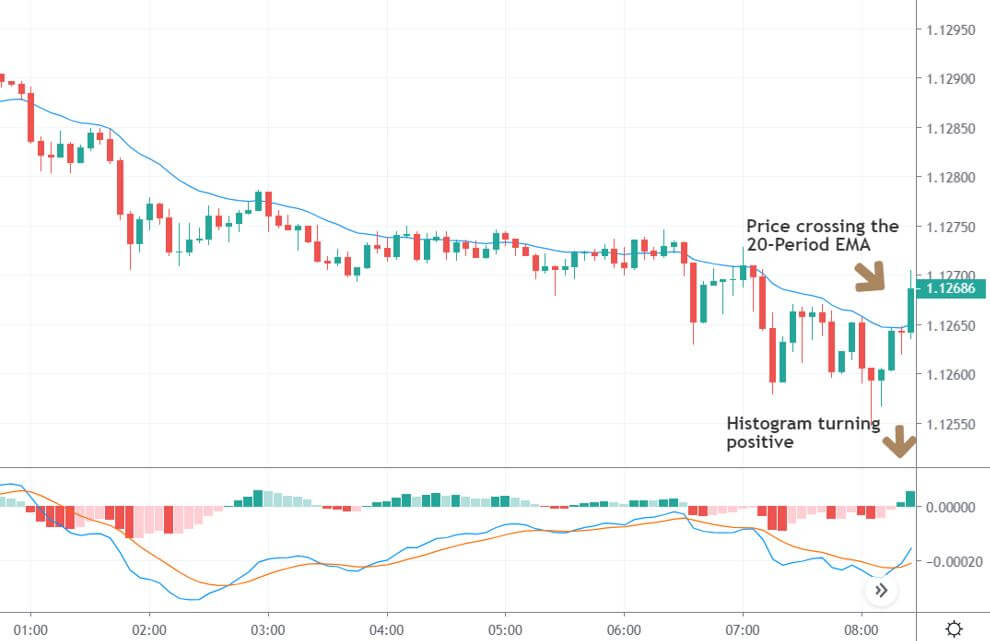
Next, we need to wait for the price to cross above the 20-period EMA. When the price crosses the EMA, we need to make sure that the MACD is in the process of crossing from negative to positive or is in the positive territory no longer than 5 bars ago (in case of a downtrend reversal). The fulling of both these criteria together is a very strong sign of a reversal in the market. The two indicators combined together are very useful for identifying reversal in the market.

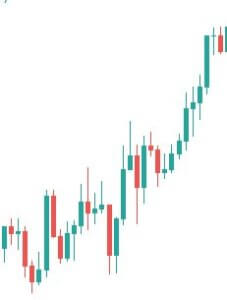
The below image shows the crossing of the price above the EMA with a single bullish candle, and, at the same time, the histogram also turns positive.

Step 3

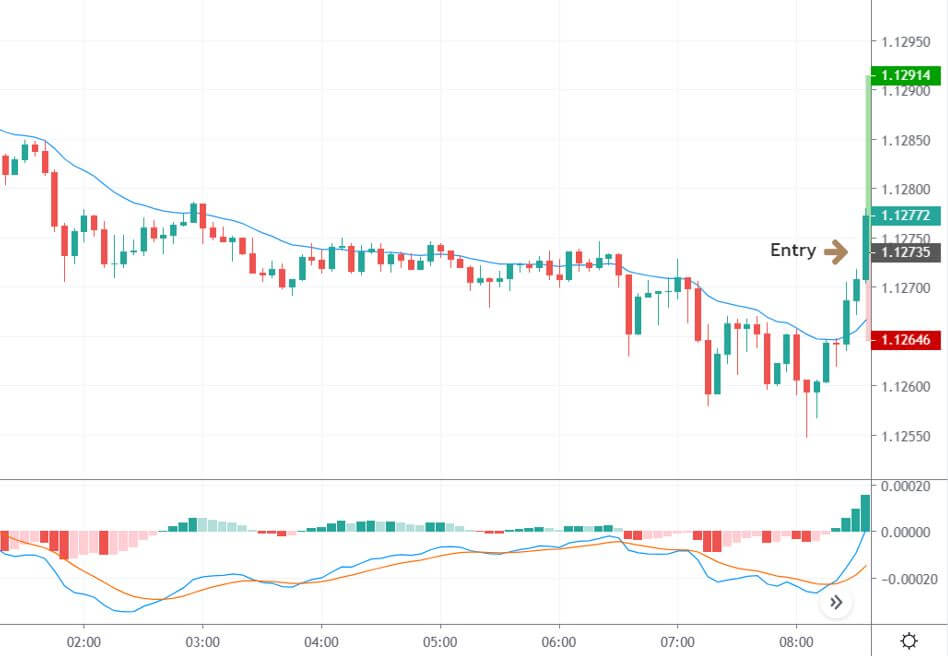
We enter the market for a ‘buy’ or ‘sell’ after the market moves at least ten pips above or below the EMA. This is an aggressive form of ‘entry’ which may not be suitable for everyone. The conservative way of taking an ‘entry’ is by waiting for the market to re-test the EMA and then enter at the retracement. But if the momentum is strong, the market might just continue moving higher. In these times, traders who entered aggressively will only make money. It all depends on the nature of the trader.

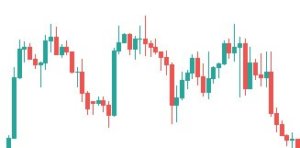
As we can see in the below image, we have taken an aggressive ‘entry’ in the pair, i.e., exactly at ten pips from the point of crossing of the EMA. The histogram also shows that the momentum is building on the upside.

Step 4

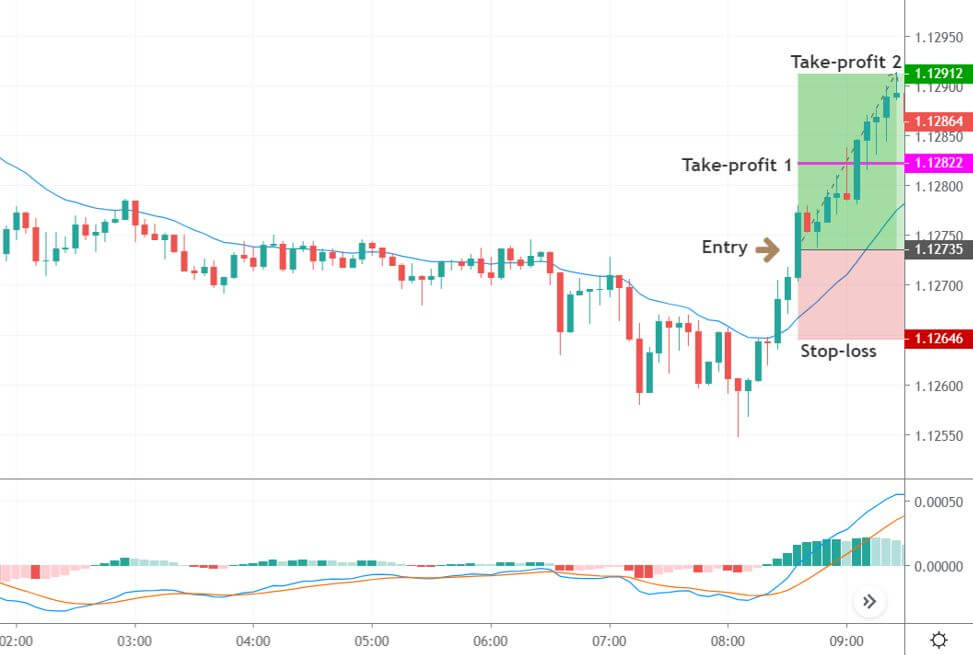
In this step, we will determine the stop-loss and take-profit for the strategy. As mentioned before, the first take-profit is set at 1:1 risk to reward, which ensures we don’t lose money if the market turns around from the middle. The second and final take-profit is set at 1:2 risk to reward, to take advantage of the market momentum, which leads to an extended reversal. The stop-loss is set just a little below or above the EMA, which will be about 10-15 pips. A conservative trader can place the stop-loss below the ‘low’ or above the ‘high’ from where the market reverses.

We can see in the below image that the momentum continues to build on the upside (indicate by histogram), which is why the market moves smoothly to our final take-profit after we enter.

Strategy Roundup

As this is a momentum-based strategy, we can also use trailing stop-loss to capture gains of the new trend. Since liquidity is the basic requirement of the strategy, we recommended using this strategy in pairs like EUR/USD, GBP/USD, USD/JPY, and some other major pairs only. The ‘momo’ trading strategy is a powerful strategy to capture momentum-based reversal moves. However, sometimes it may not work, and it is important to figure out why it failed.

Categories
Forex Basic Strategies

Scaling Positions Using The Pyramid Trading Strategy

Introduction

You would have heard most of the successful traders and market gurus say ‘let your winning trades run.’ That is very true, but do you know how to do that? You would have probably asked this to yourself many times. In today’s article, let’s understand a strategy that helps you in turning your small trades to big ones using a strategy called Pyramiding.

This Forex Pyramid Strategy helps you in increasing the chances of making consistent returns as a Forex trader. Using this strategy, we can scale our winning position and make the most of the trend. This strategy cannot be used in every market situation. If you do that, it will be the most destructive thing you do to your trading account.

Pyramiding our trades work very well in trending market conditions only. To make consistent returns from the market, we need to buy or sell strategically to add to an existing position. Always remember that when we are right, we must be really right, and when we are wrong, we must cut our trades immediately. The concept of this strategy can be applied to both long and short positions.

We can get a basic idea of the pyramid strategy from the below image. Here, we can see the price action printing brand new higher highs and lower highs continuously. The market is clearly breaking the resistance line and taking that line as a support. Note that the price action must break the resistance line with strong power. The price should also show the sign of holding at the support line.

The key to successful Pyramiding is to have a proper risk to reward ratio in place. That means our risk should never be greater than the reward. So if our target is 50 pips, our stop-loss must not be greater than the 25 pips.

Rules to Trade the Pyramid Strategy

🏁 Pick a market that is in a strong uptrend and wait for the price action to break the significant resistance area. Let the price test that resistance line as support.

🏁 Go long when the market gives you a buy signal. You can even look out for the appearance of any bullish candlestick patterns like Engulfing, Dragonfly, or a Bullish pin bar, etc.

🏁 Let that trade run because the market is in a strong uptrend.

🏁 Then wait for the price to break through the second resistance line and retest it as strong support.

🏁 Notice if the price is holding at the support line, and if it prints any buying candlestick pattern, go long again by extending your buy position. Make sure to trail your stop-loss after taking the second position.

🏁 Repeat the same, and do not forget to place your trailing stop-loss orders just below the entry points.

The same is vice-versa when the market is in a downtrend and when we are going short. By following this, we have built a good amount of buying position with minimum risk involved. Also, as discussed, the key to successful Pyramiding is to maintain proper risk to reward in each of the trades. As a thumb rule, our risk must never be greater than half the potential reward.

Trading The Pyramid Strategy

Market Identification - Strong Uptrend or Downtrend.

The below price chart represents the AUD/CAD Forex pair, which is in a strong uptrend.

To understand the strategy better, let’s consider a $10,000 trading account. In this particular pair, we decided to buy two mini lots on a retest of each of the levels. The take-profit for each trade is varied as per the market conditions, but the stop-loss for each new position should not be more than 15 pips.

Market Entries

In the below chart, we can see the market broke through a resistance level. We have decided to buy 20,000 units right after the price took the broken resistance line as support. In a few hours, we have observed the price action blasting to the north and broke a new resistance level. The price again started to retest the level as new support.

At this point, we decided to buy 20,000 more units. You can see that the buy order 2 in the below chart indicates the second trade, and we have trailed the stop-loss below the second position. We found the trend to be super strong still, so we let this trade to run for the deeper targets.

On the 5th of February, the price again broke through a new resistance level and retests as a support area. By seeing the uptrend’s strength, we have bought another 20,000 units and placed the trailing stop-loss order just below the third position.

We did a lot of buying up until this point and built 80,000 units in one single pair. So the real question by the end of the third position is how much of our money is at risk? Nothing. The worst-case scenario would be us making 10% profit by the end of the third position.

Final Trade Set-Up

In the above chart, we can see the final trade setup of all the three trades we took. By the end of all the three trades, we made a profit of 28 percent. The profits on each of the trades have compounded throughout the process, where the risk in each trade remains the same. Overall, we have generated 12R, 10R, and 6R in the first second and third trades, respectively.

Conclusion

Never forget that the pyramid strategy works very well only in the trending markets. Also, try to avoid using this strategy in volatile markets. Pyramiding is a great way to compound our profits in a winning trade. Knowing when to use and when not to use the pyramid strategy is the crux here. Hence it is advisable to read the different market situations on a demo account first before using this strategy on a live account.

Categories
Forex Market Forex Risk Management

These Are Some Of The Best Position Sizing Techniques You Should Know!

Introduction

In our previous article, we addressed the concept of position sizing, drawdown, and techniques. Now we extend this discussion and look at other crucial aspects of position sizing, which are very important. In this article, let’s determine how one can position themselves in the forex market based on three different models. Each of these has its own merits that impose some sort of position sizing discipline in traders.

The three core position sizing techniques in terms of risk are:

  • Fixed lot per amount
  • Percentage margin
  • Degree of volatility

These models can be applied to all the asset classes and are time frame independent.

We suggest you stick to one model to estimate the position size or at most two position sizing techniques. Following every given method will increase complexity, and that is not good for a trader.

Fixed Lot Per Amount

This is a fairly simple model. It requires a trader to simply state how many lots he is willing to trade for a given amount of capital. For example, let us assume a trader is having $2000 in his trading account, and he trades only the major currency pairs like  EUR/USD, GBP/USD, GBP/JPY, USD/JPY, etc.

The trader simply needs to make a thumb rule that he/she will not trade more than one standard lot of futures (of major currency pairs) per $2000 at any given point.

The lot size can also be determined based on their risk appetite and money management principles. This technique of ‘fixed risk’ is based more on the discipline than strategy.

Percentage Margin

This position sizing technique is more structured than the ‘Fixed lot per amount’ technique, especially for intraday traders. It requires a trader to position themself based on the margin. Here, a trader essentially fixes an ‘X’ percentage of their capital as margin amount to any particular trade. Let’s see how this works with the help of an example.

Assume a trader named Tim has a trading capital of $5000; with this, he decides not to expose more than 20% as margin amount on a particular trade. This translates to a capital of $1000 per trade.

Now, if Tim gets an opportunity in another currency pair, he would be forced to let go of this margin as it would double to 40% (20% + 20%). This new opportunity will be out of his trading universe until and unless he increases his trading capital. Hence, one should not randomly increase the margin to accommodate opportunities.

The percentage margin ensures a trader pays roughly the same margin to all positions irrespective of the forex pair and volatility. Otherwise, they would end up in risky bets and therefore altering the entire risk profile of their account.

Degree Of Volatility

The degree of volatility accounts for the volatility of the underlying asset. To measure volatility, we make use of the ATR indicator, as suggested by Van Tharp. This position sizing technique defines the maximum amount of volatility exposure one can assume for the given trading capital.

Below we have plotted the ATR indicator on to the USD/JPY forex chart.

The 14-day ATR has a peak and then a decline, which shows a decrease in volatility. As you know that high volatility conditions are the best times to trade (less slippage, high liquidity, etc.), you can risk up to 5% of your trading capital on the trade while one should not risk more than 1% when the ATR is at the lowest point. Do not forget the risks involved while trading highly volatile markets. Only use this position sizing technique when you completely trust your trading strategy.

Conclusion

A trader should not risk too much on any trade, especially if their trading capital is small. Remember, your odds of making a profit are high when you manage your position size and risk the right amount on each of the trade you take.

Beginners should trade thin to get experience with open positions, so they can assess the stress of a loss and gradually increase the position size as he is comfortable with the strategy results and performance. As a matter of fact, this is also the right way to proceed when trading live a new strategy, be it a beginner or an experienced trader.

Cheers!

Categories
Forex Market

Finding The Optimal Risk % In Forex Trading

Introduction

Calculating risk is one of the most important parts of Money Mangement. Many novice traders or traders with limited experience won’t be aware of the amount of risk they can tolerate. In this article, we shall focus on determining the appropriate risk % that fits your trading style. The goal of risk management is to gain control over three things:

  • Emotions
  • Leverage
  • Sustenance

Furthermore, by limiting the loss per trade, a trader can ensure that his/her trading capital is not wiped out in one single trade. Having this discipline systematically reduces the loss per trade and provides an opportunity for the trader to re-look at the situation.

Calculating the risk

One can determine the risk based on the following factors:

Win rate

Win rate refers to how often a trader takes profitable trades relative to the trades that result in a loss. Win rate is determined by using the risk-to-reward ratio (RRR) and is calculated by the following formula.

Win rate = 1/(1+RRR)

The above-given formula is also referred to as the Minimum win rate. If any trader is trading with an RRR of 1, then his/her minimum win rate will be 50%. So out of 100 trades, we require a minimum of 50 trades to end as winners to compensate for the losing trades.

This will help a trader in deciding their maximum risk based on the win rate. This formula can also determine if a trade can be taken or not. For example, if someone has a win rate of 25%, he/she will not be able to take trades that have a risk-to-reward ratio of less than 3.

Nature of the market

Depending on the market situation, the risk can vary substantially. In a trending market, like the one in the below chart, risk should be reduced as much as possible by using a stop-loss order. We are recommending this idea as you would most probably be trend trading, and there is no point in risking more than the usual (can be lesser).

Trending Market

In a market that is trapped in a range (below image), the risk is always higher. This means anyone who trades the consolidation market is essentially increasing their risk. This would mean increasing the stop-loss, thereby reducing the risk-to-reward ratio (RRR) of the trade.

Ranging Market

Maintaining a risk of 1% constantly, regardless of the market conditions, will help the traders to sustain the loses and stay in the game even after a series of losing trades. This is a conservative method that reaps fewer rewards, but the risk is certain.

Conclusion

The aim is to achieve some level of consistency in trading by allowing yourself and your trading strategy to fight the evil forces of the market. We would say in all circumstances, a max risk of 1% appears to be the winner if you are a conservative trader. When the risk increases, it is said to impact not only the capital of the trading account but also the psychology of a trader. Hence it is better to keep risk at a bare minimum in times of uncertainty.

Categories
Forex Market

Understanding Drawdown & Its Relation With Position Size

Introduction

Do you know that there is a safe way to choose the maximum lot size when you trade? That too while keeping your account safe from blowing when a losing streak of trades occur? To constantly stay in the game and be able to recover from losses requires patience, clarity, and, more importantly – optimal Position sizing. The position size in simple words is how much a trader invests in each trade. There are different models deployed to reach the optimal position sizing depending on the objective of the trade. Before that, let’s first understand what drawdown is and how it is related to position sizing.

What is the maximum drawdown?

The maximum drawdown is the biggest drop in the accumulated profit chart and, consequently, that of the trading capital. Imagine a situation where a trader had 200 pips in profit after a number of trades, and on the following days’ profit dropped to 136 pips before he can make new accumulated high.

So, the drawdown here was 200-136 = 64 pips

When this drawdown increases, it reaches a level (negative drawdown), after which it becomes impossible to trade (due to loss of trading capital). Maximum drawdown is the loss that the trader can take in order to survive in the market and be able to continue trading.

How is drawdown related to position sizing?

Taking the above example, let us assume that the trading capital was $500 and the trader trades with a lot size of 0.01. The drawdown he experienced was 64 pips, which is $6.4 (1 Pip = $0.1). So the amount of money he/she risking in this trade is 6.4/500 x 100 = 1.28% of the account size.

Now let us see how this drawdown increases with a change in position size.

How much drawdown can I handle so that it doesn’t affect the mental state and my trading style?

As you can see below, the drawdown % increase as the lot size increases and the account gets into an unsustainable state (Especially when the Trading Capital is $500). Hence you need to calculate risk based on your risk tolerance drawdown.

The right way to look at drawdown and position size

Typically, the drawdown occurs after a series of consecutive losses. The very first thing a trader needs to do is to analyze and figure out the number of losing trader he/she can endure. Depending on that, the maximum risk percentage should be defined. So essentially, this percentage is the maximum amount of trading capital a trader affords to lose. If the losses cross this percentage, his/her account get unsustainable.

For instance, I can bear a maximum drawdown of 20%. So I should be willing to design a strategy and chose my trading size in such a way that it is very unlikely for me to reach the 20% drawdown. Let’s denote the number of losing streaks as N. I should make sure that my strategy has a winning percentage of at least 50% or more with high RRRs. Let’s assume the maximum number of losing streaks I can afford is 10 (i.e. N=10).

Dividing the maximum drawdown (20%) with N (10) gives 2%. This means that I cannot risk more than 2% of my trading capital on a trade to sustain in the market. If I have more than one open trading position, I should be distributing the risk among all of the open positions. So here, if I have 2 open positions, I shouldn’t be risking more than 1% in each of the trades. This is one of the best ways to look at drawdown and position size.

Different approaches to position sizing

Defined Percentage Risk

In this position sizing strategy, we risk a fixed percentage of the trading capital (e.g., 1%) for each trade. This is followed by most of the traders across the world and it is pretty simple to use as well. Essentially, the trader is required to put the stop-loss more accurately and not randomly to prevent the stop-loss hunt. This might sound pretty easy but it needs a lot of discipline to overcome the greed and not raise the position size when you see a clear profitable trading signal.

The Kelly Criterion Model

John Kelly described this criterion pretty long ago, which computes the optimal position size for a series of trades.

Kelly Percentage = W – [(1-W) / R)

Where, W – Winning probability and R – Profit/Loss ratio

When a trader keeps a record of all their trades, they can calculate their winning probability and profit/loss ratio. Then, they can use them in the above equation to calculate the optimal position size.

Conclusion

You now know the importance of position size and its relation to drawdown. By using this, leverage can also be used appropriately to avoid blowing-up your account because of the drawdown. By doing this, you can maximize your earnings and reduce drawdown to an acceptable value.

Our suggestion for you is to use a trading strategy for a long time. If a strategy hasn’t been tried many times, the big drawdown might not have appeared yet. The bigger the history of using the strategy, the more confidence you will get to increase the lot size. Cheers!

Categories
Forex Risk Management

Basics of Risk To Reward Ratio In Forex Trading

Introduction

The Risk to Reward Ratio is one of the most critical aspects of risk management in Forex trading. Traders with a clear understanding of what RRR is can improve his/her chances of making more profits. In this article, let’s discuss the fundamentals of Risk to Reward ratio with examples and also the ways through which it can be increased while taking your trades.

What is the Risk to Reward Ratio?

Before getting right into the topic, let’s define the meaning of ‘Risk’ here. Risk is the amount of money that a trader is willing to lose in a trade. If you have read our previous money management articles, we mentioned that a trader should not be risking more than 2-3% of their trading capital in each trade. It means when they find a trade setup, they should choose their position size in such a way that if the market hits their stop-loss, they lose a maximum of 2-3% of their trading capital.

Now, the Risk to Reward Ratio is simply the ratio between the size of your stop-loss to the size of your target profit. Let’s say your stop-loss is five pips away from your entry price and your target profit is ten pips away from the entry. In this case, your risk to reward ratio is 1:2 (5 Pips/ 10 Pips).

The larger the profit against the stop loss, the smaller the risk to reward ratio. Which means your risk is a lot smaller than your reward.

What is the recommended risk to reward ratio in the forex market?

Typically, a minimum of 1:1 or 1:2 RRR is recommended for novice traders. There are super conservative traders where they look for a minimum RRR of 1:5.

The risk to reward in every trade cannot be fixed as it varies depending on the market condition. For example, 1:3 or 1:5 RR ratio is achievable when the market is trending, and you enter the market at the right time. Whereas when the market is not very volatile, we should be happy with a risk to reward ratio of 1:1.

How to increase the risk to reward (RR) ratio?

🏳️ Raising target and putting stop-loss to breakeven

A trader can think of raising the target if the market moves to the initial take-profit quickly. This is because when the market moves so fast, it has the potential to move further, thereby increasing the profits.

🏳️ Finding trade setups from the larger time frame

Another way to increase the risk to reward (RR) ratio is by taking the strong trade setups from the higher time frames like daily, weekly, and monthly. We need to wait for such strong trade setups to form. Once formed, the price will move for hundreds of pips, and so we can have wide targets.

Final words

Higher the RRR, the better it is, and of course, higher RRRs are more challenging to achieve. So, do not forget to keep the expectations real and the risks appropriate. You do not have to avoid perfect trades just because the RRR is not as high as 1:5. Make sure to do proper risk management before placing a trade. Never trade with a risk to reward ratio that is too less and try to maximize it as much as possible. Cheers!

Categories
Forex Market

Leverage Trading & Important Money Management Rules To Follow

What is Leverage?

Leverage trading, AKA Margin trading involves borrowing extra funds to increase a trader’s bet while they trade. In this aggressive mode of trading, traders take more risk while expecting for additional rewards. This is done by the traders only when they think the odds are in their favor. Leverages is basically represented as a ratio or with an ‘X’ next to the times of leverage. For instance, to take a trade what is double the size of the amount you want to risk, you are essentially taking leverage of 2:1 or 2x.

The main leveraged products available today for Forex traders are spread betting and contract for difference (CFDs). Other products include options, futures, and some exchange-traded funds (ETFs). Before using leverage, a trader needs to understand the risk associated with it. Controlling risk means having money management principles that can be used on a daily basis. Since leverage trading can be risky, as losses can exceed your initial investment, there are appropriate money management tools that can be used to reduce your potential losses. Now let’s look at a few of these tools.

Money management rules

Using stops

Putting a stop-loss to your position can restrict your losses if the price moves against you. As mentioned in previous articles, markets move quickly, and certain conditions may result in your stop-loss not being triggered at the price you’ve set. Do not forget to trail your stop-loss after you get in a profitable position. By trailing your stop-loss, you will be able to lock in the profits you have made on your trade. There is no need to monitor your position nor the need to adjust your stop-loss manually.

The right risk to reward ratio

The risk to reward ratio can be calculated by taking the total potential profit and then dividing it by the potential loss. You need to calculate risk based on your trading capital (risking not more than 2% of trading capital) and the leverage that you use to trade, as the leverage can alter your stop-loss.

Choosing the right leverage level

It is hard to determine the right margin level for a trader as it depends on trading strategy and the overall market volatility. But from a risk perspective, there is a maximum level of margin that one should use in order not to overexpose themselves to the market. It is seen that scalpers and breakout traders use high leverage when compared to positional traders, who often trade with low leverage. Irrespective of the type of trader you are, you should choose the level of leverage that makes you most comfortable. Since forex brokers provide a maximum leverage of 1:500, newcomers find it attractive and start trading with that amount of leverage, which is very dangerous.

If you are a novice trader, the optimal leverage to use in Forex should be below 10X. But if you are an experienced trader and are extremely sure about the trade you are about to take, the maximum you can go up to is 50X. But as discussed, Forex brokers offer a maximum leverage of 500X and some time more too. But it is advisable not to go that far until and unless you have the appetite to take that risk. By using less leverage, you can still trade even after having a series of losses in the market as you are taking a calculated risk.

Bottom line

A simple rule to keep in mind is that you shouldn’t be risking more than you can afford in the market. You can open a special type of account with a forex broker known as limited-risk accounts, which ensures that all your positions have a guaranteed stop. They decide your account type and leverage based on the information you give them while opening an account. Hence, leverage can be used successfully and profitably with proper money management techniques.