Introduction
Some traders are extremely patient and wait for the perfect setup while others are extremely impatient and need to see a move in the next few minutes or hours or else, they are quick to hit the button for a ‘sell’ or a ‘buy.’ Most of the time, these impatient traders are chasing the market and necessarily take action when the market has already moved in one direction.
In other words, if they see that momentum builds in one direction, they piggyback on the momentum in hopes for an extension move as momentum continues to build. Once the ‘move’ starts showing signs of losing strength, these impatient momentum traders will also be the first to jump the ship.
So, if our strategy is based on momentum, we need to have solid rules for ‘entry’ and ‘exit’ to protect profits. At the same time, we should be able to do trade management to ride as much of the extension move as possible.
In this regard, we have developed a great momentum strategy that we call the ‘Momo’ trading strategy because we look for momentum or momo burst on very short term price charts.
Time Frame
The ‘momo’ trading strategy works well on the 5-minute time frame. This means each candle represents 5 minutes of price movement.
Indicators
We lay two indicators on the chart, the first one of which is 20-period EMA. The second indicator that we use is the MACD histogram. The settings for the MACD histogram is the default, where the first EMA = 12, second EMA = 26, and signal EMA = 9. All of these are based on the closing price of the candle.
Currency Pairs
This strategy applies only to the major currency pairs. Some of these include EUR/USD, USD/JPY, GBP/USD, GBP/JPY, USD/CAD, etc.
Strategy Concept
We use the Exponential Moving Average (EMA) to help us determine the trend of the market. Once the trend has been established, we use the second indicator to gauge the momentum of the move. We essentially wait for a reversal in the market, and then we try to take position only if the momentum supports the reversal move enough to create a large extension burst.
The position is exited in two segments, and the first half helps us lock some gains and ensures that a winner does not turn into a loser. The second ‘take-profit‘ attempts to catch what could become very large with less risk since we have already booked some profits earlier.
Trade Setup
In order to illustrate the strategy, we have considered the chart of EUR/USD, where we shall be applying the strategy to initiate a trade. All the steps will be performed on the 5-minutes time frame.
Step 1
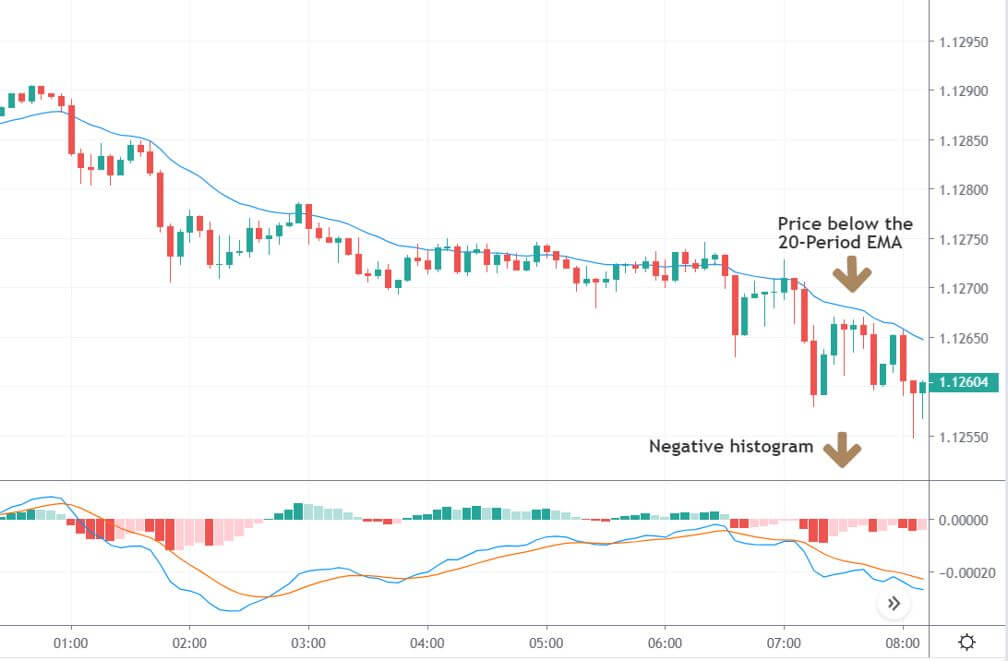
Open a 5-minutes time frame chart of the desired currency pair and plot the 20-period EMA on the chart. Along with this also plot the MACD indicator on the chart. After plotting both the indicators, look for the currency pair to be trading below the 20-period EMA. The MACD histogram should be negative during this time period.
In the below image, we can see that the market is in a strong downtrend, and currently, the price may be overextended to the downside as indicated by the two indicators.
Step 2
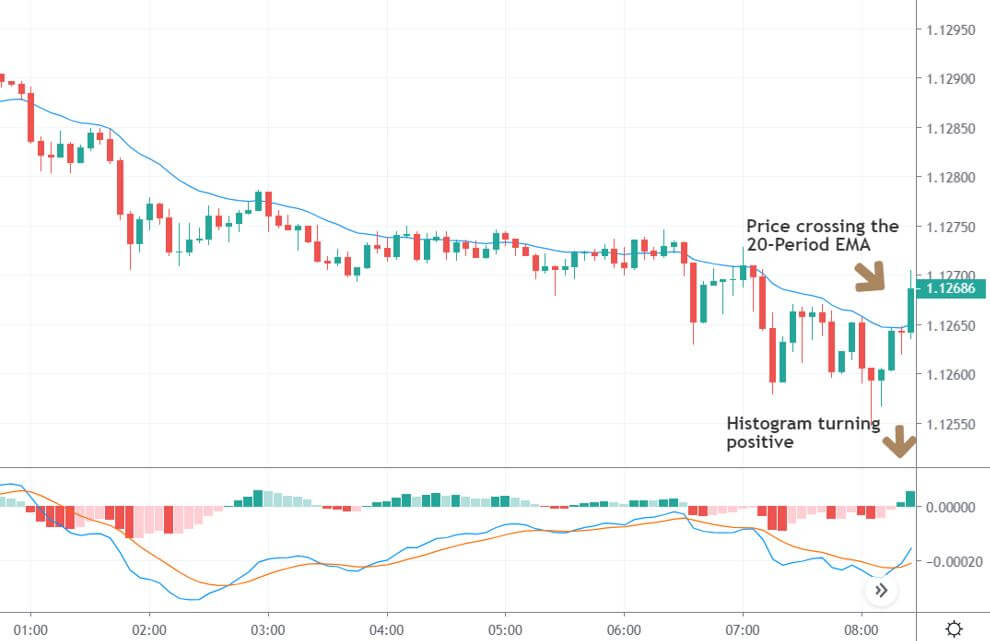
Next, we need to wait for the price to cross above the 20-period EMA. When the price crosses the EMA, we need to make sure that the MACD is in the process of crossing from negative to positive or is in the positive territory no longer than 5 bars ago (in case of a downtrend reversal). The fulling of both these criteria together is a very strong sign of a reversal in the market. The two indicators combined together are very useful for identifying reversal in the market.
The below image shows the crossing of the price above the EMA with a single bullish candle, and, at the same time, the histogram also turns positive.
Step 3
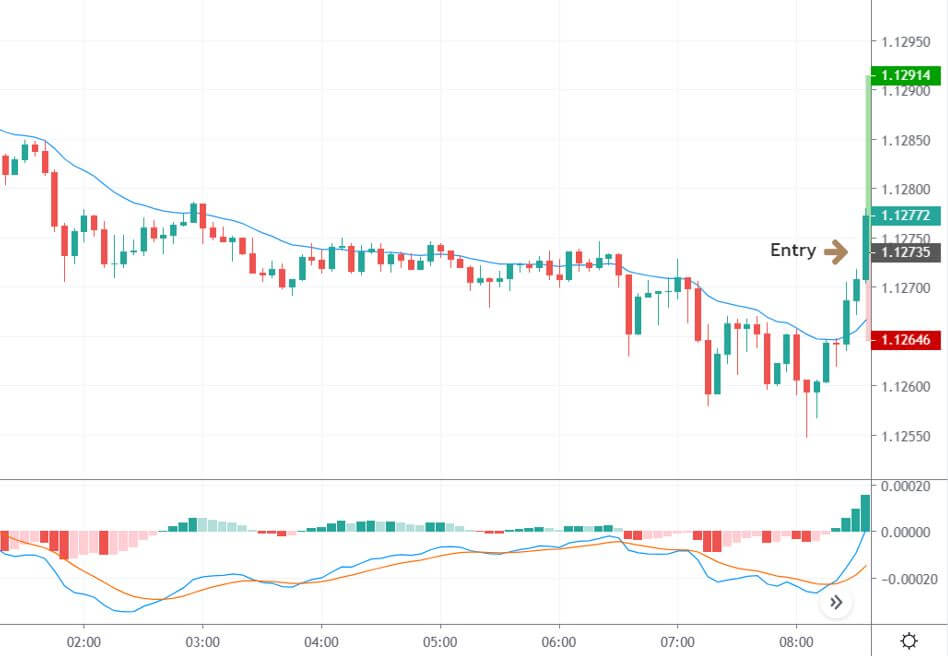
We enter the market for a ‘buy’ or ‘sell’ after the market moves at least ten pips above or below the EMA. This is an aggressive form of ‘entry’ which may not be suitable for everyone. The conservative way of taking an ‘entry’ is by waiting for the market to re-test the EMA and then enter at the retracement. But if the momentum is strong, the market might just continue moving higher. In these times, traders who entered aggressively will only make money. It all depends on the nature of the trader.
As we can see in the below image, we have taken an aggressive ‘entry’ in the pair, i.e., exactly at ten pips from the point of crossing of the EMA. The histogram also shows that the momentum is building on the upside.
Step 4
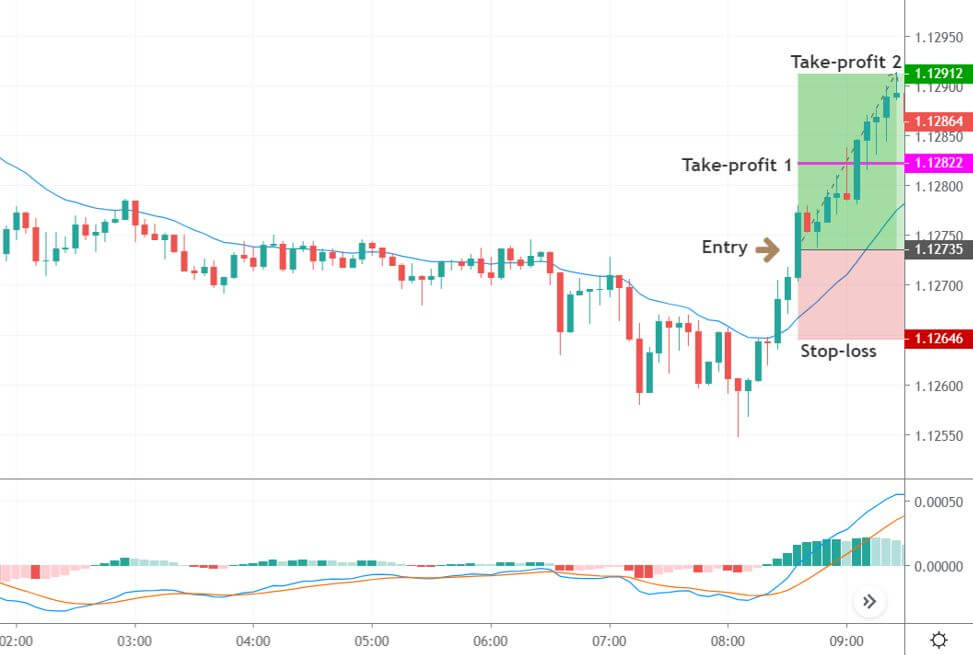
In this step, we will determine the stop-loss and take-profit for the strategy. As mentioned before, the first take-profit is set at 1:1 risk to reward, which ensures we don’t lose money if the market turns around from the middle. The second and final take-profit is set at 1:2 risk to reward, to take advantage of the market momentum, which leads to an extended reversal. The stop-loss is set just a little below or above the EMA, which will be about 10-15 pips. A conservative trader can place the stop-loss below the ‘low’ or above the ‘high’ from where the market reverses.
We can see in the below image that the momentum continues to build on the upside (indicate by histogram), which is why the market moves smoothly to our final take-profit after we enter.
Strategy Roundup
As this is a momentum-based strategy, we can also use trailing stop-loss to capture gains of the new trend. Since liquidity is the basic requirement of the strategy, we recommended using this strategy in pairs like EUR/USD, GBP/USD, USD/JPY, and some other major pairs only. The ‘momo’ trading strategy is a powerful strategy to capture momentum-based reversal moves. However, sometimes it may not work, and it is important to figure out why it failed.


