Categories
Forex Course

192. Criteria To Carry Trade The Forex Market and Risks Involved

Introduction

In the previous lesson, we discussed instances when a carry can work, and when it’s bound to fail. But, having this knowledge won’t be of much help if you do not know the best criteria for a currency carry trade and the risks involved.

Criteria to Carry Trade

There are two basic criteria to carry trade the Forex market profitably.

The interest rate differential between two currency pairs needs to be high with no prospects of reducing in the near term.

The currency pair that we choose has to be on a bullish trend in favor of the currency with the higher interest rate. The reason for this is to ensure you can remain bullish on the high yielding currency and profit from the interest rate differential for the longest possible time.

Let’s take the example of the AUD/JPY pair. Japan’s interest rate has remained at -0.1%, while in Australia was held at 0.25%. That means the interest rate differential between the AUD/JPY pair has been 0.35%. Therefore, if you were to borrow and sell the JPY to buy the AUD, you’d expect a pay-out of 0.35%. Note that this is the same as going long on the AUD/JPY pair.

In this scenario, going long on AUD/JPY from March 2020 to October 2020 would have earned you over 900 pips. At the same time, you’d be earning an interest rate differential of 0.35%.

Risks Involved In Carry Trading

So far, a carry trade sounds like a risk-free strategy. But, like any other investment, the carry trade has its fair amount of risks – especially when leverage is involved.

Remember, in the previous lesson, we mentioned two conditions for a carry trade to thrive. First, there had to be low volatility in the market. The reason for this is to ensure that your open position is not wiped out due to currency fluctuations before you reap the profits of interest rate differential. Note that using trailing stop orders can help mitigate the risk of price fluctuations in the forex market.

The second condition for a carry trade to thrive was the stable economic conditions that might encourage the hiking of interest rates. If the economic climate is full of uncertainties, like with the ongoing coronavirus pandemic, central banks are more likely to cut interest rates than hike them. Therefore, if extreme interest rate cuts occur while you are in a currency carry trade, it could result in losses. 

[wp_quiz id=”99537″]
Categories
Forex Basic Strategies

Forex Momentum Trading Using The ‘Momo Strategy’

Introduction

Some traders are extremely patient and wait for the perfect setup while others are extremely impatient and need to see a move in the next few minutes or hours or else, they are quick to hit the button for a ‘sell’ or a ‘buy.’ Most of the time, these impatient traders are chasing the market and necessarily take action when the market has already moved in one direction.

In other words, if they see that momentum builds in one direction, they piggyback on the momentum in hopes for an extension move as momentum continues to build. Once the ‘move’ starts showing signs of losing strength, these impatient momentum traders will also be the first to jump the ship.

So, if our strategy is based on momentum, we need to have solid rules for ‘entry’ and ‘exit’ to protect profits. At the same time, we should be able to do trade management to ride as much of the extension move as possible.

In this regard, we have developed a great momentum strategy that we call the ‘Momo’ trading strategy because we look for momentum or momo burst on very short term price charts.

Time Frame

The ‘momo’ trading strategy works well on the 5-minute time frame. This means each candle represents 5 minutes of price movement.

Indicators

We lay two indicators on the chart, the first one of which is 20-period EMA. The second indicator that we use is the MACD histogram. The settings for the MACD histogram is the default, where the first EMA = 12, second EMA = 26, and signal EMA = 9. All of these are based on the closing price of the candle.

Currency Pairs

This strategy applies only to the major currency pairs. Some of these include EUR/USD, USD/JPY, GBP/USD, GBP/JPY, USD/CAD, etc.

Strategy Concept

We use the Exponential Moving Average (EMA) to help us determine the trend of the market. Once the trend has been established, we use the second indicator to gauge the momentum of the move. We essentially wait for a reversal in the market, and then we try to take position only if the momentum supports the reversal move enough to create a large extension burst.

The position is exited in two segments, and the first half helps us lock some gains and ensures that a winner does not turn into a loser. The second ‘take-profit‘ attempts to catch what could become very large with less risk since we have already booked some profits earlier.

Trade Setup

In order to illustrate the strategy, we have considered the chart of EUR/USD, where we shall be applying the strategy to initiate a trade. All the steps will be performed on the 5-minutes time frame.

Step 1

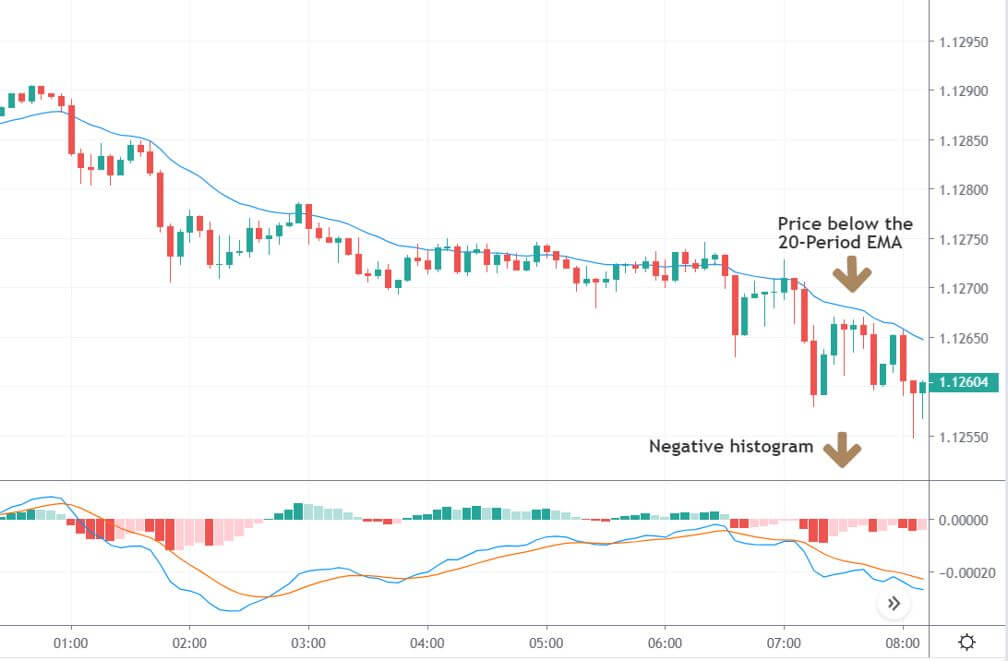
Open a 5-minutes time frame chart of the desired currency pair and plot the 20-period EMA on the chart. Along with this also plot the MACD indicator on the chart. After plotting both the indicators, look for the currency pair to be trading below the 20-period EMA. The MACD histogram should be negative during this time period.

In the below image, we can see that the market is in a strong downtrend, and currently, the price may be overextended to the downside as indicated by the two indicators.
Step 2

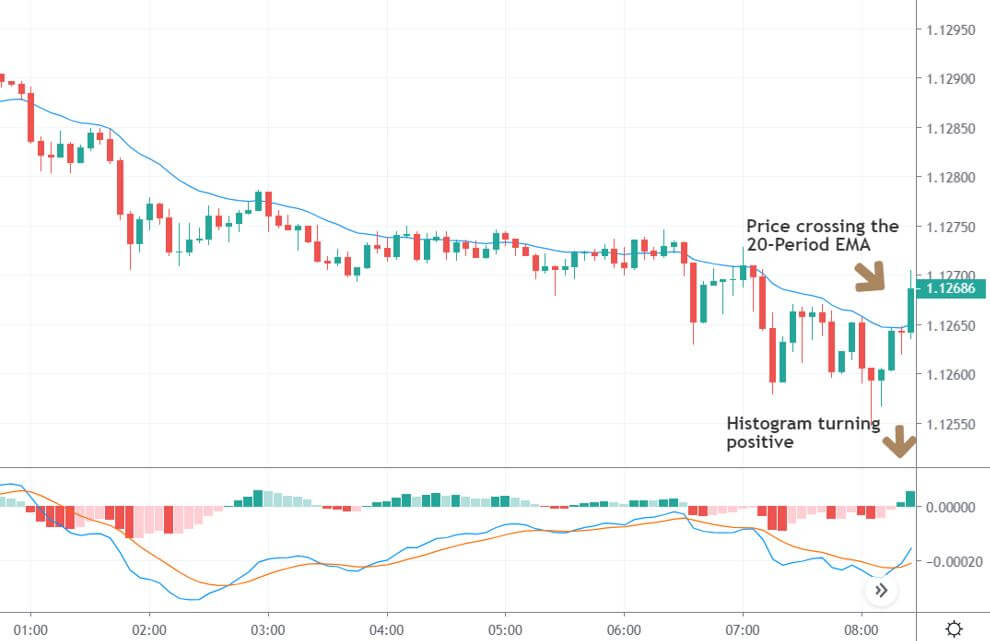
Next, we need to wait for the price to cross above the 20-period EMA. When the price crosses the EMA, we need to make sure that the MACD is in the process of crossing from negative to positive or is in the positive territory no longer than 5 bars ago (in case of a downtrend reversal). The fulling of both these criteria together is a very strong sign of a reversal in the market. The two indicators combined together are very useful for identifying reversal in the market.

The below image shows the crossing of the price above the EMA with a single bullish candle, and, at the same time, the histogram also turns positive.
Step 3

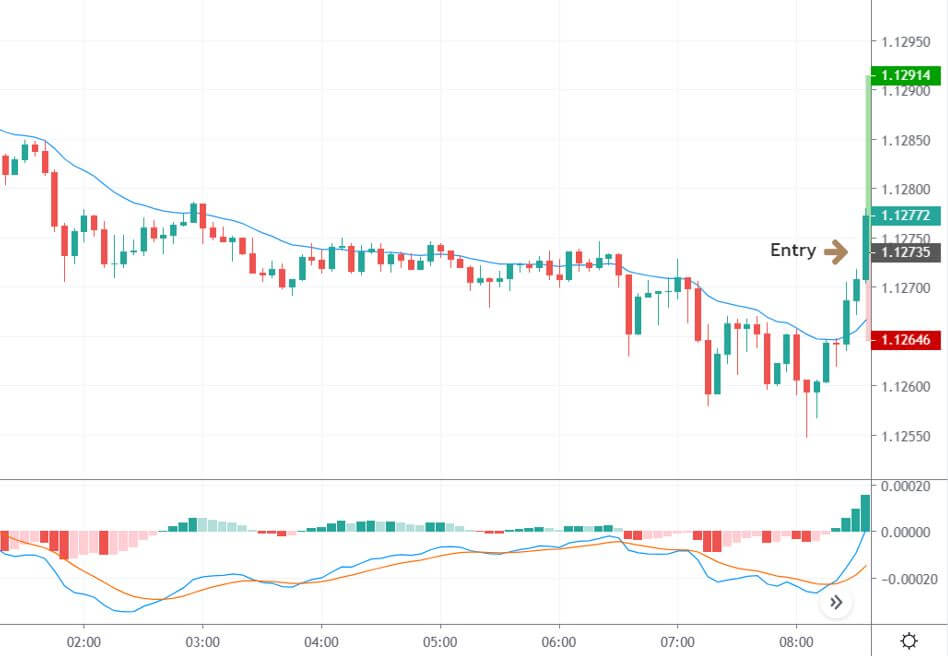
We enter the market for a ‘buy’ or ‘sell’ after the market moves at least ten pips above or below the EMA. This is an aggressive form of ‘entry’ which may not be suitable for everyone. The conservative way of taking an ‘entry’ is by waiting for the market to re-test the EMA and then enter at the retracement. But if the momentum is strong, the market might just continue moving higher. In these times, traders who entered aggressively will only make money. It all depends on the nature of the trader.

As we can see in the below image, we have taken an aggressive ‘entry’ in the pair, i.e., exactly at ten pips from the point of crossing of the EMA. The histogram also shows that the momentum is building on the upside.
Step 4

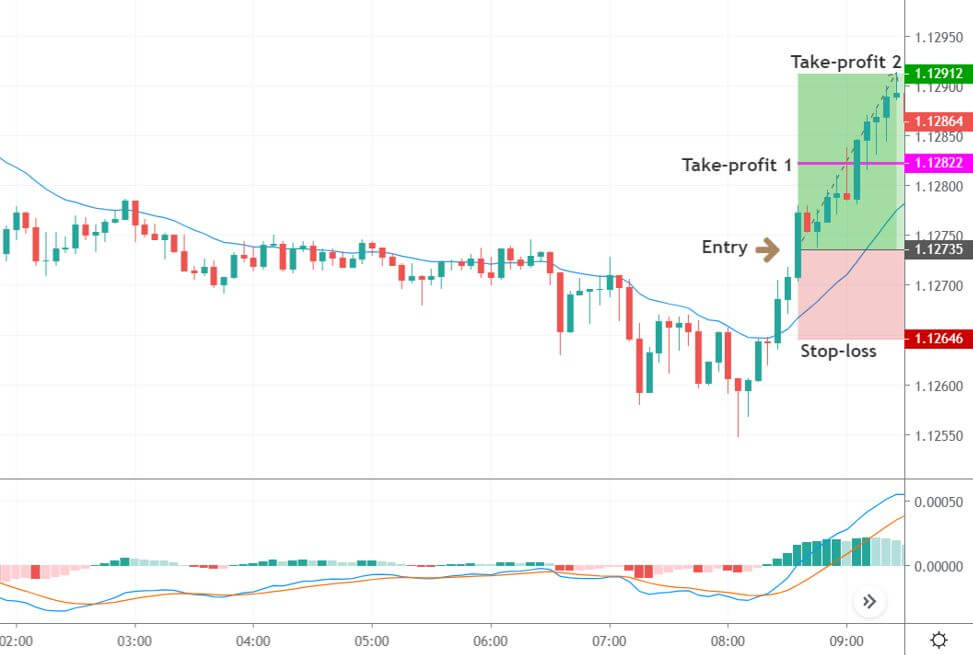
In this step, we will determine the stop-loss and take-profit for the strategy. As mentioned before, the first take-profit is set at 1:1 risk to reward, which ensures we don’t lose money if the market turns around from the middle. The second and final take-profit is set at 1:2 risk to reward, to take advantage of the market momentum, which leads to an extended reversal. The stop-loss is set just a little below or above the EMA, which will be about 10-15 pips. A conservative trader can place the stop-loss below the ‘low’ or above the ‘high’ from where the market reverses.

We can see in the below image that the momentum continues to build on the upside (indicate by histogram), which is why the market moves smoothly to our final take-profit after we enter.
Strategy Roundup

As this is a momentum-based strategy, we can also use trailing stop-loss to capture gains of the new trend. Since liquidity is the basic requirement of the strategy, we recommended using this strategy in pairs like EUR/USD, GBP/USD, USD/JPY, and some other major pairs only. The ‘momo’ trading strategy is a powerful strategy to capture momentum-based reversal moves. However, sometimes it may not work, and it is important to figure out why it failed.


Categories
Forex Basics Forex Daily Topic

A Winner is Not Always a Good Trade

Price action traders use chart combinations such as Weekly-Daily, Daily-H4, H4-H1, and H1-15M, etc. Intraday minor charts’ traders such as the H1, 15M, 5M do not have an undeviating relation with the daily chart. However, it is often seen that if the daily price action is choppy, it gets tough to find out a good entry for the intraday traders. Notably, on a choppy daily chat, it gets extremely tough for the H4 traders to find an entry with good risk-reward. Thus, even a trade that gets us profit may not always be a good one. Let us demonstrate an example of that.

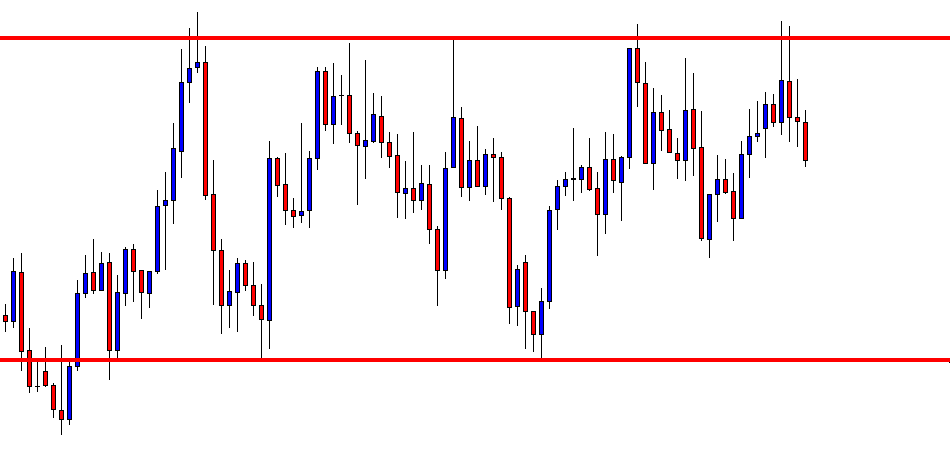
This is a daily chart, which shows that the price action has been choppy. It gets caught within a bullish rectangle. The daily traders are to wait for a breakout. However, the H4 traders know the range. Thus, they are to wait for a daily bearish reversal at the resistance zone and bullish reversal at the support zone. Let us see where it produces the next reversal.

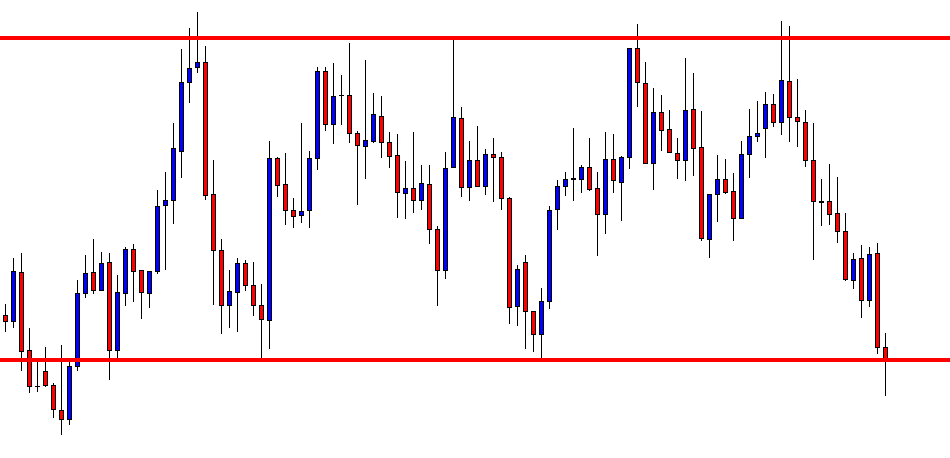
The chart produces an Inverted Hammer right at the resistance. The H4 traders are to flip over the chart; wait for consolidation and bearish breakout to take a short entry. The risk-reward looks good here.

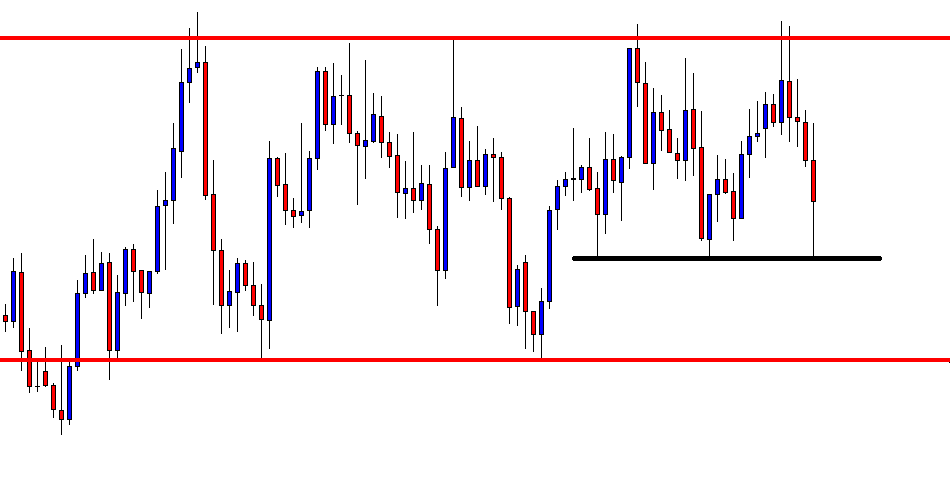
The H4 chart shows the last candle comes out as a bearish candle. If the price consolidates with the support of the candle’s lowest low, a bearish breakout will be the signal to go short.

The next candle comes out as another bearish candle. The candle has a bounce at H4 support, as well. If the price consolidates and makes a bearish breakout, the sellers may take a short entry. There is still space for the price to travel towards the downside.

The price consolidates and makes a breakout at the support. The breakout candle looks good. By setting Stop Loss at the consolidation resistance, a short entry may be triggered right after the last candle closes. Take Profit shall be placed at the red-marked level. Let us find out whether it hits Take Profit.

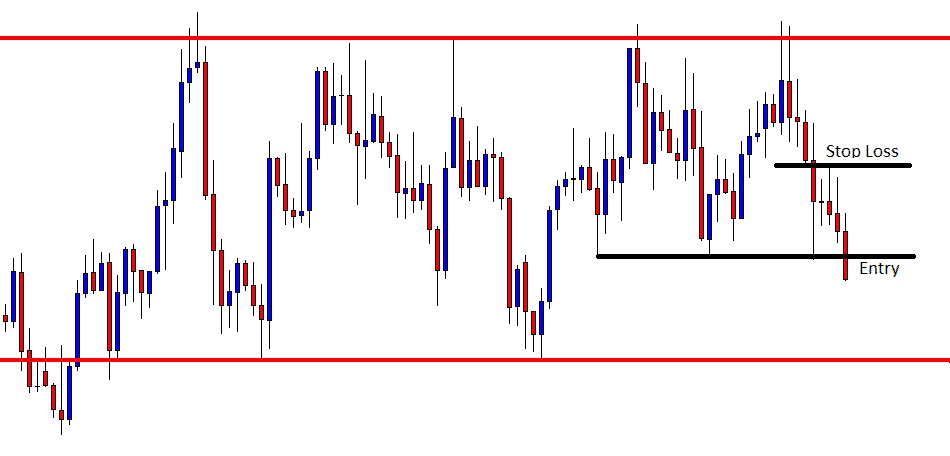
It does. It gets us profit. The question is whether it is a good trade or not. As far as risk-reward is concerned, it is not a good entry. It gets us less reward than the risk. Thus, traders shall skip taking that entry in the first place.

The Bottom Line

Price action traders may find many trade setups that match with all the norms for taking an entry. However, they must consider risk-reward on every single trade. If it offers less than 1:1 risk-reward, they shall avoid taking that entry. In most cases, an entry offering less than 1:1 risk-reward has less chance to be a winning trade as well. In this example, it is a winner. However, considering entire facts, it is not a good entry.

Categories
Forex Risk Management

Basics of Risk To Reward Ratio In Forex Trading

Introduction

The Risk to Reward Ratio is one of the most critical aspects of risk management in Forex trading. Traders with a clear understanding of what RRR is can improve his/her chances of making more profits. In this article, let’s discuss the fundamentals of Risk to Reward ratio with examples and also the ways through which it can be increased while taking your trades.

What is the Risk to Reward Ratio?

Before getting right into the topic, let’s define the meaning of ‘Risk’ here. Risk is the amount of money that a trader is willing to lose in a trade. If you have read our previous money management articles, we mentioned that a trader should not be risking more than 2-3% of their trading capital in each trade. It means when they find a trade setup, they should choose their position size in such a way that if the market hits their stop-loss, they lose a maximum of 2-3% of their trading capital.

Now, the Risk to Reward Ratio is simply the ratio between the size of your stop-loss to the size of your target profit. Let’s say your stop-loss is five pips away from your entry price and your target profit is ten pips away from the entry. In this case, your risk to reward ratio is 1:2 (5 Pips/ 10 Pips).

The larger the profit against the stop loss, the smaller the risk to reward ratio. Which means your risk is a lot smaller than your reward.

What is the recommended risk to reward ratio in the forex market?

Typically, a minimum of 1:1 or 1:2 RRR is recommended for novice traders. There are super conservative traders where they look for a minimum RRR of 1:5.

The risk to reward in every trade cannot be fixed as it varies depending on the market condition. For example, 1:3 or 1:5 RR ratio is achievable when the market is trending, and you enter the market at the right time. Whereas when the market is not very volatile, we should be happy with a risk to reward ratio of 1:1.

How to increase the risk to reward (RR) ratio?

🏳️ Raising target and putting stop-loss to breakeven

A trader can think of raising the target if the market moves to the initial take-profit quickly. This is because when the market moves so fast, it has the potential to move further, thereby increasing the profits.

🏳️ Finding trade setups from the larger time frame

Another way to increase the risk to reward (RR) ratio is by taking the strong trade setups from the higher time frames like daily, weekly, and monthly. We need to wait for such strong trade setups to form. Once formed, the price will move for hundreds of pips, and so we can have wide targets.

Final words

Higher the RRR, the better it is, and of course, higher RRRs are more challenging to achieve. So, do not forget to keep the expectations real and the risks appropriate. You do not have to avoid perfect trades just because the RRR is not as high as 1:5. Make sure to do proper risk management before placing a trade. Never trade with a risk to reward ratio that is too less and try to maximize it as much as possible. Cheers!