Categories
Forex Basic Strategies

Restrict Your Losses To Only 10-Pips a Day With This Strategy

Introduction

Every trader loves the idea of winning on each trade they take. After all, winning is the sole purpose of trading. Various strategies in the market promise to offer profits every day, but none of them are good enough to make you win every single trade you take. In the end, almost all of the traders wish for a method that could reap them good profit every day. But as we all know, trading is less about making money and more about saving your capital. For this same purpose, we have created the 10 Pip Loss Strategy.

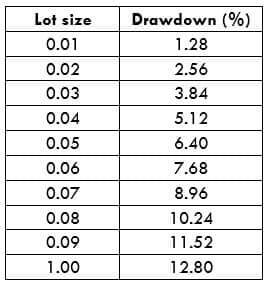
The strategy suggests that we must take two to three trades a day by placing only ten pips stop-loss and go for bigger targets. For instance, let’s consider that we took three trades in a single day. If we lose two trades and end up winning one, we will be losing only 20 pips, but the gains that are earned on the third trade can be more. By following this strategy, our primary focus should be on taking three potential trades in a day.

The Strategy – Pairing Double Moving Average & Stochastic Indicator

It is highly advisable to use this strategy in a strong trending market.

To Go Long (Buy Trades)

  • Firstly, identify an uptrend in any currency pair.
  • Apply the double moving average indicator to the price chart. Go with 9 and 14 periods.
  • Wait for the pullback to happen, and the price action must hold below the double moving average.
  • Look if the Stochastic is reversing at the oversold area.
  • Go long if all the above rules are met.
  • Place the stop-loss just ten pips below the entry. Take profit placement depends on the market state. If the buyer movement is strong, expect a brand new higher high; if the momentum is a slow, exit at the most recent higher high.

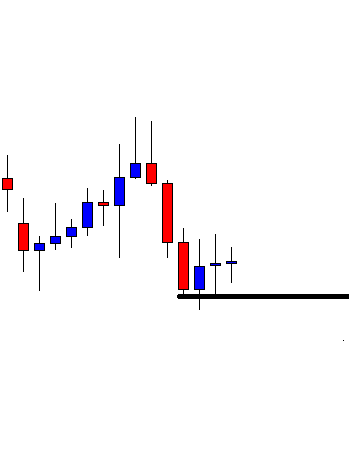
The image below represents our losing trade in the AUD/CHF forex pair. As you can see, both the indicators gave us a trading signal at around 08:45 AM. We activated our trade when the price of the asset is 0.6129. It went a bit up and suddenly dropped down to hit our stop loss. As a result, we ended up losing the trade.

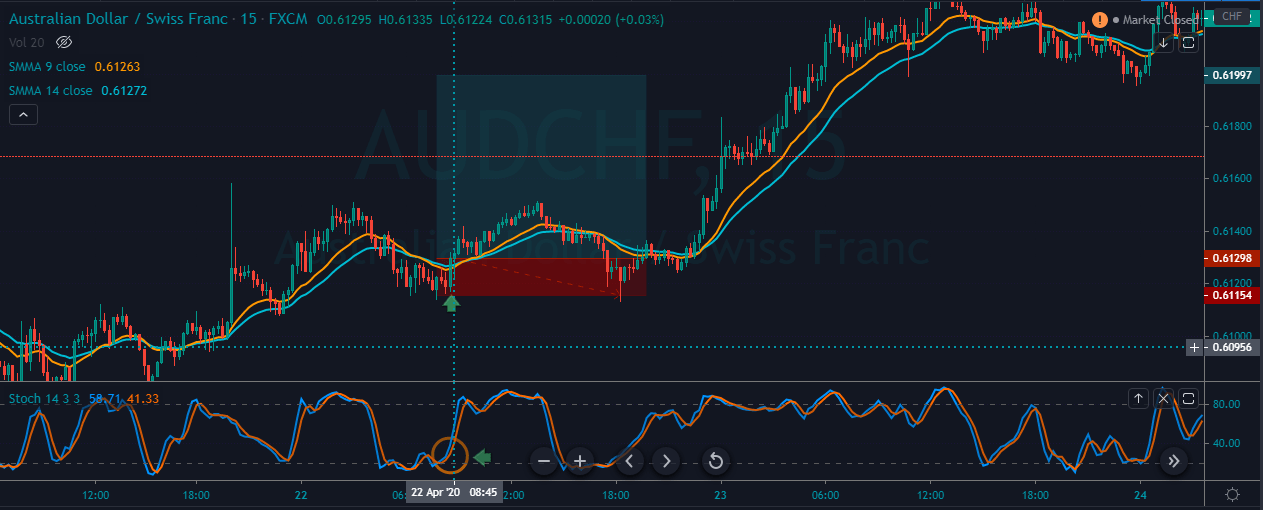
The best thing is that we lost only ten pips. Hence, these smaller losses won’t influence our decision-making abilities.

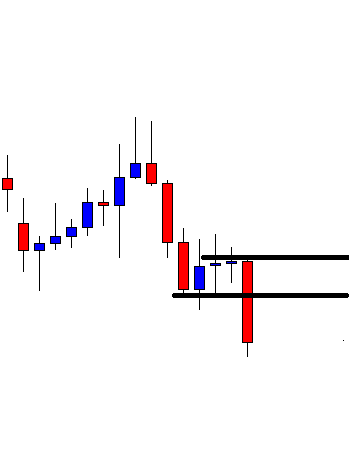
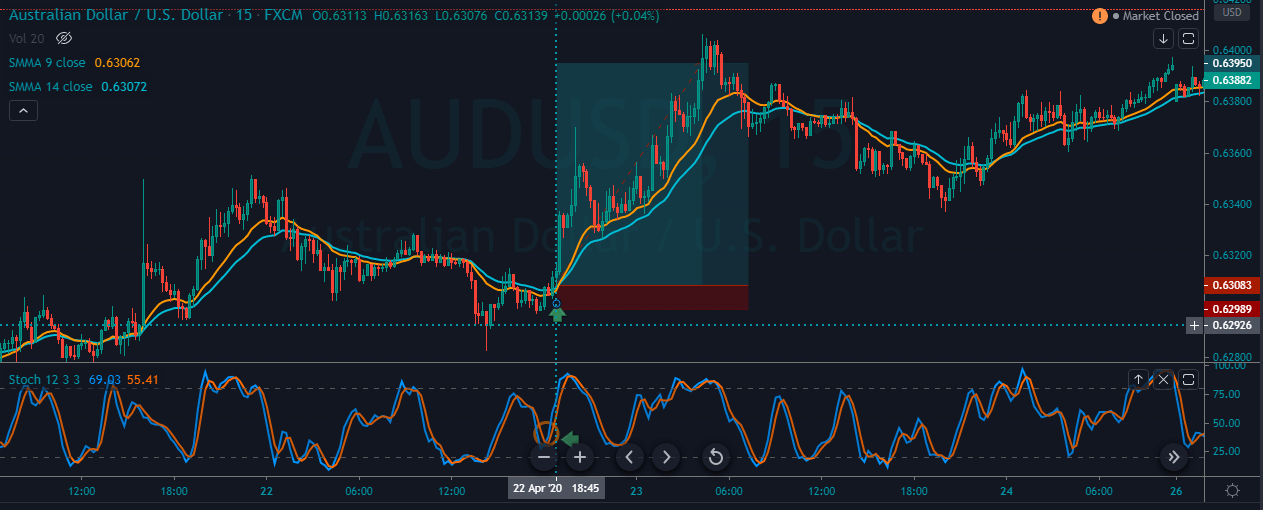
The image below represents our winning trade in the AUD/NZD Forex pair. We took this trade on 22nd April at around 08:45 AM. When the moving average went below the price, the Stochastic gave a reversal at the oversold area, indicating us to go long in this pair. Right after we went long, the price action blasted to the north and printed a brand new higher high. We end up making 90 pips in this trade.

Overall, we lost ten pips till now, and hence we stand at 80 pips profit.

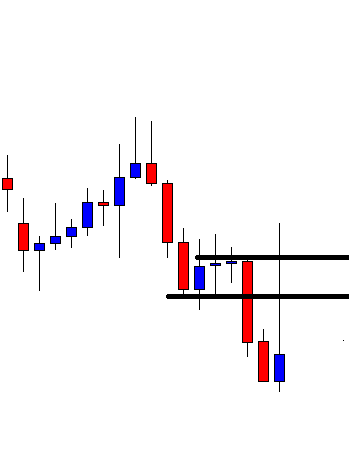
The below price chart represents our third trade on 22nd April. We took this trade at around 6:45 PM. Following our strategy, we made entry, and the price action has printed a brand new higher high. This trade gave us a profit of 80 pips.

To sum it up, we took three trades out of which we made 170+ pips profit and a loss of only ten pips. By following this strategy, we can make profits on every single trading day. Note: Use this strategy only when you see the potential of having at least three trades in a single day. Otherwise, there is no point in using this strategy.

To Go Short (Sell Trades)

  1. Firstly, identify a downtrend in any currency pair.
  2. Apply the double moving average indicator to the price chart. Go with 9 and 14 periods.
  3. Wait for the pullback to happen, and the price action must hold above the double moving average.
  4. Look if the Stochastic is reversing at the overbought area.
  5. Go short if all the above rules are met.
  6. Place the stop-loss just ten pips above the entry. Take profit placement depends on the market state. If the seller movement is strong, expect a brand new lower low; if the momentum is a slow, exit at the most recent lower low.

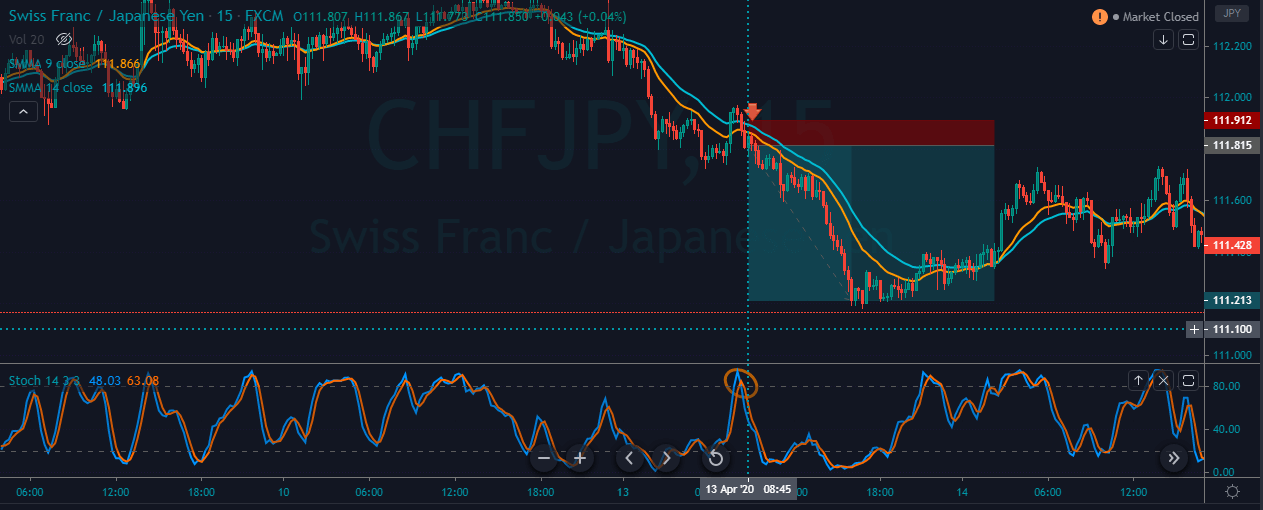
The image below represents a sell signal in the CHF/JPY Forex pair. This is the first trade we activated on 13th April at around 08:45 AM. Overall, the market was in a strong downtrend, and when it pulled back, both the indicators gave us a sell signal. After we went short, the price sharply goes down and prints a brand new lower low. This trade gave us 60+ pip profit.

We took the second trade relatively at the same time in the USD/JPY Forex pair. Overall, this pair was also in a strong downtrend, and we activated the trade when both the indicators gave us a sell signal. In this pair, the seller momentum was strong enough, and we ended up making 82+ pips. 

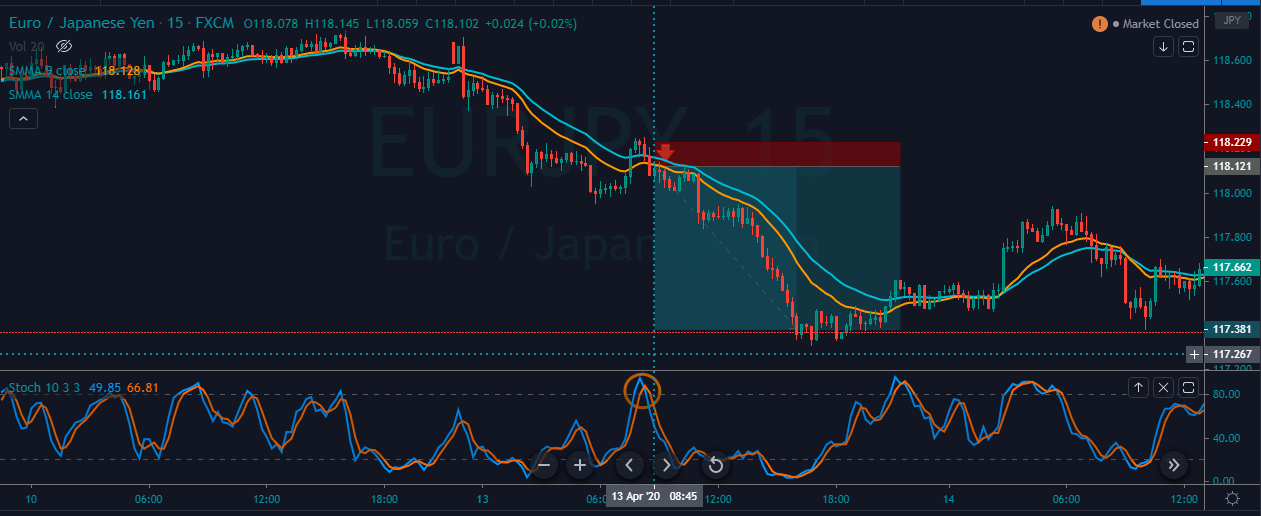
This is the third trade we took in the EUR/JPY Forex pair. When price action pulled back to the moving average, the Stochastic also gave us a reversal at the overbought area, indicating us to go short. By the time we have exited, we booked 64+ pips of profit.

In total, we took three trades, and all of them hit our take-profit. If you observe, even if we would have lost two trades and won only one, we would still have ended up on the winning side. In a strong trending market, it is easy to win all the trades we take. All you need to do is to follow the rules of the strategy very well. To sum it up, with minimum risk, we gained a profit of 206 pips from the market.

We hope you understood the strategy well. Please try and trade this strategy in a demo account before applying it to the live market. Cheers!

Categories
Forex Daily Topic Forex Price-Action Strategies

Forex Price Action: A Losing Trade

Forex trading is considered one of the riskiest businesses. The market is volatile and it gets unpredictable from time to time. There is no trading strategy, which can guarantee one hundred per cent success. Thus, Forex traders must be mentally prepared to take losses. In today’s lesson, we are going to demonstrate an example of a losing trade.

The chart shows that the price upon finding its resistance heads towards the South with good bearish momentum. The first candle comes out as a bearish engulfing candle followed by two bearish candles. These suggest that the bear takes control. The sellers are to wait for the price to consolidate and a bearish engulfing candle to go short in the pair. Let us proceed to the next chart to find out what the price does.

The price finds its support. It produces a bullish inside bar followed by two doji candles. It seems that the price has been searching for its resistance. The sellers are to keep their eyes on this chart.

The price finds its resistance. It produces a bearish engulfing candle closing below consolidation resistance. Without any doubt, this is an A+ breakout candle. The sellers may trigger a short entry right after the candle closes by setting stop loss above consolidation resistance and by setting take profit with 1R. Let us find out how the trade goes.

It looks fantastic for the sellers. The next candle comes out as a bearish candle as well. Consecutive two bearish candles suggest that the bear is in a hurry to hit the take profit. The sellers may not have to wait too long to achieve their target as far as the price action in this chart is concerned.

Would you believe it? The next candle comes out as an inverted hammer. The upper shadow hits the stop loss. The sellers are out with their entry with a loss. That was beyond their imagination some might say. However, it happens a lot in the Forex market. Thus, traders must not be overconfident with any entry. Discipline and money management are to be maintained with every single trade.

Some traders, especially at the beginning can’t take losses easily. It bugs them up. Losing money may make them think something is wrong with their strategy. There is nothing wrong if traders want to try to develop new strategies. However, they should not just lose the belief and abandon a long proven strategy all of a sudden.

Categories
Forex Course

32. Understanding Stop Out Level In Margin Trading

Introduction

In the last lesson, we saw how Margin Level was found to be useful for giving meaning to Margin Call Level. Similar to the previous lesson, in this lesson, we shall be discussing another term that involves the dependency of the Margin Level. This lesson will be dealing with the understanding of what Stop Out Level is and also the implications and consequences of it.

Stop Out Level, and Margin Call Level have almost got the same meaning. There is only a thin line difference between these two. Hence, understanding the Margin Call Level is critical to comprehend Stop Out Level.

What is Stop Out Level?

Stop Out Level is a level that is set by the brokers, which triggers them to take action when the Margin Level falls below this specified level (Stop Out Level). That is, when the Margin Level breaks below the Stop Out Level, the broker forcibly closes some of the trader’s position, usually without their consent. The positions are liquidated because of the unavailability of the margin in the account.

Before the broker closes the positions, the trader is first intimated that their Margin Level has significantly reduced and is at risk. This intimation is called Margin Call. If the Margin Level falls much more than the Margin Call Level and goes below the Stop Out Level, the positions are liquidated. And this process of liquidation is called Stop Out.

The complete flow to Stop Out

If we were to dig deeper, the dependency of Stop Out level drops down to the basic concepts like Balance, Margin, Floating P/L, etc.

For instance, when a trader takes a position, the above terms come into action. If the trade is in profit, the floating P/L increases, and there are no worries about the margin call and stop out as the margin level would be considerably higher than the margin call level and the stop out level. But, if the trade is running in the negative, eyes must be on the margin call level as well as stop out level. Let’s get this point clearer, with an example.

Let’s say a trader has deposited $1000 into his account and has used $200 for taking few positions. Consider the Stop Out Level to be at 20%.

If the trades are running in a loss of$970. The equity for this is calculated as:

Equity = balance + floating P/L = $1,000 + (-$970) = $30

Similarly, the margin level will be,

Margin level = (Equity/used margin) x 100% = ($30 / $200) x 100% = 15%

Now, since the margin level has gone below the stop out level, the positions are scratched off. So, the trader will have booked a loss of $970. And the newly updated balance will be $30.

This brings us to the end of this lesson on Stop Out Level. Also, this completes all the terminologies that are involved in Margin Trading. Take the quiz below and stay tuned to learn a different lesson tomorrow. Cheers!

[wp_quiz id=”51331″]
Categories
Forex Market

Understanding Drawdown & Its Relation With Position Size

Introduction

Do you know that there is a safe way to choose the maximum lot size when you trade? That too while keeping your account safe from blowing when a losing streak of trades occur? To constantly stay in the game and be able to recover from losses requires patience, clarity, and, more importantly – optimal Position sizing. The position size in simple words is how much a trader invests in each trade. There are different models deployed to reach the optimal position sizing depending on the objective of the trade. Before that, let’s first understand what drawdown is and how it is related to position sizing.

What is the maximum drawdown?

The maximum drawdown is the biggest drop in the accumulated profit chart and, consequently, that of the trading capital. Imagine a situation where a trader had 200 pips in profit after a number of trades, and on the following days’ profit dropped to 136 pips before he can make new accumulated high.

So, the drawdown here was 200-136 = 64 pips

When this drawdown increases, it reaches a level (negative drawdown), after which it becomes impossible to trade (due to loss of trading capital). Maximum drawdown is the loss that the trader can take in order to survive in the market and be able to continue trading.

How is drawdown related to position sizing?

Taking the above example, let us assume that the trading capital was $500 and the trader trades with a lot size of 0.01. The drawdown he experienced was 64 pips, which is $6.4 (1 Pip = $0.1). So the amount of money he/she risking in this trade is 6.4/500 x 100 = 1.28% of the account size.

Now let us see how this drawdown increases with a change in position size.

How much drawdown can I handle so that it doesn’t affect the mental state and my trading style?

As you can see below, the drawdown % increase as the lot size increases and the account gets into an unsustainable state (Especially when the Trading Capital is $500). Hence you need to calculate risk based on your risk tolerance drawdown.

The right way to look at drawdown and position size

Typically, the drawdown occurs after a series of consecutive losses. The very first thing a trader needs to do is to analyze and figure out the number of losing trader he/she can endure. Depending on that, the maximum risk percentage should be defined. So essentially, this percentage is the maximum amount of trading capital a trader affords to lose. If the losses cross this percentage, his/her account get unsustainable.

For instance, I can bear a maximum drawdown of 20%. So I should be willing to design a strategy and chose my trading size in such a way that it is very unlikely for me to reach the 20% drawdown. Let’s denote the number of losing streaks as N. I should make sure that my strategy has a winning percentage of at least 50% or more with high RRRs. Let’s assume the maximum number of losing streaks I can afford is 10 (i.e. N=10).

Dividing the maximum drawdown (20%) with N (10) gives 2%. This means that I cannot risk more than 2% of my trading capital on a trade to sustain in the market. If I have more than one open trading position, I should be distributing the risk among all of the open positions. So here, if I have 2 open positions, I shouldn’t be risking more than 1% in each of the trades. This is one of the best ways to look at drawdown and position size.

Different approaches to position sizing

Defined Percentage Risk

In this position sizing strategy, we risk a fixed percentage of the trading capital (e.g., 1%) for each trade. This is followed by most of the traders across the world and it is pretty simple to use as well. Essentially, the trader is required to put the stop-loss more accurately and not randomly to prevent the stop-loss hunt. This might sound pretty easy but it needs a lot of discipline to overcome the greed and not raise the position size when you see a clear profitable trading signal.

The Kelly Criterion Model

John Kelly described this criterion pretty long ago, which computes the optimal position size for a series of trades.

Kelly Percentage = W – [(1-W) / R)

Where, W – Winning probability and R – Profit/Loss ratio

When a trader keeps a record of all their trades, they can calculate their winning probability and profit/loss ratio. Then, they can use them in the above equation to calculate the optimal position size.

Conclusion

You now know the importance of position size and its relation to drawdown. By using this, leverage can also be used appropriately to avoid blowing-up your account because of the drawdown. By doing this, you can maximize your earnings and reduce drawdown to an acceptable value.

Our suggestion for you is to use a trading strategy for a long time. If a strategy hasn’t been tried many times, the big drawdown might not have appeared yet. The bigger the history of using the strategy, the more confidence you will get to increase the lot size. Cheers!

Categories
Forex Course

26. Margin Terminologies – Unrealized P/L and Realized P/L

Introduction

In the previous lesson, the concept of balance was discussed. And in this lesson, two more terms shall be opened up, namely, unrealized P/L and realized P/L. First up, P/L is an abbreviation for Profit/Loss. Many assume that there is only one type of P/L, but this is not true. Not just in forex, in other markets as well, there exists both unrealized and realized P/L. Now, let’s begin with understanding each term with the help of examples.

Unrealized P/L

Unrealized P/L, as the name clearly suggests, is the profit or loss running in a trade that is not closed. The profit/loss in unrealized P/L constantly changes as the prices keep changing. Hence, this type of P/L is also referred to as Floating P/L.

The Unrealized P/L is calculated as follows:

Unrealized P/L = Position size x (CMP – Entry price)  [Long]

Unrealized P/L = Position size x (Entry price – CMP)  [Short]

(CMP – Currency Market Price)

This above formula gives the value in terms of pips. The value in terms of currency can be calculated by multiplying it with the pip value of the currency pair.

Example Unrealized P/L or Floating P/L

Let’s assume a trader bought 10,000 units of EURUSD at 1.4100. After a while, the price rises to 1.5000. If the trade is still running, the floating P/L can be determined, as shown.

Since this is a long trade, the following formula is applied.

Unrealized P/L = Position size x (CMP – Entry price)

= 10,000 x (1.6100 – 1.5000)

= 10,000 x (0.11)

Unrealized P/L = 1,100 pips

Hence, the trade is currently running at a profit of 1,100 pips.

Now, if the pip value for a mini lot for EURUSD is $1, the profit sums up to $1,100 (1,100 x $1).

Now, bringing the concept of balance into the picture, the balance for unrealized P/L will not get affected though the trade is in profit or loss. However, once the trade is closed, the balance does get updated.

Realized P/L

Realized P/L is the profit or loss in a trade when it closed. Realized P/L is more significant than the unrealized P/L because this is the one that brings a change to the account balance.

The realized P/L can be calculated using the below formula:

Realized P/L = Position size x (Closing price – Entry price)  [Long]

Realized P/L = Position size x (Entry price – Closing price)  [Short]

Example – Realized P/L

Let’s say a trader went long on EURUSD with 10,000 units at 1.1000. The price drops down to 1.0000. Since the current market price is lower than the entry price, it can be ascertained that the trade is running in a loss, i.e., the unrealized P/L would be negative. Later, the price jumps up to 1.2000. At this point, the trader closes the trade. Since the trade is now closed, the realized P/L can be calculated as follows.

Realized P/L = Position size x (Closing price – Entry price)

= 10,000 x (1.2000 – 1.1000)

Realized P/L = 1,000 pips

In terms of currency value, the realized P/L will be $1,000 (1,000 pips x $1). And this time, the balance will be updated as well.

Hence, this begins us to the end of this lesson. In the next lesson, another important margin terminology shall be discussed. Before you go, make sure to take the below quiz to know if you have got the concepts right.

[wp_quiz id=”49571″]
Categories
Forex Course

7. How Does Profit & Loss Take Place When You Are Trading in Forex?

Introduction

Forex is that market where buying and selling of currency pairs take place. Unlike the stock market, where you need to consider only one stock to analyze, in the forex market, you will have to examine two different currencies to trade one instrument, as instruments here are traded in pairs. Hence, the correlation between currencies plays a major role while trading a currency pair.

Understanding the Current Market Price (CMP)

The current market price (exchange rate) of a currency pair tells you the number of units of the quote currency you’re required to pay to buy one unit of the base currency. For example, let’s say the exchange rate of EURUSD is 1.1000. Here, to buy one unit of EUR, you will have to pay 1.1000 USD. So, basically, while trading a currency pair, you are buying one currency and simultaneously selling the other currency.

Extracting money from the Forex market

Our purpose in this market is to make money. And to make money (profit), understanding the relationship between the two currencies in a currency pair becomes vital. Now coming to the objective, a trader must buy a currency pair when they expect the base currency to have more potential to show strength in the future, comparative to the quote currency. Or in simple terms, to make a profit from a trade, you must go long on the currency pair when you think the base currency will increase in value relative to the quote currency. (Going ‘long’ in Forex is nothing but buying the currency pair and going ‘short’ is nothing but selling it)

Complete trade example

For instance, the CMP of USD/CAD as 1.3240. And let’s say you believe that the USD/CAD is going to drop in the near future. So, you wish to short sell this currency pair. Consider your short sold 10,000 units of USD/CAD. Here, by selling this pair, you have internally sold 10,000 US Dollars and bought the equivalent Canadian Dollars (10,000 USD * 1.3240 = 13,240 CAD). After some days, you see that the prices have dropped to 1.3180. Now, since the value of this currency pair has changed, the 10,000 US Dollars in CAD will be turn out to be, 10,000 USD * 1.3180 = 13,180 CAD. Now, when you sell this currency pair at the CMP, you will actually be buying 10,000 USD and selling 13,180 CAD.

In the above example, let us see if you made a profit or a loss. Initially, you had sold 10,000 USD to buy 13,240 CAD. At this point, you are sitting with 13,240 CAD. Later, you bought back that 10,000 USD, and you paid (sold) just 13,180 for it. That is, you are still left with 60 CAD (13,240 – 13,180) with you.

Hence, you made a profit of 60 CAD ( which is ~45 USD).

Quick cheat sheet

When you buy a currency pair (buy – base currency, sell – quote currency), you need the price of the currency pair to appreciate in value.

Conversely, when you sell a currency pair (sell – base currency, buy – quote currency), you need the price of the currency pair to depreciate in value.

Now let’s check if you understood the concepts right by answering the below questions.

[wp_quiz id=”44276″]