Overview
Gold continues on the fifth consecutive week of consolidation. The pattern is developing a contracting triangle which remains incomplete. The internal structure observed in this consolidation pattern suggests a limited upside before completing the corrective formation in progress.

Market Sentiment Overview
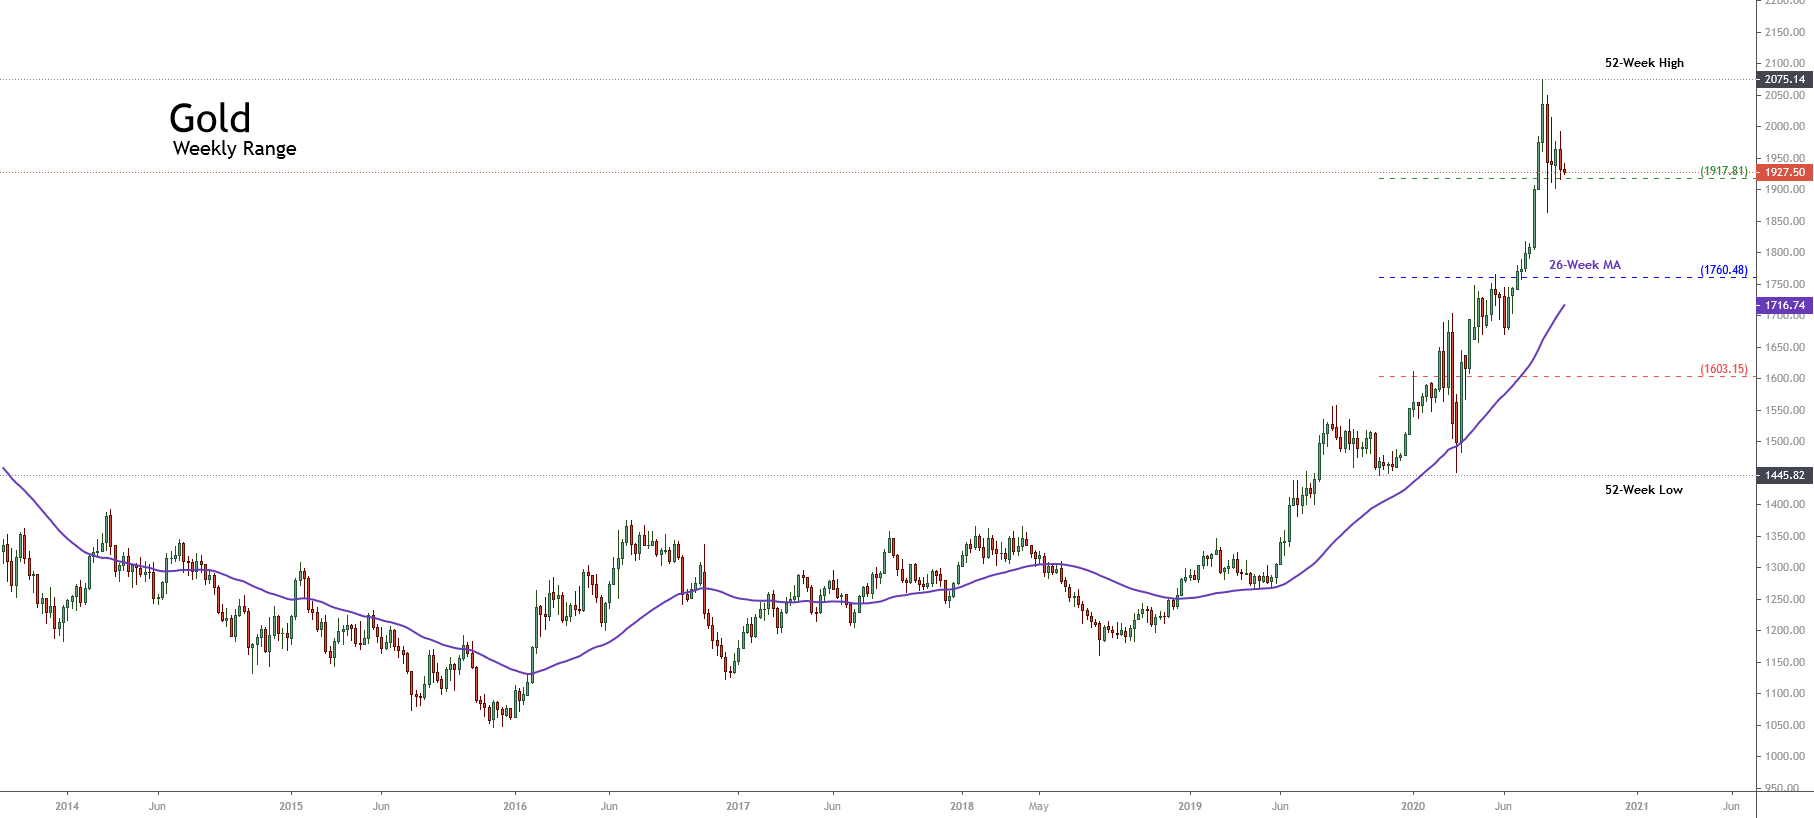
The price of Gold continues moving sideways by the fifth week in a row, testing the support on the extreme bullish sentiment zone of the 52-week high and low range. Although the precious metal eases 7.5% from its all-time high at $2,075.14 per ounce to date, the yellow metal report gains over 27.7% (YTD).
The following chart presents the yellow metal in its weekly timeframe. In it we distinguish the price movement testing the extreme bullish zone support located at $1,917.81 per ounce. This market condition leads us to expect a new decline for the coming trading sessions, finding support in the 26-week moving average, which currently moves in the $1,850.10 per ounce.
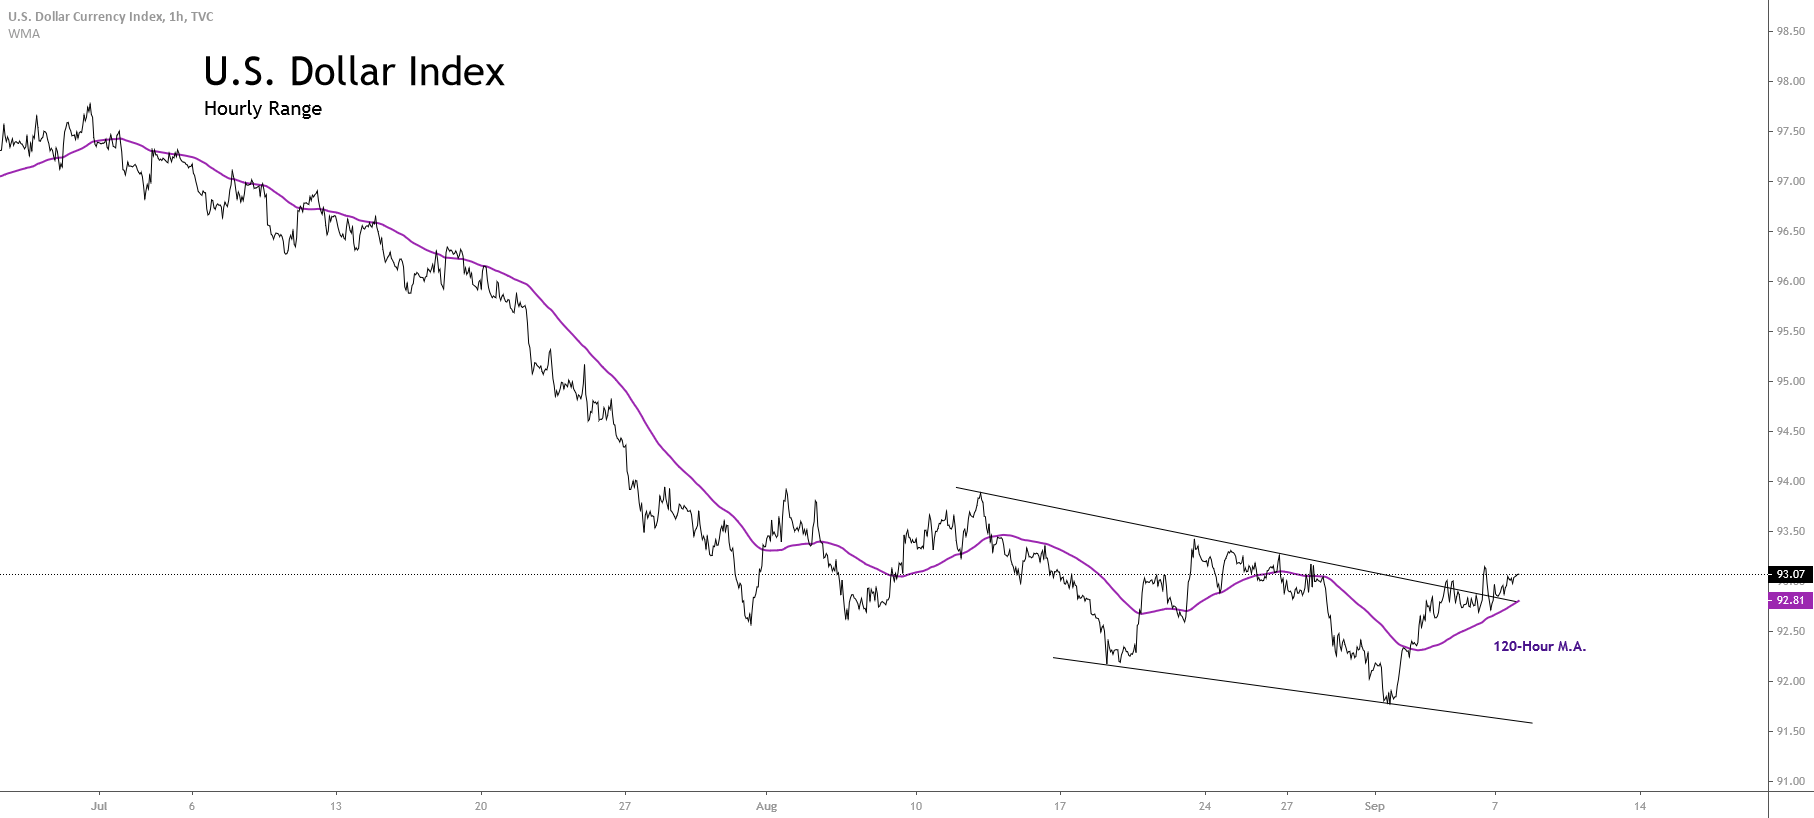
The potential decline in Gold’s price is backed by the strength of the U.S. Dollar Index, shown in the next intraday chart. In the figure, we observe the Greenback showing recovery signals moving above the 120-hour moving average.
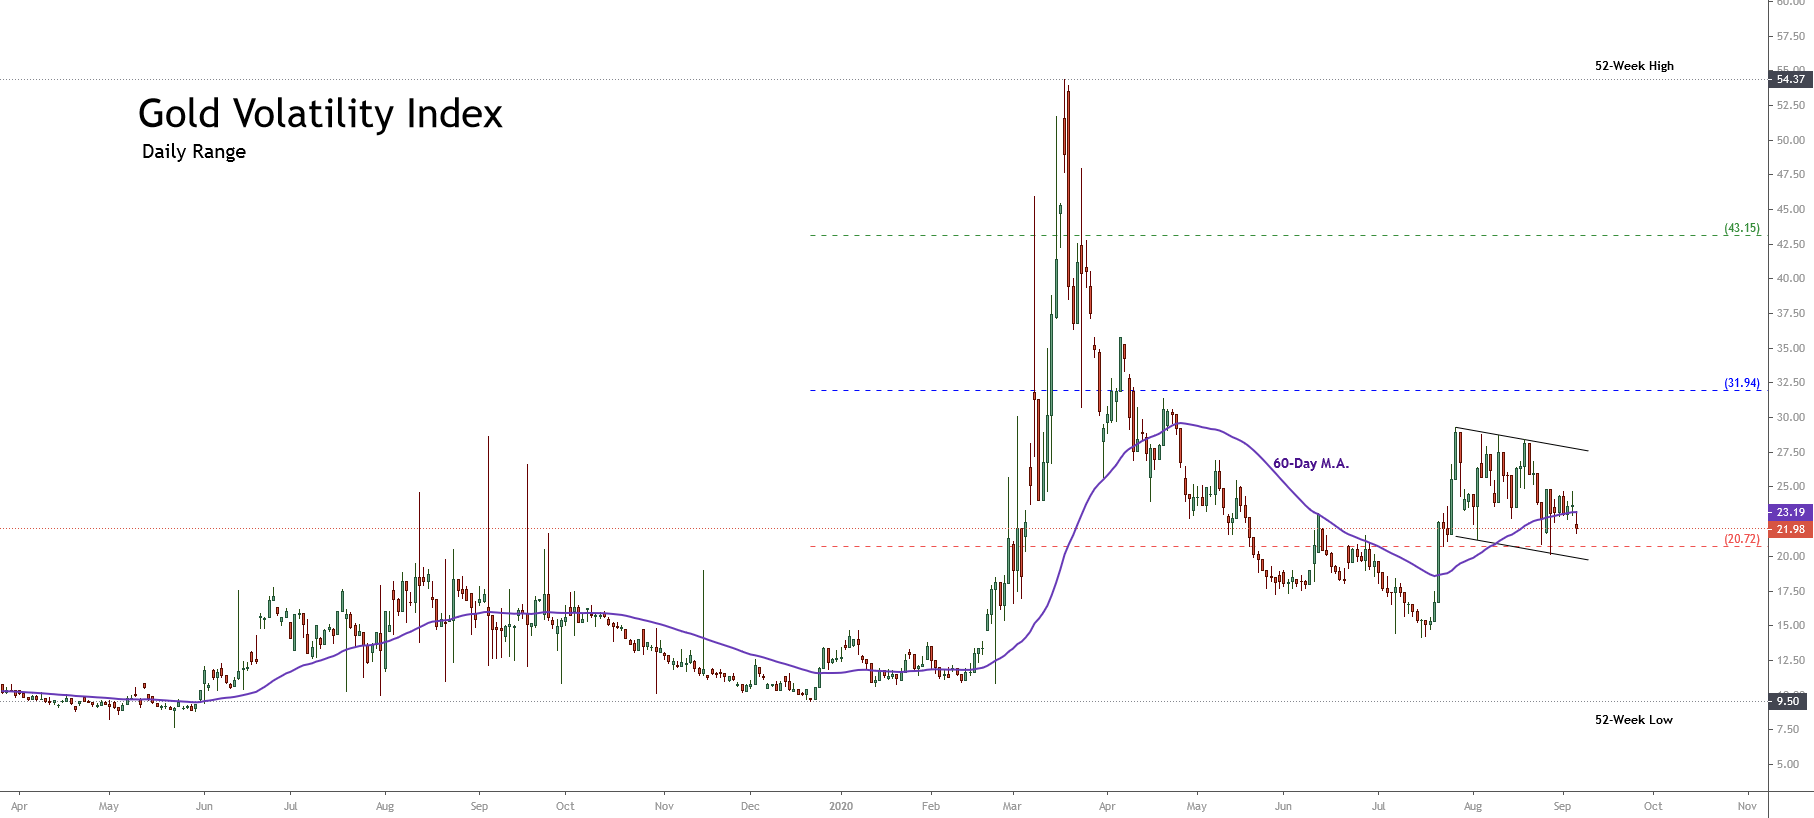
On the other hand, the Gold Volatility index continues consolidating in a flag pattern. As discussed in our previous analysis, the current sideways movement, in progress, converges with gold’s consolidating formation, suggesting a new decline in the valuation of the precious metal.
Summarizing, the market sentiment for the yellow metal reveals the exhaustion of the extreme bullish sentiment that dominated the market participants’ activity until early August when the yellow metal reached its record high at $2,075.14 per ounce. At the same time, the recovery signals unveiled by the U.S. Dollar Index lead us to expect further declines in the precious metal.
Elliott Wave Outlook
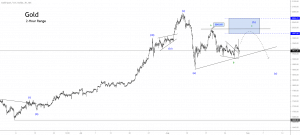
The short-term Elliott Wave perspective for the yellow metal illustrated in the following hourly chart reveals a consolidation formation identified as an incomplete contracting triangle pattern.
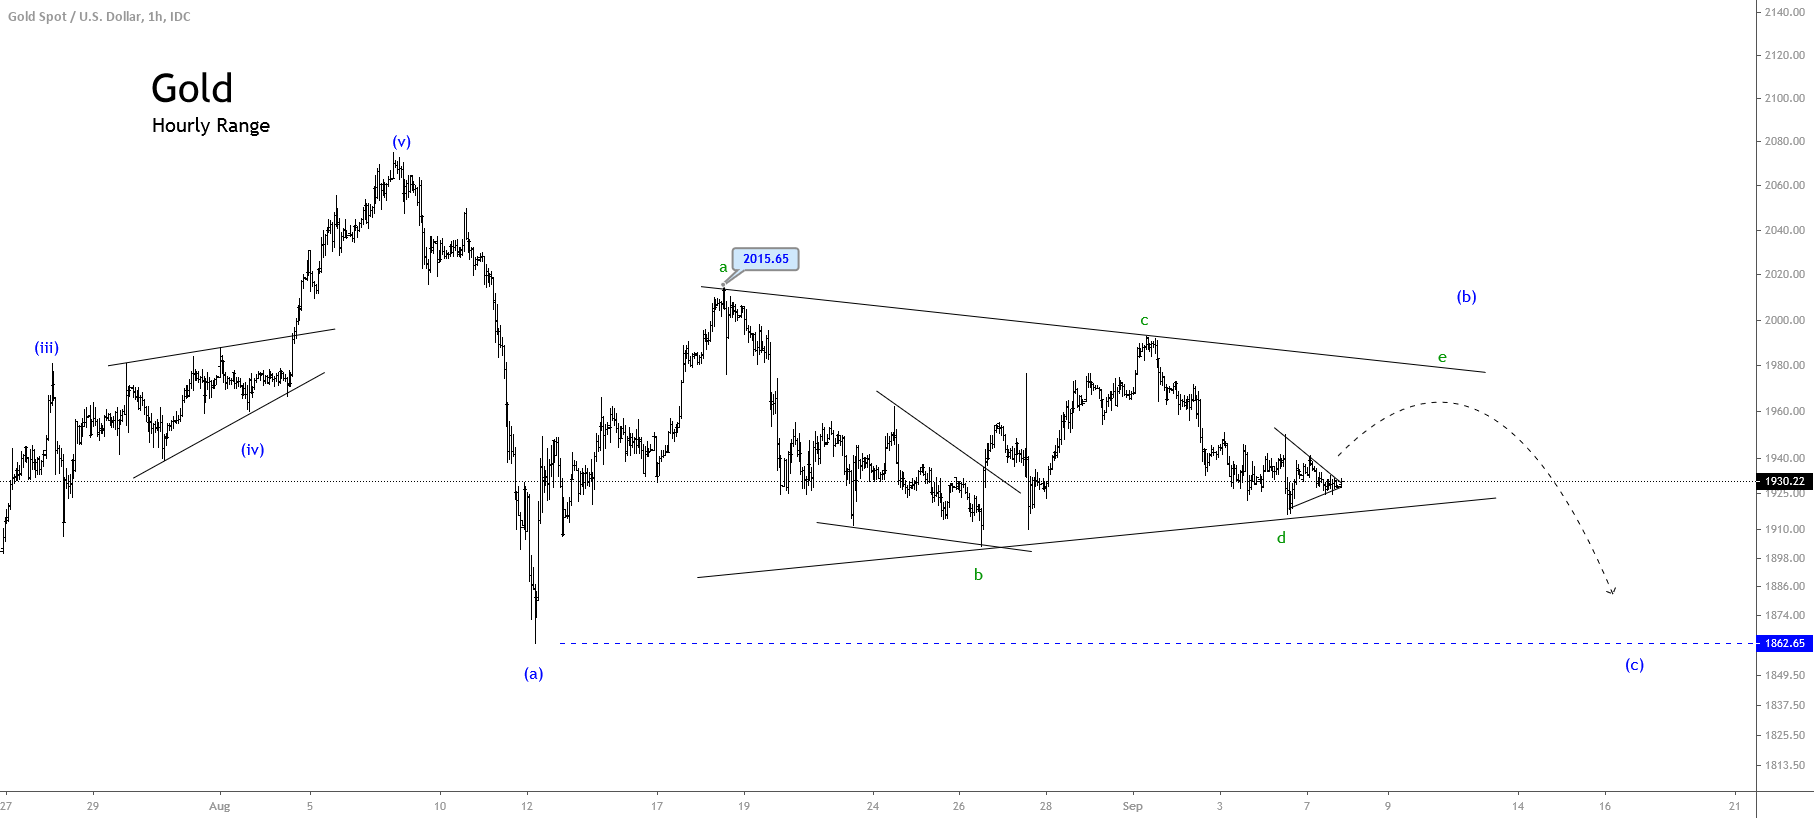
In the hourly chart, we recognize the price action advancing in an incomplete corrective structural series, which began after the yellow metal topped at $2,075.14 per ounce from where the golden metal started to find sellers. The first decline corresponding to wave (a) of Minuette degree identified in blue found support at $1,832.62 per ounce. This bearish aggressively-looking leg alternates with wave (b), which still remains in progress.
The incomplete wave (b) in progress follows the internal sequence of a contracting triangle pattern, which currently ended its wave d of Subminuette degree labeled in green. According to the Elliott wave theory, the price should develop a marginal advance completing a wave e, in green, before continuing its bearish path. The limited upward move expected corresponds with the potential decline foreseen in the Gold Volatility Index, which shows a consolidation in the form of a flag pattern.