Overview
The Gold price continues developing a sideways movement, which corresponds to an incomplete corrective structure that is still incomplete. Although there is an extreme bullish sentiment among market participants, the price of the golden metal could be poised to a decline in the following trading sessions.
Market Sentiment Overview
Gold prices continue moving sideways, consolidating above the psychological barrier of $1,900. The precious metal gains of over 28% (YTD) were boosted by the US Dollar weakness, which has dropped 5.47% (YTD) so far.
Gold, in its weekly timeframe, illustrates the market sentiment of the precious metal exposed by its 52-week high and low range. In the chart, we currently distinguish the market action moving mostly sideways, on the extreme bullish sentiment zone. The indecision candle that the yellow metal developed leads us to observe a state of equilibrium between the market participants.

On the other hand, looking at the volatility of the precious metal (GVZ) exposed in its daily chart, we observe the price action is consolidating in a flag pattern in the bearish sentiment zone. At the same time, we highlight the bounce GVZ developed from the extreme bearish sentiment zone toward the bearish zone in which currently is consolidating. We see that GVZ, moving above its 60-day moving average, shows an improvement in the investors’ sentiment.
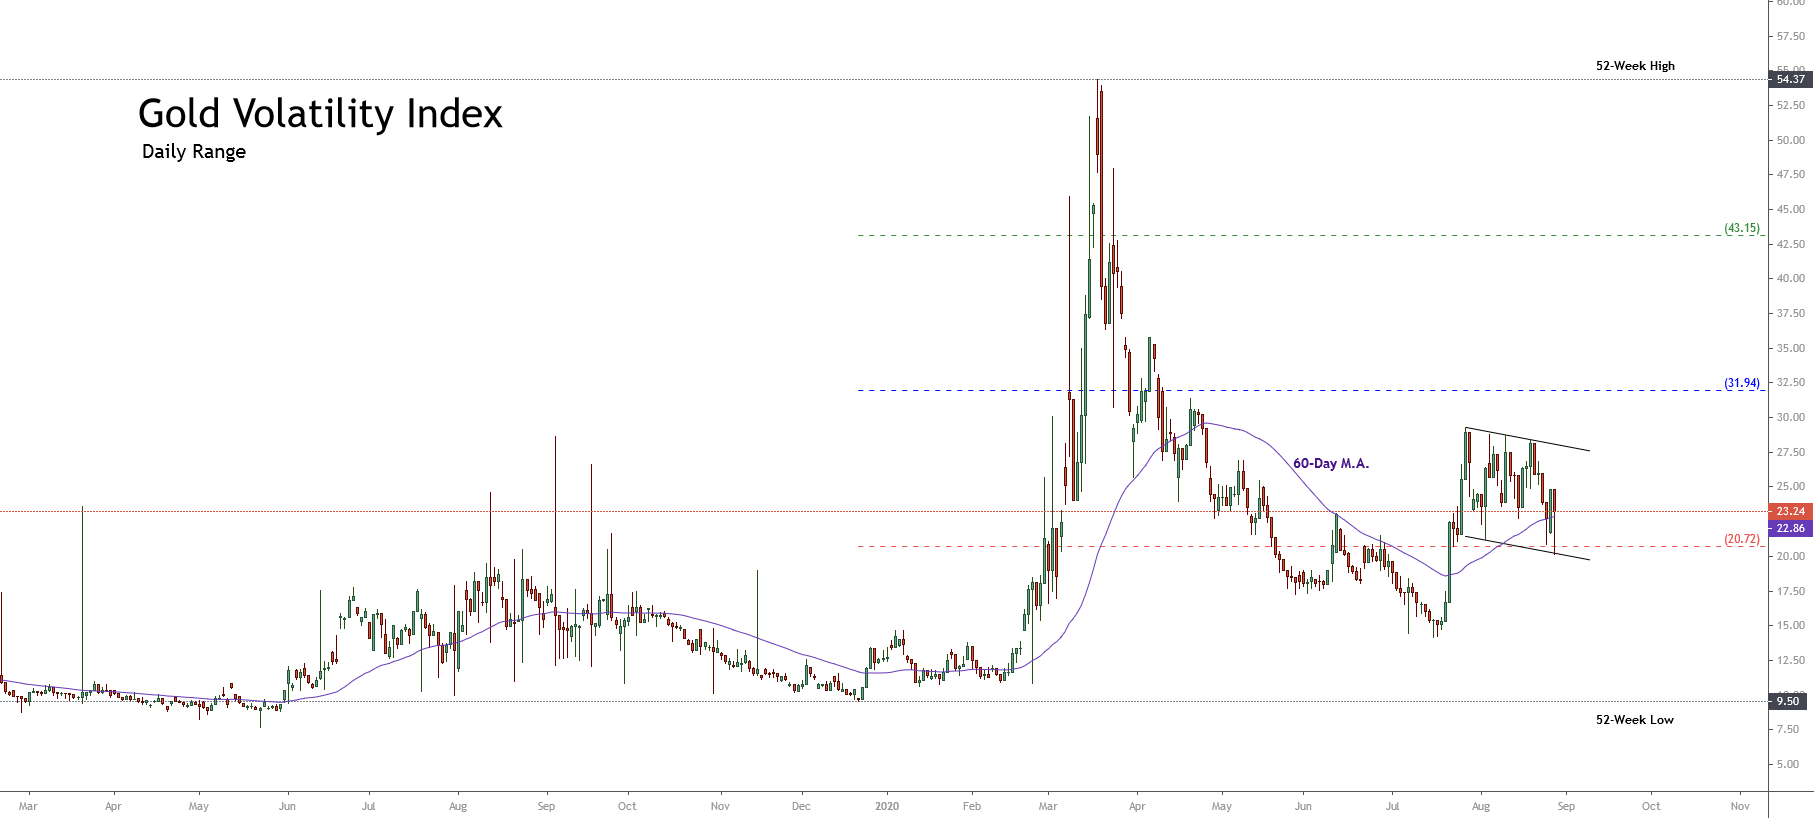 The current market context observed in the Gold Volatility Index, which is consolidating creating a flag formation, added to Gold’s retesting of $1,917.81 per ounce, corresponding to the support of the extreme bullish sentiment zone, leads us to expect a new decline in the price of the yellow metal.
Elliott Wave Outlook
The short-term outlook under the Elliott wave perspective and illustrated in its 2-hour chart exposes the sideways movement evolving an incomplete corrective structure, after the yellow metal touched its all-time high at $2,075.14 per ounce, reached on August 06th.
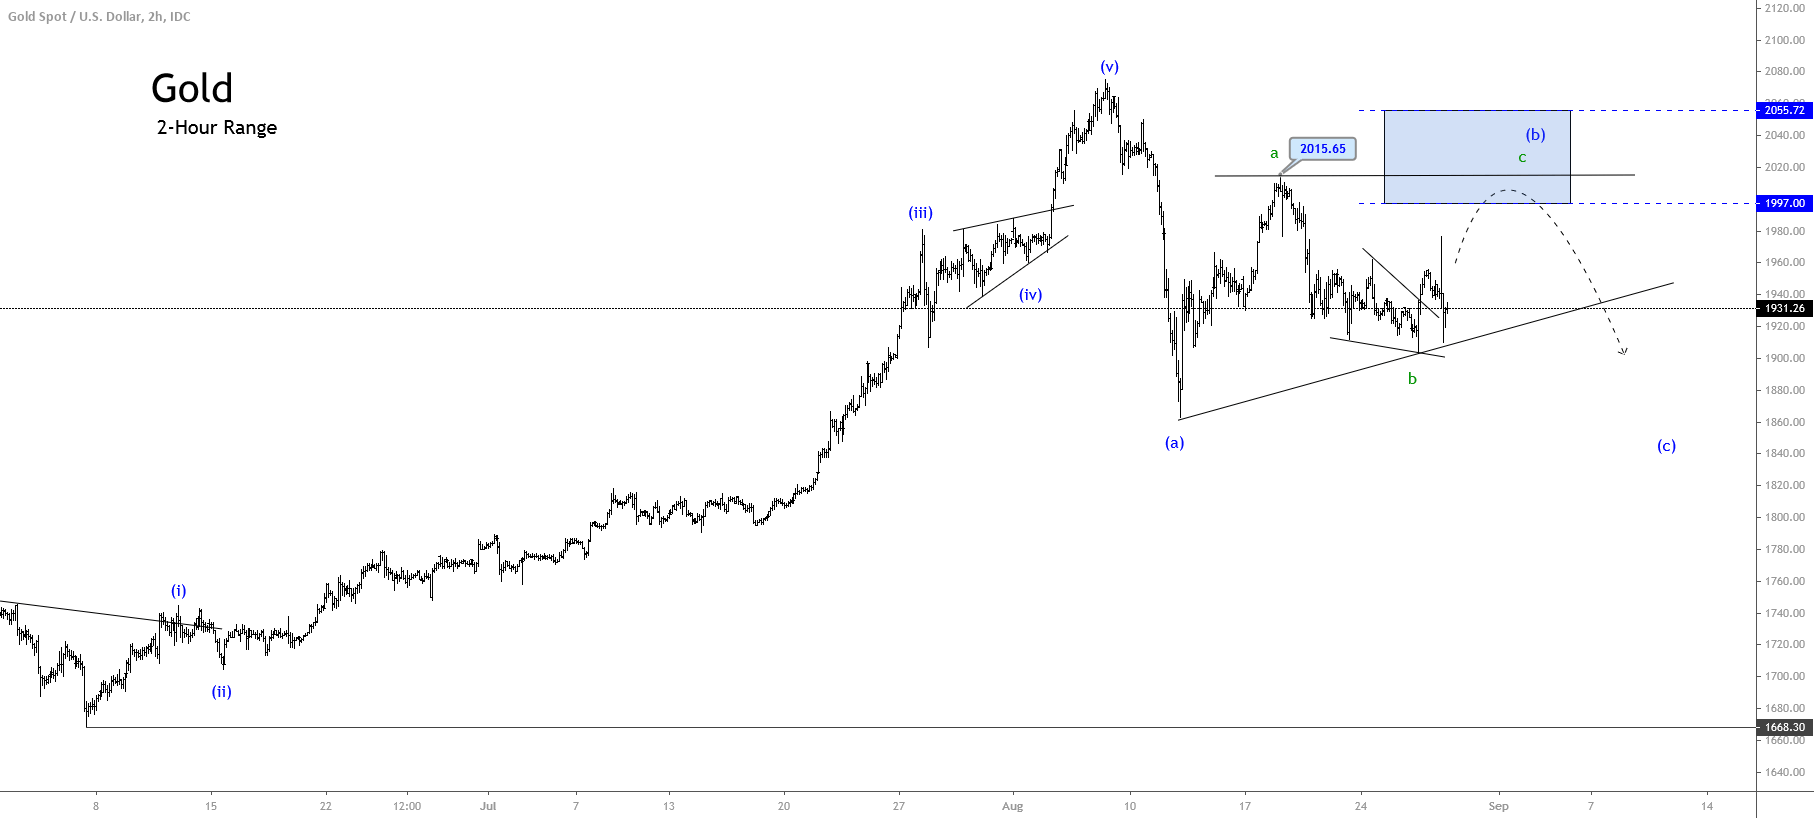
Once the precious metal topped at $2,075.15 per ounce, Gold completed its fifth wave of Minuette degree, and it is drawing a corrective sequence that remains incomplete. In the previous figure, we distinguish the aggressively developed first downward leg. This fast movement drove the yellow metal to ease over 10%, finding a bottom at $1,862.32 per ounce. That gave the pass to the wave (b), identified in blue, which remains in development.
The second leg of the incomplete three-wave sequence completed its first wave of a lesser degree at $2,015.65 per ounce, starting to retrace with a lower momentum. This decelerated movement observed in the wave b of Subminuette degree, identified in green, drives us to verify the alternation principle stating that a fast move should alternate with a slow movement.
For the coming trading sessions, we expect an upward movement that would complete the wave c of Subminuette degree, in green, which at the same time would end the wave (b) in blue. Once this wave ends, the price should start to decline in a five-wave sequence corresponding to wave (c) of Minuette degree, labeled in blue. This downward scenario agrees with the potential upside observed in the Gold Volatility Index chart.