
Market Overview
The AUDUSD pair during the overnight trading session will be driven by October’s employment data, to be released by the Australian Bureau of Statistics in a few hours. The analysts’ consensus expects an increase of 7.1% in the unemployment rate (YoY), representing a deterioration in the labor market conditions and a rise over the 6.9% reported in September.
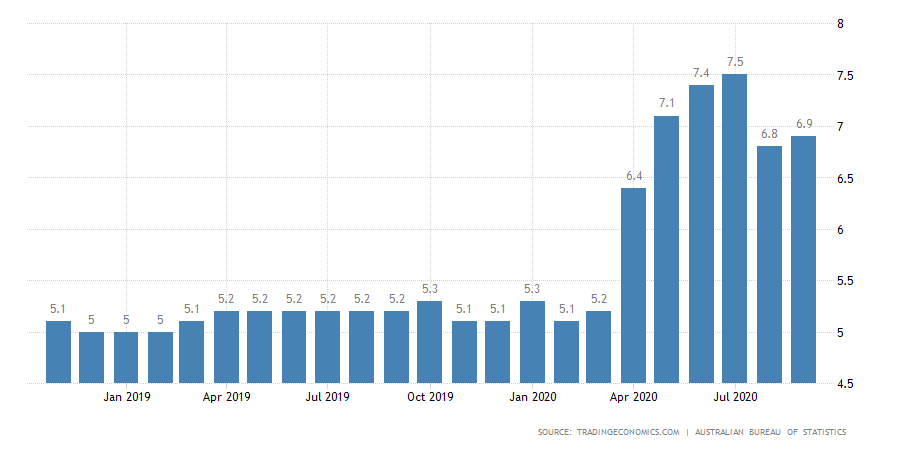
The unemployment rate jumped from 5.1% in January to 7.5% in August during the current year. In this context, the Governor of the Reserve Bank of Australia (RBA), Philip Lowe, confirmed the change in the focus from inflation rate to labor market conditions, which according to Governor Lowe, would face “an extended period of higher unemployment than we have become used to.”
On the other hand, the next 8-hour chart illustrates the market participants’ sentiment unveiled by the 90-day high and low range, where the price action looks testing the extreme bullish sentiment zone support located at 0.73009.
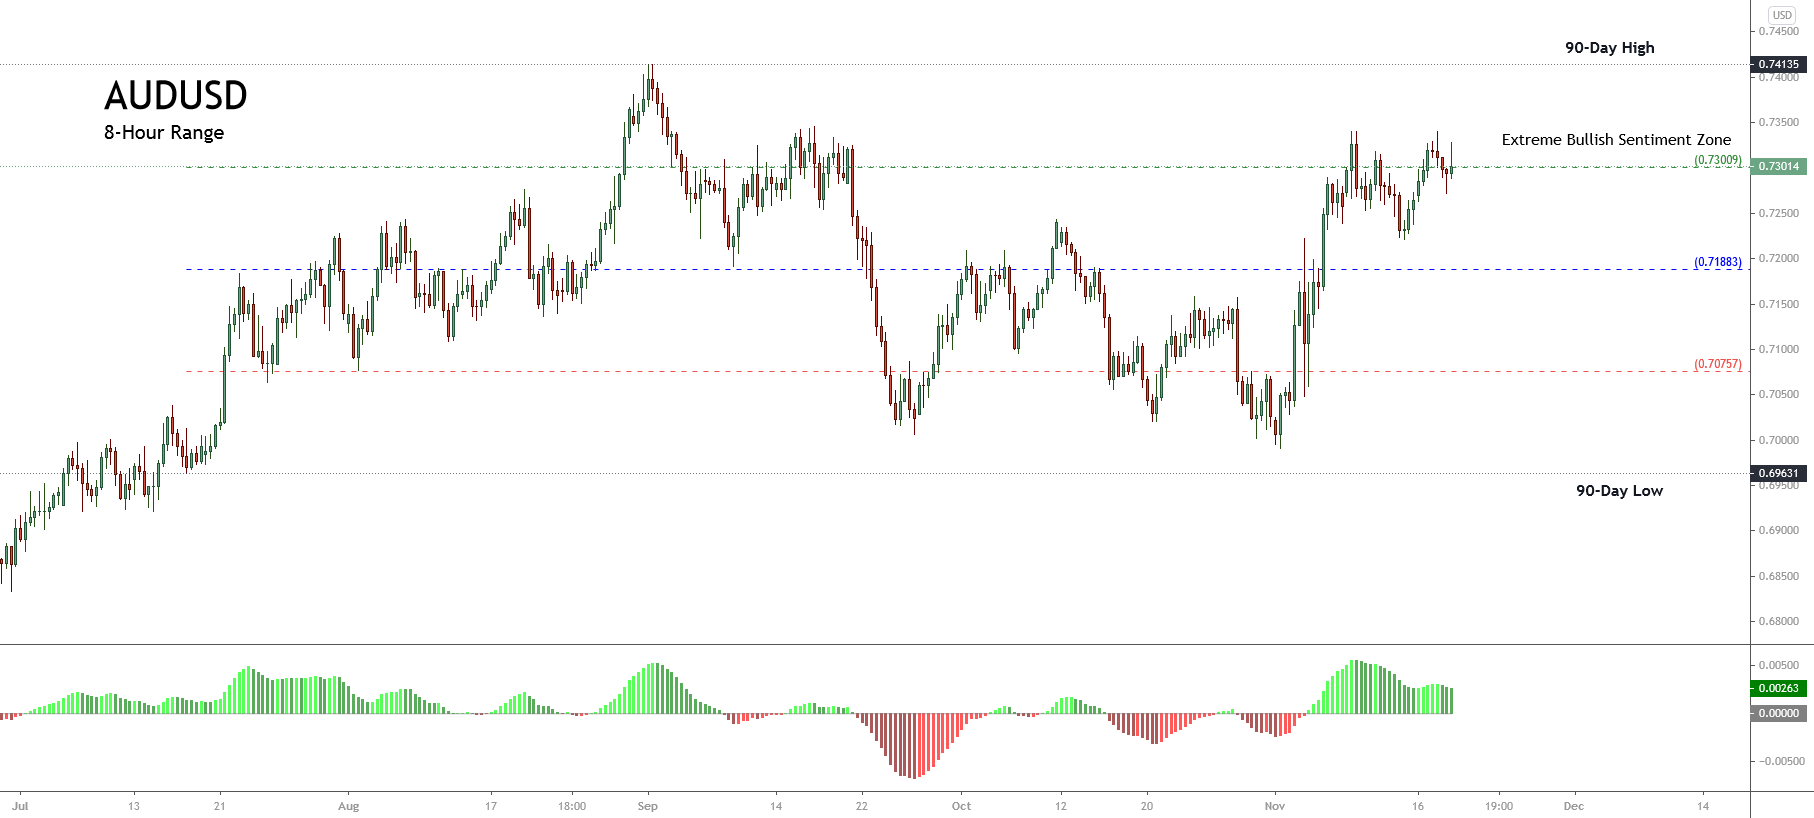
Likewise, the Aussie advances in a sideways movement. We can see that, after reaching its yearly high at 0.74135, the Aussie was dragged toward the extreme bearish sentiment zone, where the Australian currency bounced back to the extreme bullish sentiment.
Currently, the re-test of the recent intraday high at 0.7335 leads us to expect further upsides in the following sessions, likely to head to its early September highs at 0.7400.
Short-term Technical Outlook
The short-term Elliott Wave view exposed in the next 8-hour chart reveals the sideways advance in an incomplete flat pattern of Minuette degree identified in blue, which, according to the Elliott Wave theory, follows an internal sequence subdivided into 3-3-5. This corrective pattern in progress belongs to the fourth wave of Minute degree labeled in black.
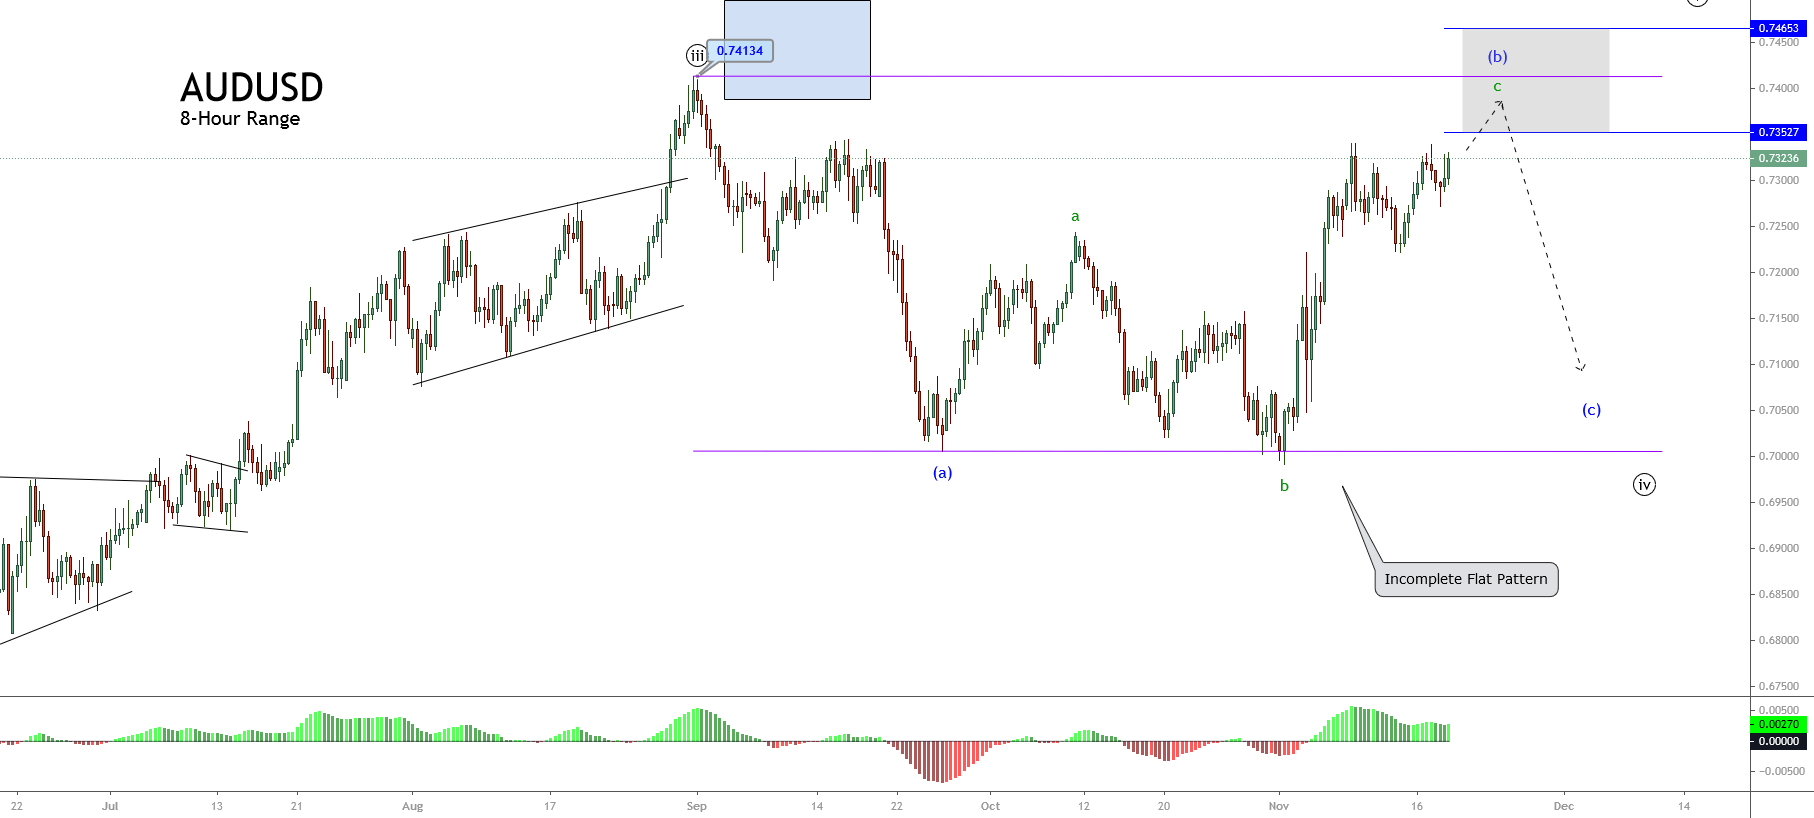
The previous figure shows the current wave (b) in blue, which began on September 25th on 0.70059. The end of wave b of Subminuette degree identified in green pierced the origin of wave a. That leads us to consider the possibility that the current corrective formation could correspond to an expanded flat pattern.
Finally, the current incomplete movement corresponding to wave c in green could advance to the potential target area between 0.7352 and 0.7465. If the price action doesn’t surpass the level 0.7352, then the price could test the sideways channel’s previous lows.
The alternative scenario is if the price breaks above the 0.74134 level, climbing until 0.7465. Thar means the bullish pressure is strong. In that case, the next decline corresponding to wave c in blue will likely be weaker, ending in a region under 0.71, but no further than 0.70.