
The EURJPY cross advances in a long-term consolidation structure, which began in early December 2016. The short-term Elliott wave view predicts a limited decline in the following trading sessions.
Market Sentiment
The EURJPY cross closed the last trading week, cutting Monday’s session gains when the cross jumped from 122.835 until 125.136, mainly supported by the stock market’s post-election rally.
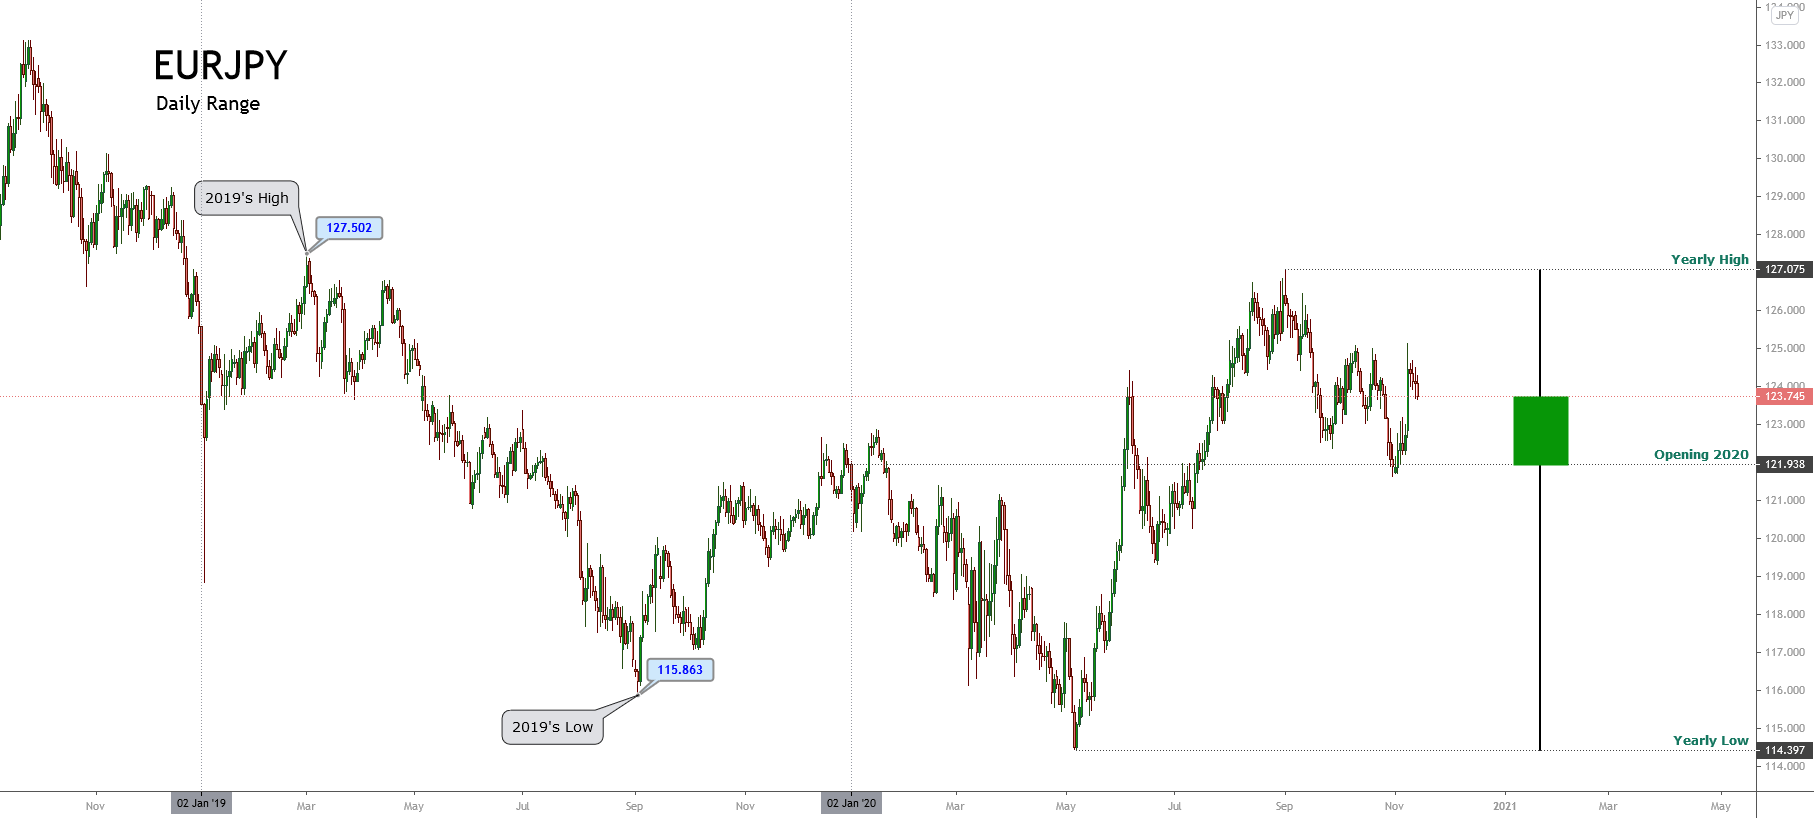
The following figure shows the EURJPY in its daily timeframe, revealing the mid-term big-market participants’ sentiment exposed by the 90-day high and low range. In this context, the cross is entering into the bearish sentiment zone. However, the 60-day weighted moving average still doesn’t confirm the short-term bearish bias.

After a rally that carried the cross to advance over 11% since May 07th (when the EURJPY bottomed on 114.397 and then soared, reaching the highest level of the year at 127.075 on September 01st), the cross began to retrace, turning its mid-term market sentiment from extremely bullish to bearish.
Nevertheless, the price action still doesn’t confirm the bearish sentiment. In this regard, the short-term sentiment remains neutral until the price confirms the bias.
Technical Overview
The big picture of EURJPY illustrated in the following daily chart exposes a long-tailed yearly candlestick mostly bullish. However, the upper shadow hints at a bearish pressure near the psychological barrier of 127. Moreover, the next resistance is placed at 127.502, which corresponds to the high of 2019.
The EUJPY long-term trend under the Dow Theory perspective and exposed in the next log scale weekly chart reveals the primary trend identified in blue that remains slightly bullish.
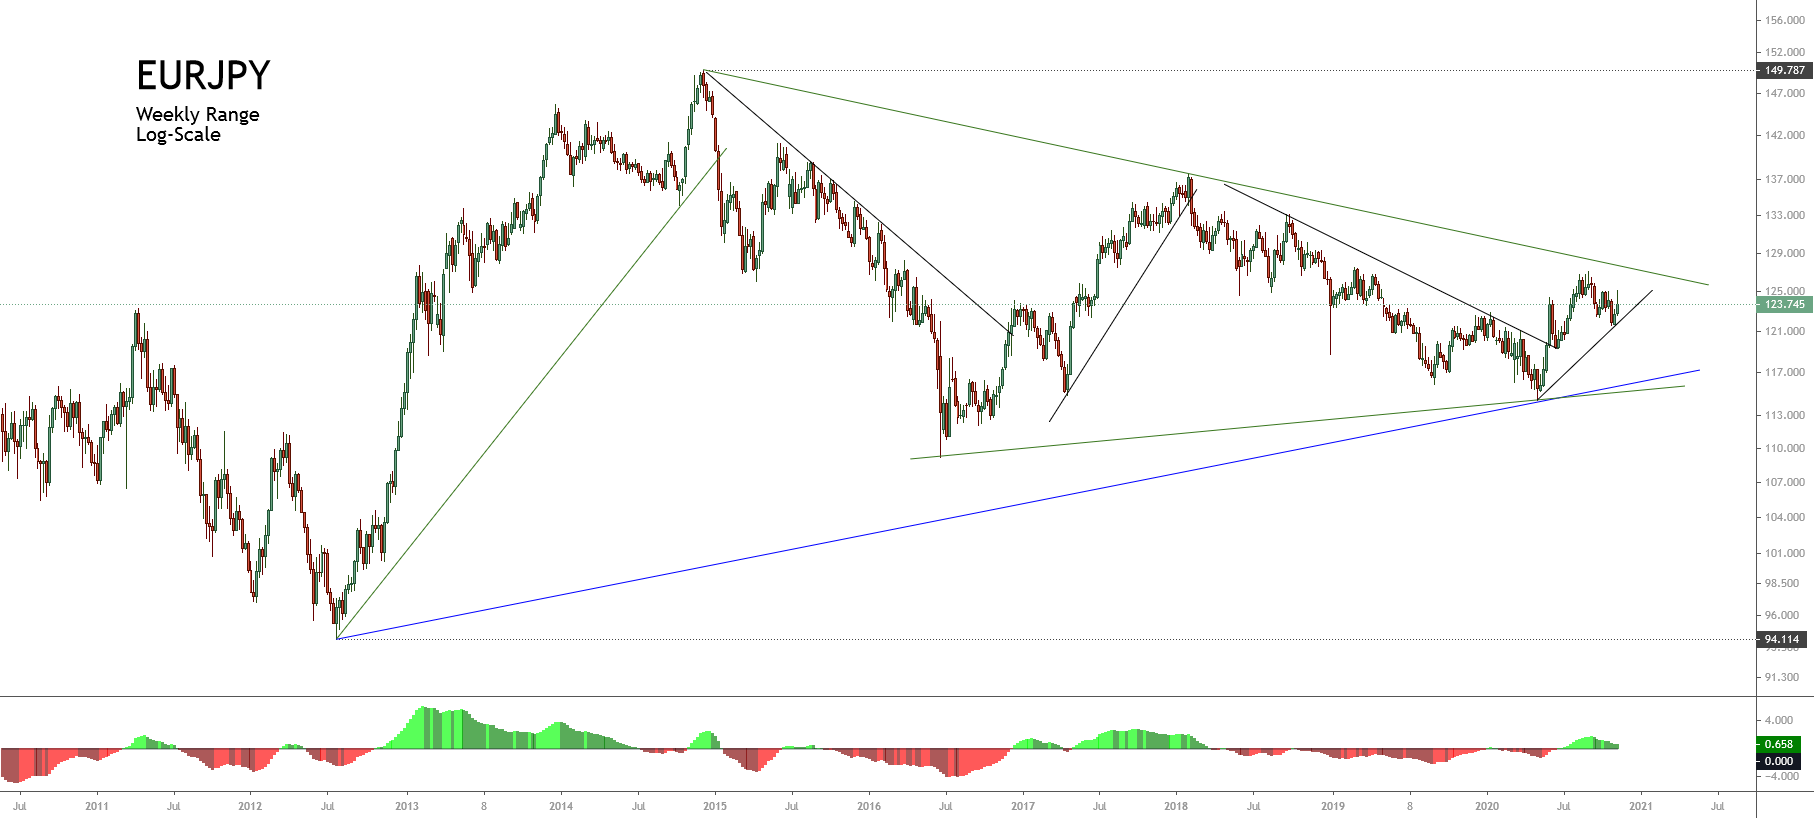
At the same time, the secondary trend exposes the sideways movement developing as a pennant pattern, which began in early December 2016 when the price found resistance at 149.787 and could break soon.
According to the classic chartist theory, the pennant pattern is a technical figure that calls for the continuation of the previous movement. In this case, the pennant could resume the rally developed since late July 2012 at 94.114 ended at 149.787 in early December 2014.
Short-term Technical Outlook
The short-term Elliott wave view for EURJPY shows in its 12-hour chart advancing in an incomplete corrective sequence that began on May 06th at 114.397, where it completed its wave A of Minor degree labeled in green.
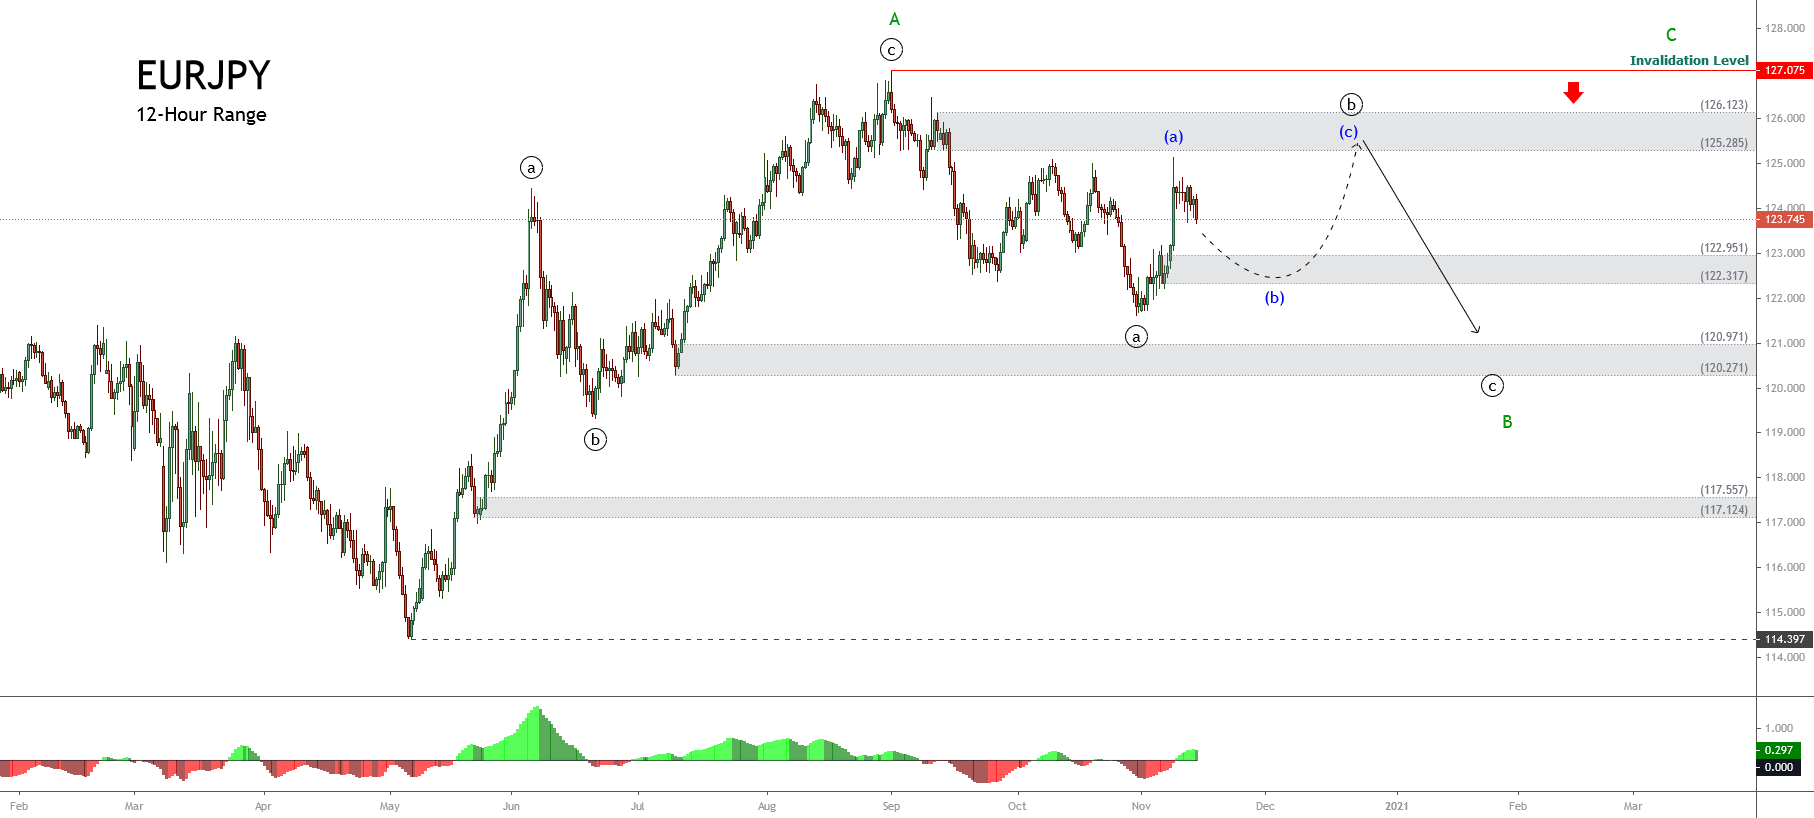
Once the price found fresh sellers at the highest level of the year, the cross started to advance in its wave B, still in progress. In this context, the previous chart unveils the intraday upward sequence corresponding to the incomplete wave ((b)) of Minute degree identified in black.
The price action could boost the cross until the next supply zone, located between 125.285 and 126.123, where the EURJPY could start to decline in an internal five-wave sequence corresponding to wave ((c)), in black, that may drop to 120.271, though, the price could extend its drops until 117.124.
The short-term bearish scenario’s invalidation level locates above the end of wave A in green at 127.075.