Overview
Russell 2000 advances on the first trading session of the week, reporting gains over 2.6%. The market sentiment reveals to us the penetration in the extreme bullish sentiment zone, supporting the possibility of fresh upsides. In this regard, the Elliott Wave structure exposes an incomplete bullish structure supporting the likelihood of further rises.

Market Sentiment Overview
Russell 2000 advances over 2.6% in the first session of the week, easing the bearish sentiment that dominated the previous two weeks sell-off in where the U.S. index that groups to the 2,000 small capitalized companies plummeted over 5%.
The big picture of Russell 2000 exposes a divergence with the S&P 500. From the following weekly chart, we distinguish to Russell 2000 without confirming the S&P 500 record high at 3,588.8 pts reached on September 02nd. According to the Dow Theory, the fresh highs must be confirmed, and divergence must be considered an exhaustion or reversal signal of the current bull market. In this case, Russell 2000 remains without confirming the last record high reached by the S&P 500.
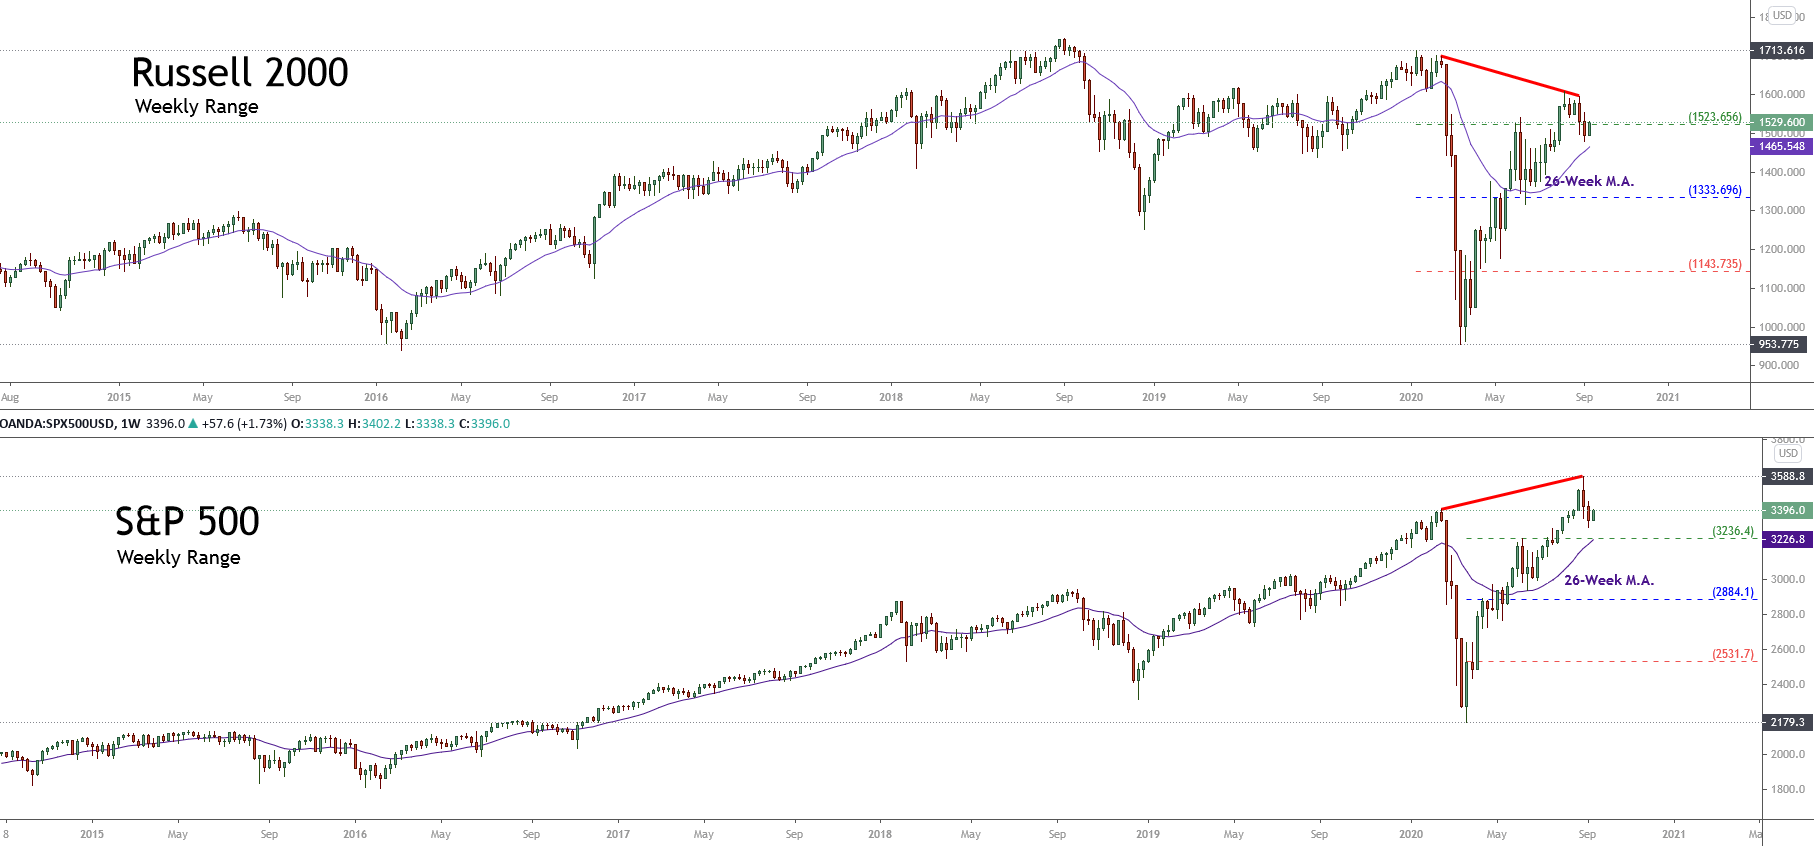 Although both indices move above the 26-week moving average, indicating the upward bias on the stock market, the S&P 500 remains moving in the extreme bullish sentiment zone while the Russell 2000 looks bouncing toward the extreme bullish sentiment zone. This market context carries us to expect for Russell 2000 the possibility that the price visits fresh highs, even surpassing the 1,600 pts.
The next daily chart of Russell 2000 unveils the price action bouncing from last July’s previous consolidation zone. The bullish reaction developed by the Russell leads us to foresee further upsides in the following trading sessions.

Simultaneously, the Fear & Greed index looks moving below level 50, which corresponds to the “fear zone.” This lecture added to the bearish sentiment of news media, leads us to expect a bullish reversal move.
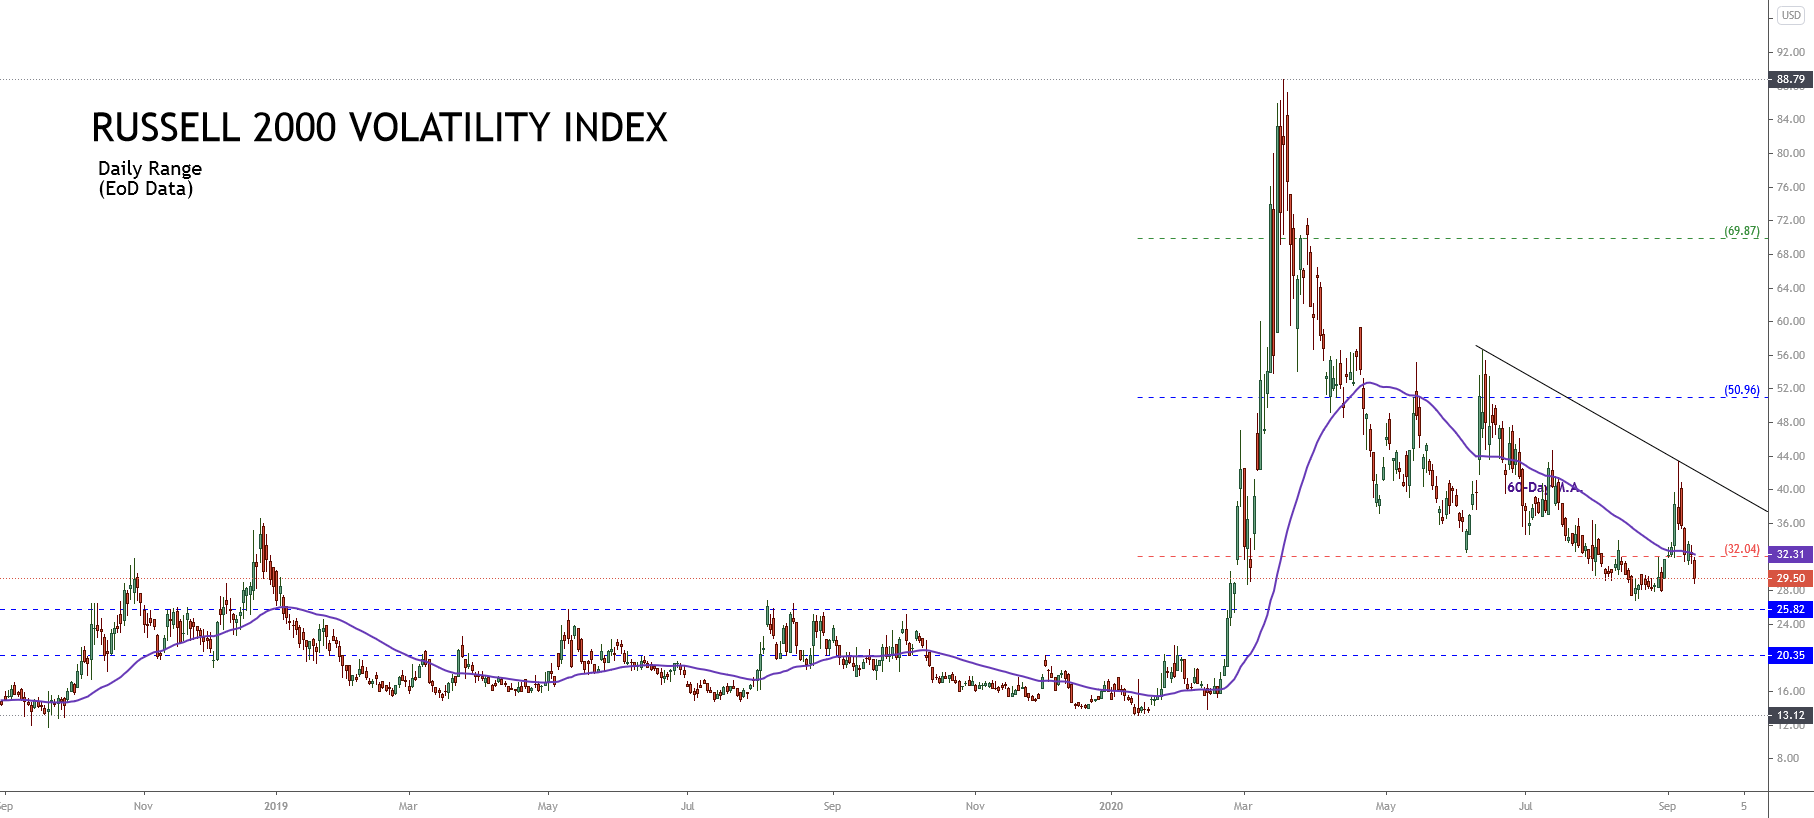
Regarding the volatility side, the Russell 2000 Volatility Index reveals the extreme bearish sentiment zone penetration. This decline confirms the possibility of further declines to the area between 25.82 to 20.35, from where the price could find support.
In consequence, considering the penetration to the extreme bullish sentiment zone of Russell 2000 and the lowest level observed in the Russell 2000 Volatility Index, we expect fresh upsides in the U.S. stock market.
Elliott Wave Outlook
The short-term outlook under the Elliott wave perspective of Russell 2000 illustrates the advance on an incomplete five-wave sequence, which began on July 10th when the U.S. index found fresh buyers at 1,376.67 pts, starting the current bullish cycle that remains in progress.
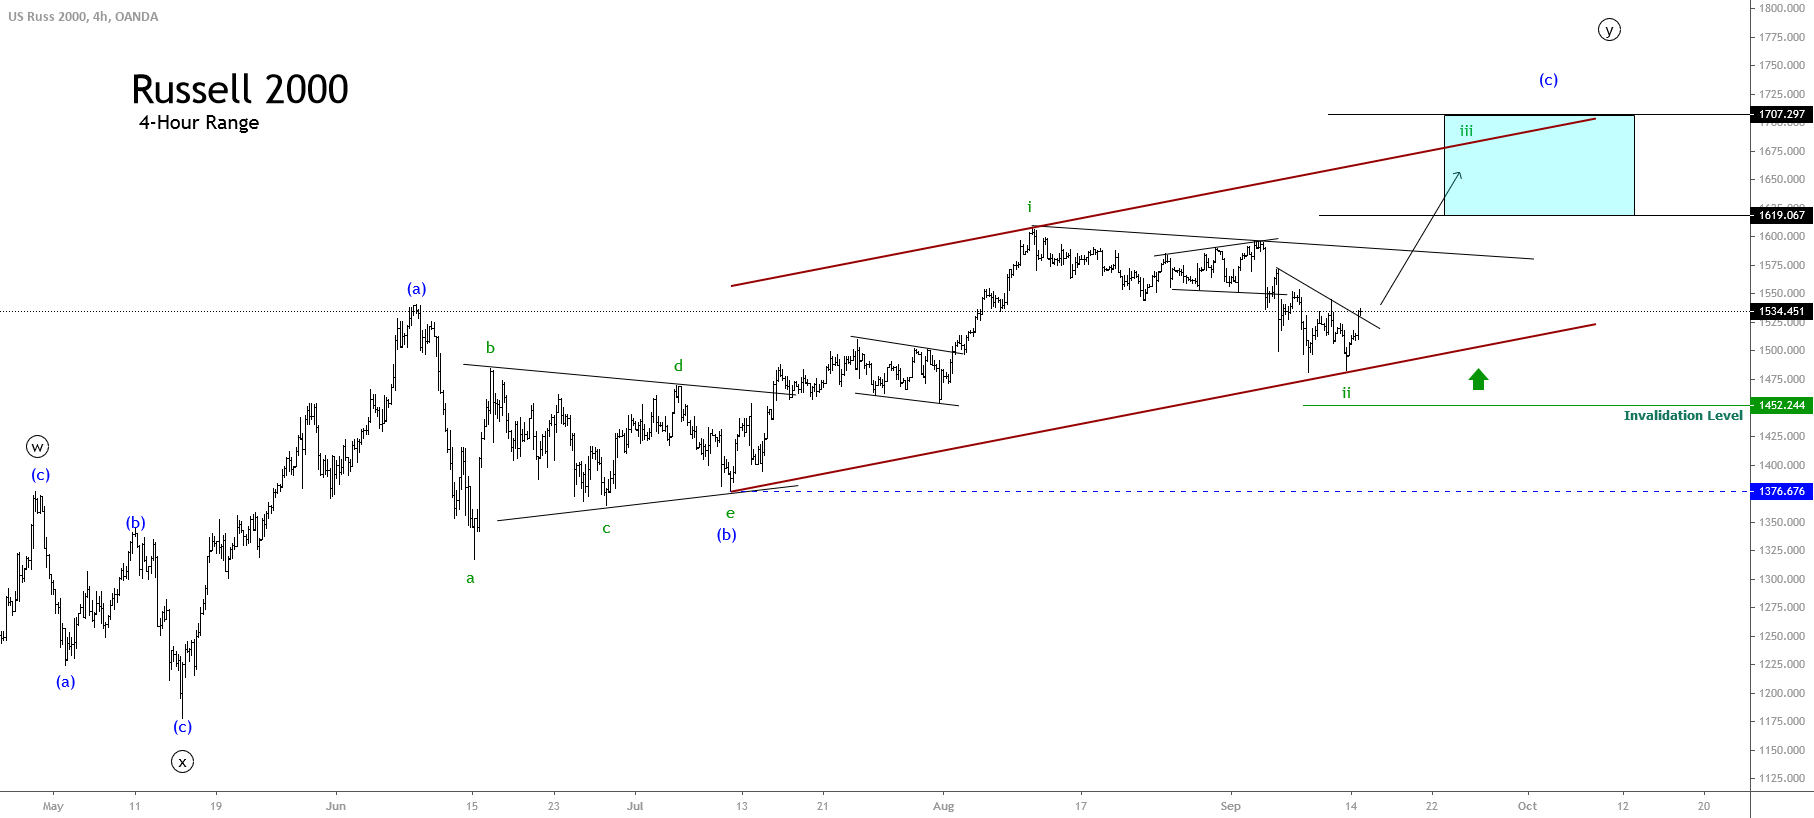
From the 4-hour chart, we distinguish the completion of the second wave of Subminuette degree labeled in green. According to the Elliott wave theory, the canalization with its base-line from the end of wave (b) of Minuette degree identified in blue as the origin to wave ii in green and projected until the end of the first wave of the same degree should provide the target of the third wave. In this context, the potential third wave could advance to 1,617.06 and extend 1,707.29 pts.
Finally, the bullish bias confirmation will occur if the price closes above the last intraday descending trendline. At the same time, the current upward scenario will remain active while the Russell 2000 index keeps moving above 1,452.24 pts.