
The cryptocurrency sector has mostly been in the green in the past 24 hours, with Bitcoin leading the way towards the upside. Meanwhile, most of the tokens that ended up in the red on the daily were Ethereum (mostly DeFi) tokens. Bitcoin is currently trading for $10,763, which represents an increase of 4.09% on the day. Meanwhile, Ethereum gained 3.41% on the day, while XRP gained 2.42%.

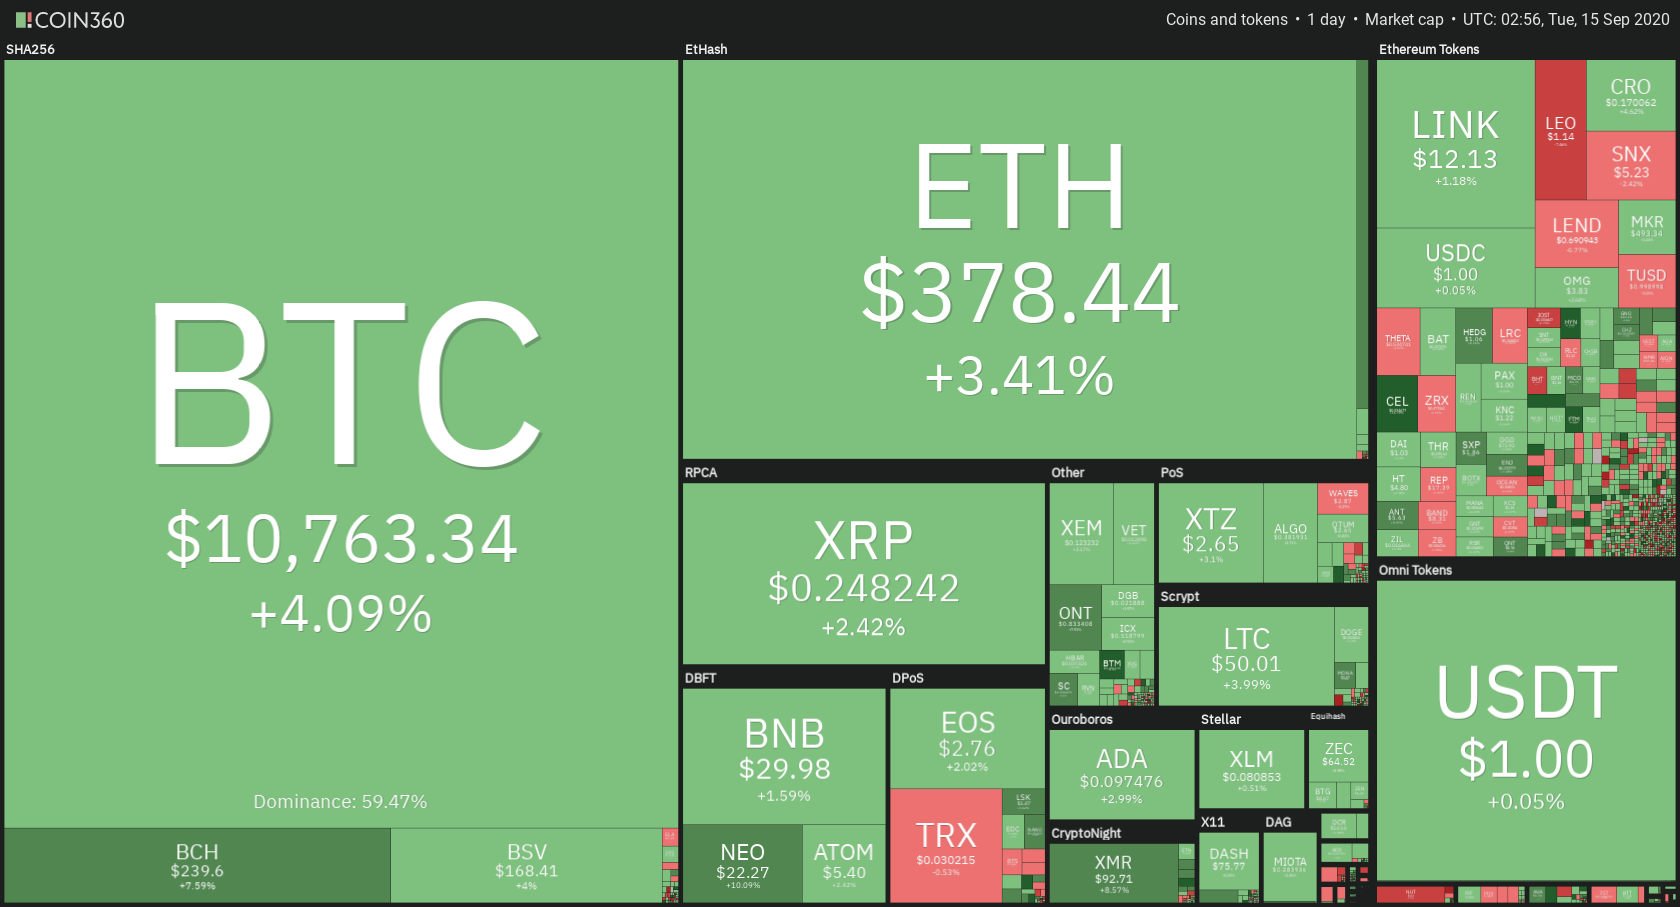
Daily Crypto Sector Heat Map
If we take a look at the top100 cryptocurrencies, Hyperion gained 51.28% on the day, making it the most prominent daily gainer. NXM (40.86%) and Bytom (18.97%) also did great. On the other hand, the UNUS SED LEO lost 6.72%, making it the most prominent daily loser. It is followed by Waves’ loss of 6.35% and Band Protocol’s loss of 5.57%.
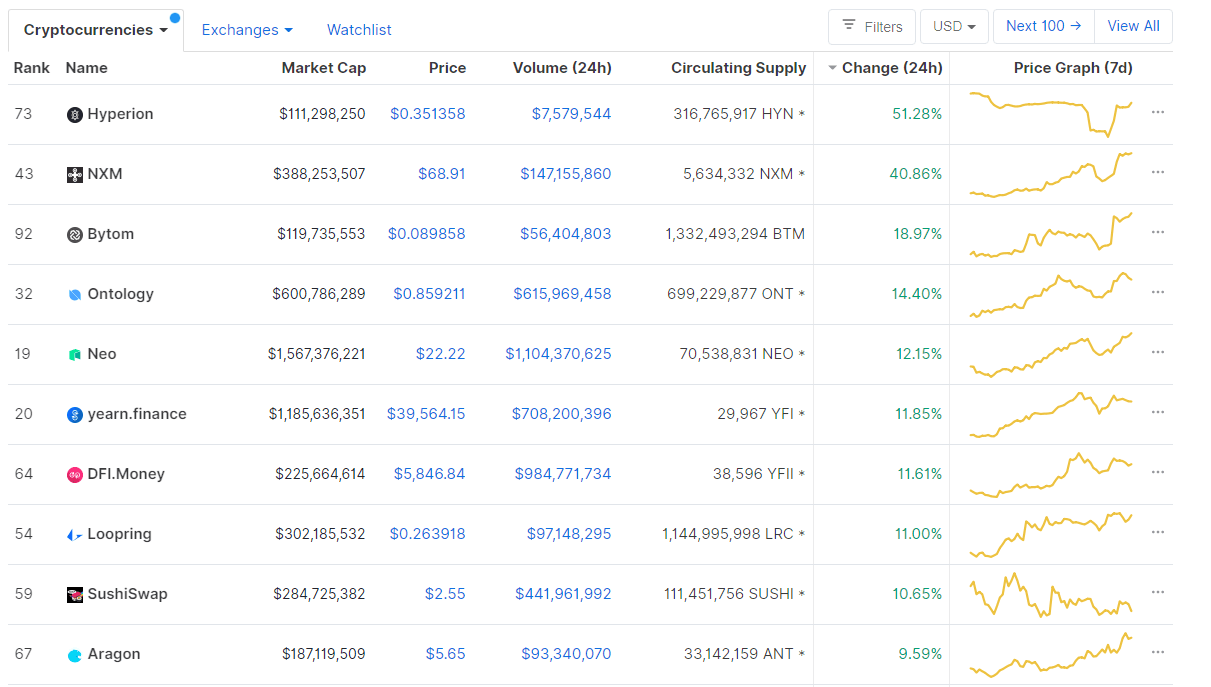
Top 10 24-hour Performers (Click to enlarge)
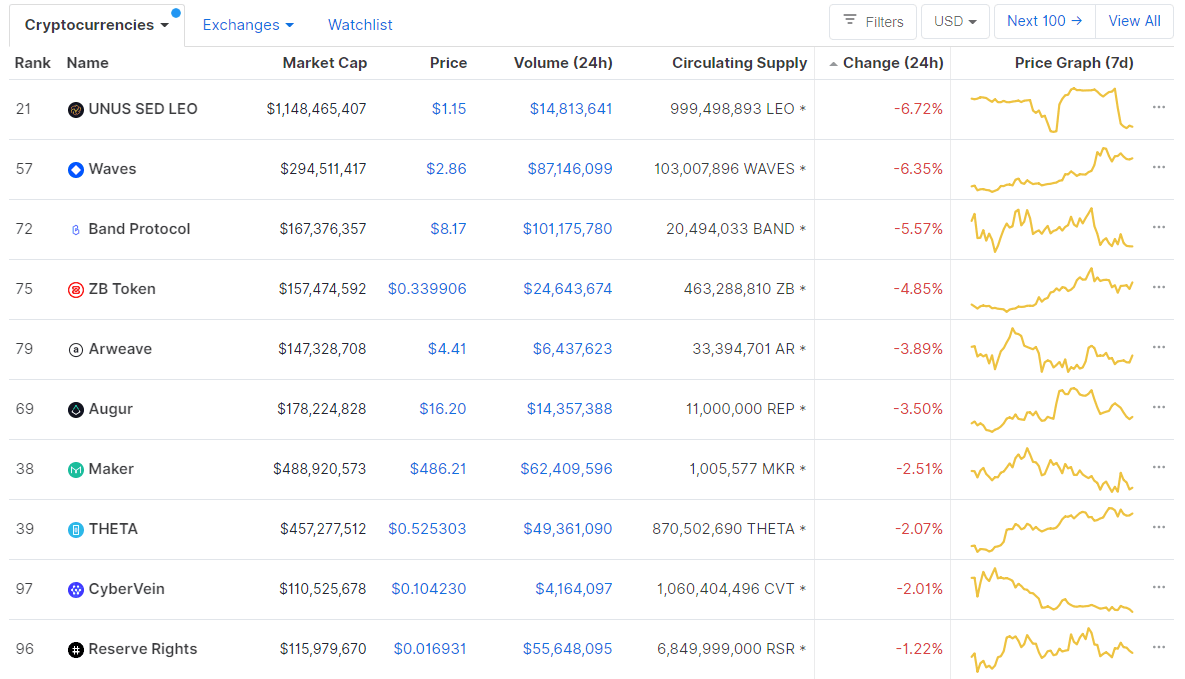
Bottom 10 24-hour Performers (Click to enlarge)
Bitcoin’s dominance level experienced a slight increase since our last report, with its value currently being at 59.47%. This value represents a 0.1% difference to the upside when compared to when we last reported.
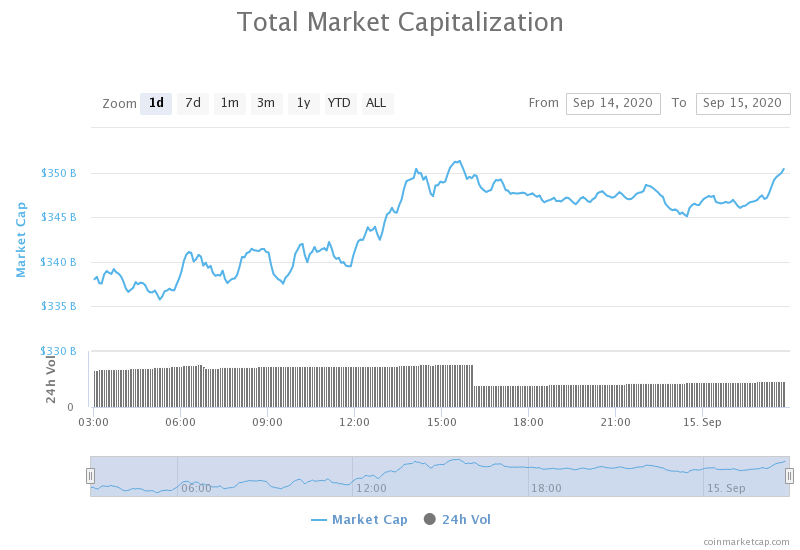
Daily Crypto Market Cap Chart
The crypto sector capitalization has skyrocketed in the past 24 hours. Its current value is $351.49 billion, which represents an increase of $15.59 billion when compared to our previous report.
_______________________________________________________________________
What happened in the past 24 hours?
_______________________________________________________________________
- CFTC files charges against 4 defendants in bitcoin investment fraud suit (The Block)
- Set Labs teams up with DeFi Pulse to launch ‘one-click exposure’ index (The Block)
- Bitcoin Bulls Bet on BTC Reaching $36,000 by Christmas (Cryptobriefing)
- All You Need to Know About the Sushi Swap Story (But Were Afraid to Ask) (Cryptobriefing)
- Crypto.com to Leverage Chainlink Oracle Price Feeds for DeFi Product (Cryptobriefing)
- Binance Chain is getting its own DeFi yield farms after Ethereum (Cryptoslate)
- Coinbase CEO blasts Apple’s “restrictive” policies towards crypto and DeFi (Cryptoslate)
- What is Pickle Finance? Ethereum DeFi craze rallies 1,000% in one day (Cryptoslate)
- Paxful, Citing Regulations and Its Own ‘Risk Tolerance,’ Exits Venezuela’s P2P Bitcoin Market (Coindesk)
- Whales can use Bitcoin to purchase private jets (Cointelegraph)
_______________________________________________________________________
Technical analysis
_______________________________________________________________________
Bitcoin
Bitcoin has made a move towards the upside, passing through its $10,360 and $10,500 levels. As we mentioned in our previous articles, this is a huge bullish sign, and the overall indicators are showing that as well. If the bulls regain momentum, we can expect a push towards $11,000 once the consolidation continues.
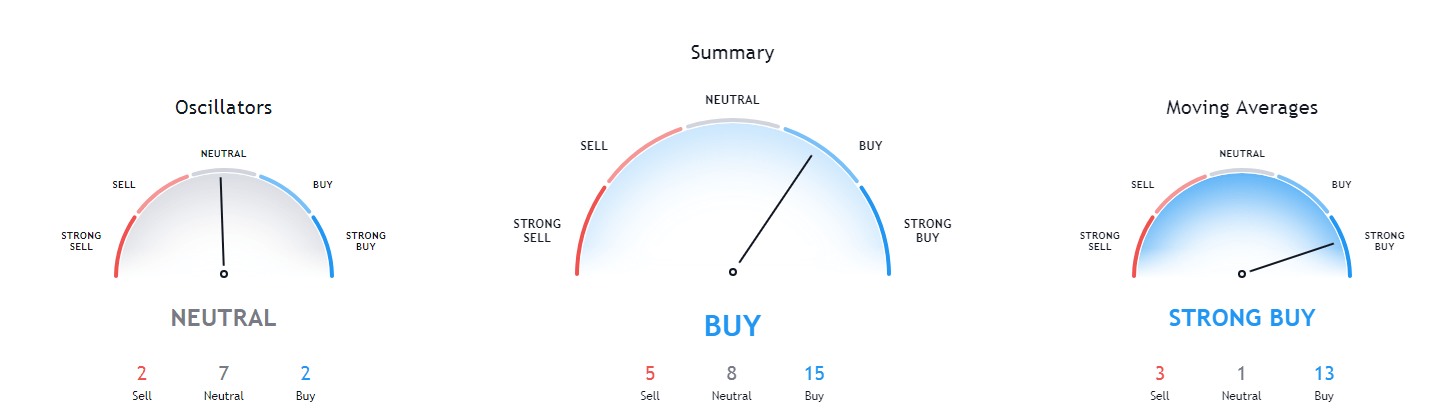
With that being said, Bitcoin’s current price movement got stopped at the $10,850 level. While this does mean that Bitcoin bulls have encountered some resistance, it certainly does not mean that the overall trend is over. Bitcoin has shown great resistance at the $10,000 psychological level, which prompted this push towards the upside.
BTC/USD 4-hour Chart
Technical factors:
- Price is above both its 50-period EMA and 21-period EMA
- Price is right at the top Bollinger band
- RSI is overextended to the upside, though with more room to go up (67.45)
- Volume is stable
Key levels to the upside Key levels to the downside
1: $10,850 1: $10,630
2: $11,000 2: $10,500
3: $11,090 3: $10,360
Ethereum
Ethereum was extremely volatile in the past 24 hours. Its price movements were quite hectic, with the price pushing past the $371 level and reaching the $385 mark before coming back down to restest the newly-conquered level, only to go up again and down again. Ethereum is currently supported by both the 50-period and 21-period moving averages, which are right below its price level. On top of that, the $371 level was turned to a support level after a clean confirmation move.
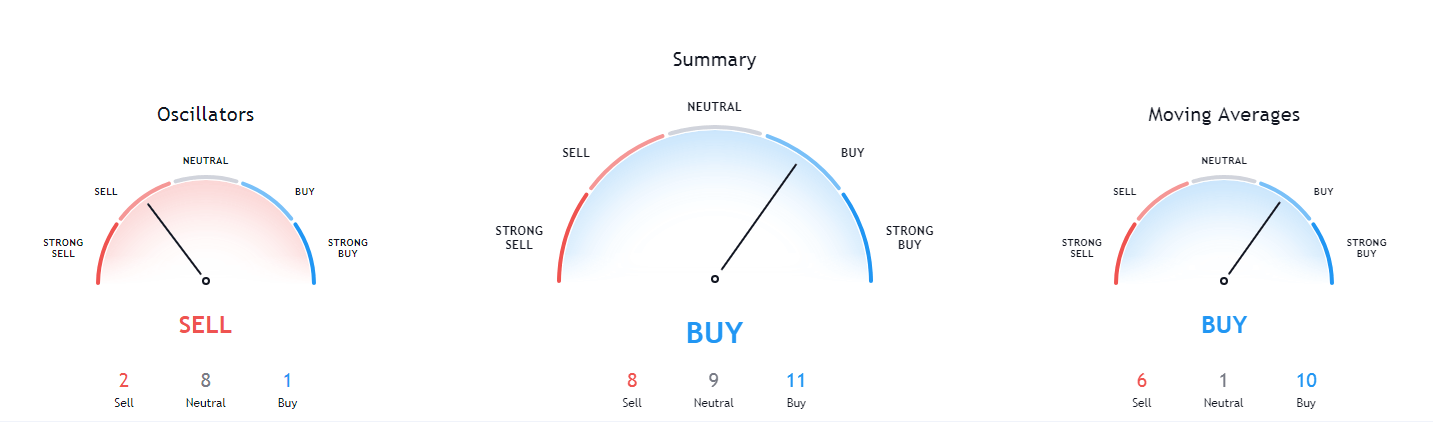
While its technicals show a short-term buy opportunity, the long-term technicals are still tilted towards the sell side. On top of that, Ethereum has created a nice bear flag formation, which (if it turns out to be correct) can prompt a 35% move towards the downside.
ETH/USD 4-hour Chart
Technical Factors:
- The price is right above both its 21-period and its 50-period EMA
- The price is right above the middle Bollinger band
- RSI is neutral (53.36)
- Volume is low and stable
Key levels to the upside Key levels to the downside
1: $400 1: $371
2: $415 2: $360
3: $445 3: $340
Ripple
XRP has managed to push itself above the $0.2454 level once again, but still hasn’t confirmed its position above it. A confirmation above this level and a slight push towards the upside will be crucial for the future of XRP, as many traders are calling for bearish scenarios and drawing a bearish flag (though this flag is a lot less picture-perfect as the one on the ETH/USD chart).
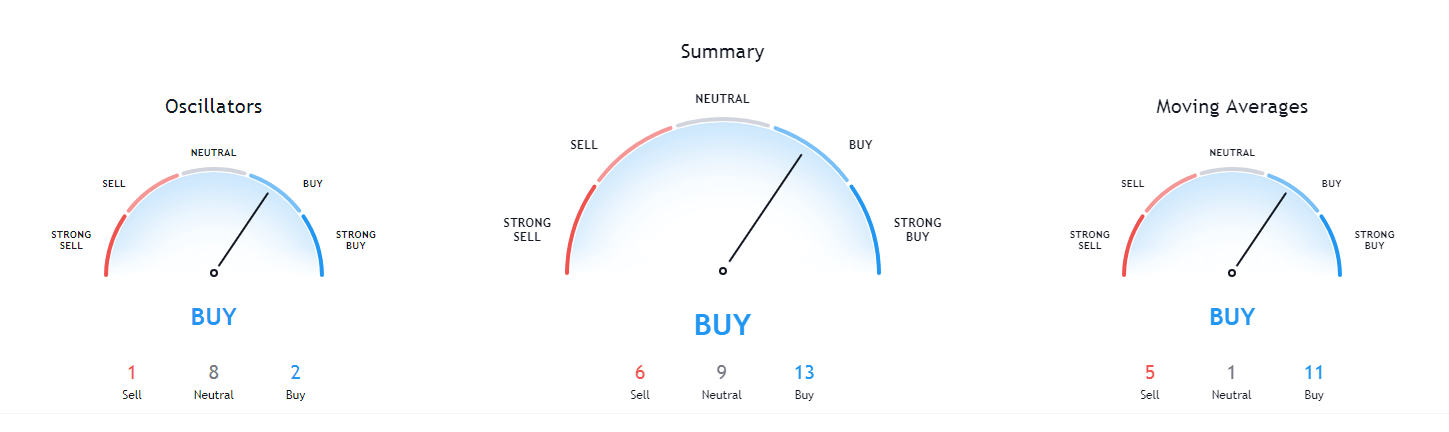
XRP is showing signs of slight short-term bullishness, while its longer-term technicals are still pointing towards the downside.
XRP/USD 4-hour Chart
Technical factors:
- The price is just above its 21-period EMA and its 50-period EMA
- Price is right above its middle Bollinger band
- RSI is neutral and pushing towards the upside(54.88)
- Volume is extremely low, but stable
Key levels to the upside Key levels to the downside
1: $0.2454 1: $0.235
2: $0.266 2: $0.227
3: $0.285 3: $0.221
Related posts
 Daily Crypto Review, Feb 10 – Bitcoin fighting to regain $10,000 after a sudden crash occurs
 Daily Crypto Review, Feb 17 – Altcoins take a dive as Bitcoin drops under $10,000; Craig Wright suing BTC and BCH?
 Daily Crypto Review, May 28 – “We Are All Satoshi” – Craig Wright Exposed?
 Daily Crypto Review, Jun 19 – Bitcoin Mid-Term Bullish vs. Bearish Outlook – Explained
One reply on “Daily Crypto Review, Sept 15 – BTC Heading Towards $11,000; ETH Facing a 35% Drop?”
Hopefully a push back up to the 12k mark!